Multipurpose high-resolution seismic acquisition: the deep-sea mining case - TGS
←
→
Page content transcription
If your browser does not render page correctly, please read the page content below
SPECIAL TOPIC: GLOBAL EXPLORATION HOTSPOTS

Multipurpose high-resolution seismic acquisition:
the deep-sea mining case
Adriana Citlali Ramírez1*, Fredrik Andersson2, Bent Kjølhamar1 and James Wallace3 present data
to show that the Norwegian Atlantic Margin is a new hotspot for deep-sea minerals

Summary                                                                     acquired AM20 pentasource streamer survey. The largest
The oil and gas industry has developed highly sophisticated                 recorded offsets were ~60 km.
technology for offshore hydrocarbon exploration. The traditional        2)	Ultra high-density simultaneous sourcing towed streamer –
focus has been on hydrocarbon exploration and production tar-               Near-surface studies and minerals test, using a decasource
gets. These targets are commonly buried under a few kilometres              simultaneous sourcing scheduled with signal apparition
of sedimentary layers and 3D seismic technology has been the                encoding.
main type of data acquired for characterizing these targets. A sec-     3)	Ultra high-density simultaneous sourcing sparse OBN – 2D
ondary focus has been on the shallow section, and it has mostly             R&D test using the decasource shots from test 2.
been driven by shallow hazard investigations to aid the drilling        In this paper, we concentrate on test 2, motivated by deep-sea
of those targets. This characterization is commonly done with 2D        mineral (DSM) exploration.
high-resolution seismic referred to as site surveys. In recent years,       There has been an increasing need for precious metals world-
shallower targets have been sought for carbon capture and storage       wide and this need is expected to continue rising in the following
(CCS). It is best to store carbon dioxide in its critical state which   decades. Besides the increase in population and prosperity, this
is achieved at burial depths of about 800 m. Thus, the goal is to       need is driven by the fact that access to metals and rare earth
locate porous rocks with a natural seal at depths of 800 m-1500 m       minerals is an important prerequisite for producing batteries, wind
below the seabed. Deeper reservoirs can be used for CCS, but            turbines and solar panels, which in turn is important for reducing
shallower ones are more economical. In addition, offshore               greenhouse gas emissions. It has been known for decades that
mineral exploration is at the point of becoming a commercial            within the deep ocean spreading ridges (such as the Norwegian
activity. To characterize these mineral reservoirs or deposits, the     Mohn’s Ridge), there are sulphide deposits rich in copper, zinc,
selected type of data needs to resolve the very near surface (first     cobalt, and rare earth minerals. These deposits are located at deep
few decameters) at a very high resolution in an efficient way that      water areas (average bathymetry of 2300 m), over a volcanic layer.
enables the location of targets with an area extension of 100 to            Offshore mineral deposits start their life as black smokers
300m. Thus, in 2021 3D seismic is aimed at best resolving the           or white smokers (Figure 1). These smokers are hydrothermal
very shallow and the very deep. These facts motivated the set of        vents similar to hot springs or geysers found onshore, but they
experiments acquired in the AM20-lab in the Norwegian Atlantic          exist on the ocean floor. They are fissures on the seafloor near
Margin in 2020.                                                         spreading ridges that are volcanically active areas where tectonic
     In this paper, we focus on AM20-lab test 2. While the focus of     plates are moving apart at spreading centres. The fissures allow
test 2 is to achieve ultra-high resolution near surface 3D seismic      magma to rise into the cold deep seawater and it is rapidly cooled
for mineral exploration, the data provides multipurpose value for       to form new crust. As the process continues, seawater is filtered
medium and deep targets as well. The survey was designed and            through these fissures. The filtered water increases the pressure
acquired with a novel signal apparition decasource encoding and         in the rocks, and it is heated by the magma. Then the water and
was benchmarked against pentasource data from a production mul-         pressure set off a reaction that dissolves minerals. As the water is
ticlient survey which was designed for hydrocarbon exploration          less dense than the rocks, it rises to the surface of the crust and
                                                                        exits, bringing these minerals out and forming chimneys. The
Introduction and motivation                                             minerals in the chimneys are cooled down by the deep seawater
In late summer 2020, a set of test surveys were acquired as an          and get solidified into mineral deposits. For commercial DSM
extension of the TGS 3D multiclient streamer survey Atlantic            exploitation, the goal is not to find and produce active smokers
Margins (AM20) in the Norwegian Sea. We refer to these tests as         but extinct ones. Where the cycle has stopped and there are no
the AM20-Lab. They comprise:                                            active chimneys.
1)	Sparse OBN with free-fall nodes – Hybrid survey test,                   Extinct deep sea mineral deposits consist of small structures
    where the shot carpet comes from the simultaneously                 (collection of metals and rare earth minerals) of a horizontal

    11
         TGS |   2
                     Apparition Geoservices |   3
                                                    Polarcus
    *
        Corresponding author, E-mail: Adriana.Citlali.Ramirez@tgs.com
    DOI: xxx

                                                                                        FIRST   BREAK   I   VOLUME   39   I   MAY   2021   1
SPECIAL TOPIC: GLOBAL EXPLORATION HOTSPOTS

                                                                      sources and a blending pattern that can be sufficiently decoded
                                                                      into individual source records.
                                                                           The location of test 2 was selected to cover shallow anomalies
                                                                      (nearby the Egga Slide in the Norwegian Sea) that can be used
                                                                      as analogues to the DSM targets in the Mohn’s Ridge, where the
                                                                      first DSM Norwegian licensing round is expected. The contrast
                                                                      and geological setting are not the same, but the size, complexity,
                                                                      bathymetry, and depth of these shallow anomalies are sufficiently
                                                                      similar. Furthermore, the decoded data isolated long shot records
                                                                      that can be used for imaging of deeper targets for, e.g., CO2
                                                                      sequestration or even hydrocarbon exploration.

                                                                      On simultaneous sourcing
                                                                      For over two decades, the industry has implemented different
                                                                      simultaneous sourced seismic data acquisition technologies
                                                                      [Beasley et al., 1998]. Most methods for simultaneous sourcing
                                                                      rely on random time delays for encoding, combined with
                                                                      coherency-based filtering techniques for decoding [Hampson
                                                                      et al., 2008]. These random time delays or dithers can either
                                                                      explicitly be introduced when selecting firing times or by shoot-
                                                                      ing on position where a natural variation on the order of 100s
Figure 1 Illustration of a black smoker.                              of ms per sailline is caused by varying vessel speeds, which are
                                                                      influenced by the presence of waves and currents, among other
extent of about 100-300 m and a few decameters vertically, gen-       operation variables. Random dither decoding techniques often
erally covered by a layer of pelagic mud that ranges in thickness     exploit the fact that when aligning/time-shifting the simultaneous
from ten to a few hundred metres. These are very shallow, high        source data in the time-frame of a first source, energy from one
contrast targets, with p-wave velocities in the range of 4000-        or more of the other sources appear incoherent (e.g., Akerberg
6500 m/s and densities between 3000 and 4500 kg/m3 (Ludwig            et al. [2008], Ji et al. [2012], Abma et al. [2015], Andersson
et al., 1998).                                                        et al. [2016]). Alternative deblending methods are based on,
     To date, the mapping of these deposits has been mainly an        e.g., principal component analysis [Ikelle 2007], robust linear
academic endeavour with limited budgets, but this is about to         algebra [Moore et al. 2016], and inversion [Jiawen et al. 2020].
change particularly in Norway for two reasons: i) the already         Whereas enhanced productivity was the original motivation for
stated global demand for batteries and ii) because Norway is the      simultaneous source surveys, the surveys can be designed to also
first country to pass a law that would allow production of these      enable quality improvements (less noise per isolated shot record
offshore resources (Kjølhamar et al., 2020). Several types of         and increased sampling density). This improvement assumes that
geophysical data had been measured and used, but only a handful       the contributions from the different sources can be sufficiently
of these deposits had been found. This is likely caused by the        well separated in processing.
limitations in the type of surveys acquired (mainly UAV-based              In most common designs, the sources are not shooting simul-
multi-beam echo sounder, a few CSEM, and 2D seismic profiles).        taneously or even close to simultaneously. Instead, the approach
The small size of these targets makes them easy to miss with          relies on selecting shot point intervals that are shorter than those
the used technology. Based on this and the future commercial          used in conventional flip/flop survey designs. The SPI is selected
opportunities, modern 3D streamer seismic technology could            to obtain a time interval in the data where no strong energy from
become the data of choice. If designed properly, it can provide       the succeeding shot is present (often within the time interval asso-
efficiency (large footprint, penetration, high resolution) and be     ciated with the conventional recording of the wavefield produced
cost-effective.                                                       by an isolated source, propagating through the subsurface of the
     Modern 3D vessels combined with wider-towed source arrays        earth, reaching the main target and propagating back to be fully
can provide a footprint of about 1 km crossline with up to 6 source   recorded at the receivers). The assumption is that within this time
lines (if each string of airguns is used as an individual source      window, the energy associated with the preceding shot is also
array) with standard equipment. To increase source sampling           significantly weaker than that of the current shot, and that data
density, it is now common to acquire overlapping source records       in this region appear relatively clean even without any attempt of
and deblend them in processing. A constraint of the field test was    removing the residual shot noise caused by the preceding shot.
to achieve higher sampling density and efficiency at the same              An alternative simultaneous source technique is to encode
cost per square kilometre as the multiclient AM20 programme           sources using signal apparition, as first presented by Robertsson
that used a pentasource, staggered grid configuration with            et al. [2016]. Such an approach allows for all sources to fire
overlapping source records every three seconds on average. Thus,      essentially at the same time (within a few 10’s of ms relative
a signal-apparition source encoding design was chosen for test        to each other). Due to the fact that seismic data is contained in
2, to acquire a much denser shot carpet with truly simultaneous       a signal cone in the FK-domain, the problem of separating the

2         FIRST    BREAK     I   VOLUME    39   I   MAY   2021
SPECIAL TOPIC: GLOBAL EXPLORATION HOTSPOTS

contributions from the different sources following signal-appari-
tion style encoding can be shown to be exact in FK subdomains
[Andersson et al., 2017a]. Amundsen et al. [2018] derive explicit
formulas for the separation of an arbitrary number of signal-appa-
rition encoded sources. The region where such a direct approach
is applicable to fully separate the individual source contributions
is limited and additional structure needs to be imposed to fully
separate the sources in practice. Andersson et al. [2017b] describe
a methodology for this purpose that is based on quaternion
representations.

AM20-Lab Test 2
The 3D AM20 multiclient programme was acquired with 12
streamers deployed at a 12.5 m crossline separation and 5 sources
(1510 cu.in. and 2000 psi) at 50 m crossline separation, shot in
a staggered grid with overlapping records. The inline separation        Figure 2 Source Configuration.
between sequential shot points was 7.5 m, with a shot point
interval (SPI) for a given source of 37.5 m. The sampling rate was      subsurface lines by firing all sources almost simultaneously. To
2 ms. This pentasource dataset, the benchmark, was deblended            overcome the inherent acquisition challenge of having sufficient
and resampled at 3 ms, following the processing sequence of the         time to recharge the guns with air, the inline geometry and
multiclient programme.                                                  symmetrical design of the arrays would be leveraged to create
    The same vessel and physical configuration were used to             two sources per sub-array so that the centre of each source (front
acquire test 2 with signal-apparition source encoding. Each of the      half and back half) would populate a shot grid of half of the
five sources in the vessel consisted of a single airgun array string.   required SPI (figure 2). Thus, the AM20-lab test 2 was designed
For test 2, the latter was partitioned (by the gun controller) into a   to test this concept by repeating a sail line from the pentasource
front and an aft sub-array and shot as independent sources (Wal-        production survey, as mentioned above. The test required no
lace et al., 2020). Resulting in 10 sources, each corresponding to      physical reconfiguration of in-sea equipment, only adjustments
a sub-array of 900 cu.in. and 1800 psi. At each SPI, 10 sources         to the onboard operating systems. The SPI used was 16.67 m,
were fired almost simultaneously, achieving a decasource con-           allowing the desired grid and sufficient time to recharge all
figuration grouped in 5 source lines, resulting in a much denser        sources before the next shotpoint.
regular source-carpet sampled at 8.33 m by 50 m. The sampling               The 40 km test line was successfully completed, overcoming
rate was 1ms. The signal-apparition decasource measurements             two main challenges: The first was related to the gun controller:
were decoded at 1ms and compared against the benchmark.                 as this was a non-standard setup, the configuration files had to be
                                                                        adjusted to fire all ten sources almost simultaneously. The second
A note on acquiring the first-ever decasource                           was related to the gun firing pressures. The original idea was to
streamer seismic experiment                                             maintain the same pressure as in the pentasource. However, this
There have been several years of multi-source survey design             is not feasible when simultaneously firing sources at this short
development and field experiments to validate the evolving              SPI. The constraint is mechanical; the size of the gun orifice and
concepts. The start, for streamer seismic, can be tracked back to       the rate at which pressurized air can be forced through being the
three key field tests comparing three to two sub-array sources in       limiting factor. Thus, to maintain vessel speed and this short SPI,
offshore Norway (Langhammer and Bennion, 2015), offshore                it was decided to reduce the internal firing pressure by 200 psi
Australia (Hager and Fontana, 2017) and offshore Brazil (Rocke          less than nominal at 1800 psi. No negative geophysical impact
et al., 2018). These tests provided valuable evidence supporting        was expected and non has been observed.
the concept of reducing source output by about a third while still
producing sufficient signal, well above the noise floor. This con-      AM20-Lab Test 2
cept combined with reduced shot point intervals and deblending          The goal of the test was to achieve higher frequencies and
processing steps allows acquisition geophysicists to optimize           overall signal resolution than in the pentasource benchmark.
spatial sampling and reduce survey duration.                            Figure 3 shows common channel gathers for the central source
    The concept evolved by using single sub-array sources               line and central receiver line from (a) the decoded decasource
as independent sources, allowing up to six sources with more            data set and (b) the deblended pentasource data set for the first
flexibility in towing arrangements with existing hardware. Single       two seconds after the water bottom reflection. As can clearly
sub-array sources further reduce the source output, typically 9 dB      be seen in the zoom-ins (Figure 3 (b, d) (1-2)) in the bottom
down from a three sub-array source and 6 dB down from a two             row, the much denser source sampling (8.3 m inline interval)
sub-array source. This concept is now standard in the industry.         of the decasource dataset results in better-resolved diffractors.
    The need to design an ultra-high-resolution 3D seismic sur-         The decasource dataset has about 4.5 times more inline samples
vey for DSM exploration enabled the testing of the next evolu-          than the pentasource dataset, sampled at 37.5 m inline source
tion of the concept to improve the shot density along individual        interval.

                                                                                           FIRST    BREAK   I   VOLUME   39   I   MAY   2021   3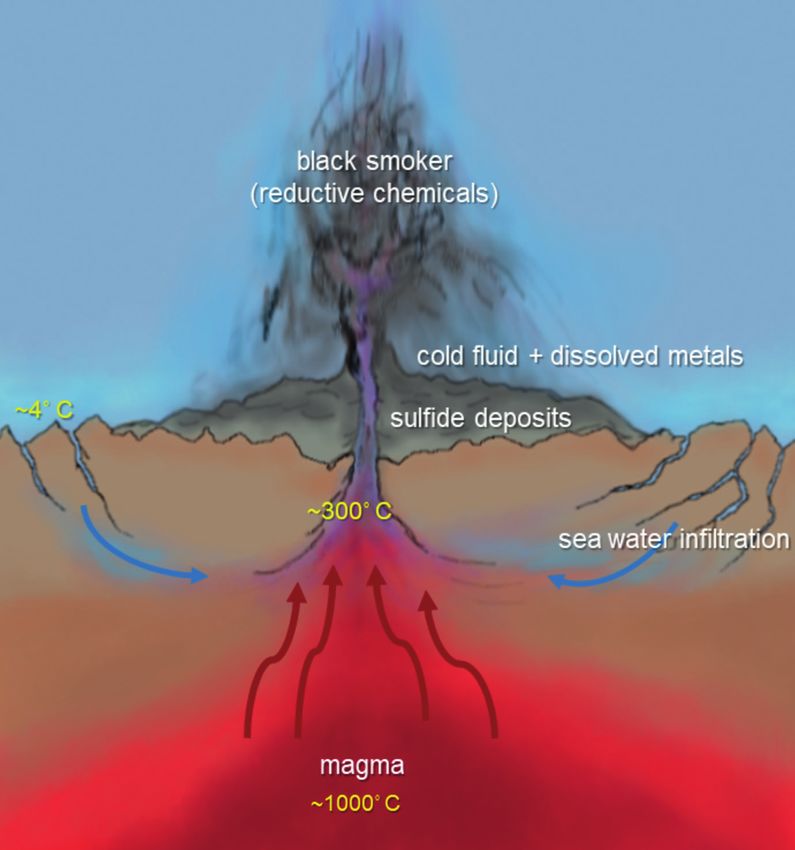
SPECIAL TOPIC: GLOBAL EXPLORATION HOTSPOTS

                                                          Figure 3 Comparison of channel gathers for the
                                                          central source lines and receiver lines in a time
                                                          window of 2-4 seconds (top row) and a zoom in
                                                          (bottom row). The horizontal axis shows inline
                                                          position along the sail line in km. Left column:
                                                          Apparition decoded data. Right column: Decoded
                                                          pentasource data.

                                                          Figure 4 Frequency panels for 2-9 seconds
                                                          of data. For each of the data sets 7 different
                                                          bandpass filters have been applied. From left
                                                          to right 2-4, 4-8, 8-16, 16-32, 32-64, 64-128,
                                                          128-256 and 256-512 Hz, respectively. Left:
                                                          Apparition decasource; Right: Staggered
                                                          pentasource.

4      FIRST   BREAK   I   VOLUME   39   I   MAY   2021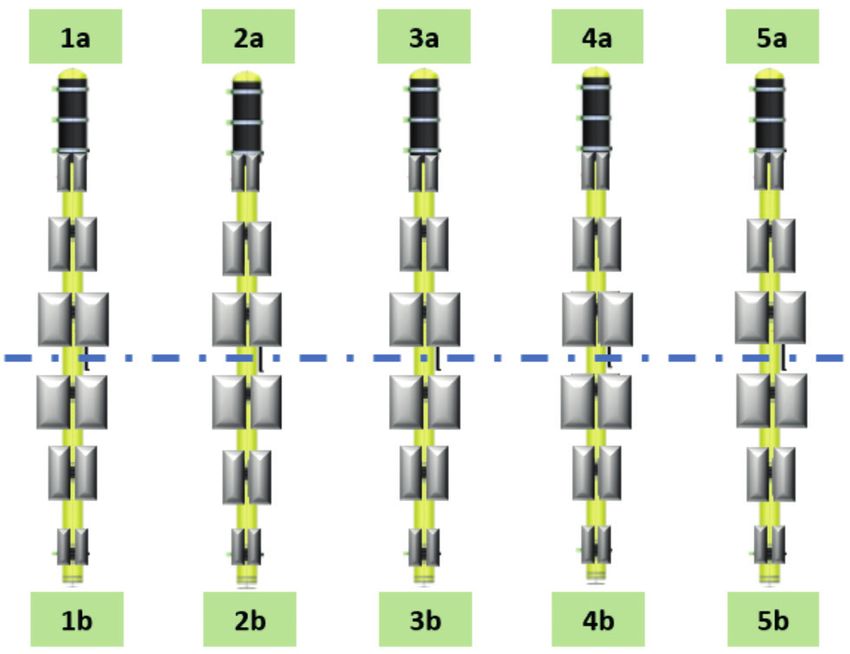
SPECIAL TOPIC: GLOBAL EXPLORATION HOTSPOTS

    In Figure 4 the same common channel gathers (19-23 km by             extent of this event is about 25 m. For 500 Hz maximum frequency
2-9 s) are shown in different frequency panels. For each of the          at 1 ms sampling, several orders of ghost notches must be dealt
frequency panels a combination of a Butterworth low-cut and a            with and the ghost events removed. The ghosts can simplistically
Butterworth high-pass filter was applied, each at 18 dB per octave.      be viewed as time shifted (along with sign change) replicas of
Even though the main objective of test 2 was high resolution for         the true data, where the time-shifts vary depending on the offsets
shallow targets, it is relevant to observe that the signal at longer     or recorded angles. The time shifts are typically small, about
times (deep targets) is also well recovered, and different orders        10-20 ms (depending on the source and receiver depths which in
of diffracted sea surface multiples are well sampled. Again, the         this case are 6 and 12 m). In this regard, the impact that they leave
data from test 2 has higher SNR at all travel-times than that of         on the data will be similar to the time-shift caused by the signal-ap-
the benchmark, even though the source strength is 40% weaker.            parition encoding for the simultaneous sources. Thus, rather than
    Figure 5 displays a comparison of the common channel                 first decoding the simultaneous data and then deghosting the result,
gathers in a time window from 2-10 s, after applying a 4 Hz low-         the decasource was processed with a joint decoding, deghosting
pass filter (18 dB/octave Butterworth). The decoded decasource           and designature algorithm. This is illustrated in Figure 6.
data has better SNR than the deblended pentasource data. Both
the higher fold and the constructive interference of the apparition      AM20-Lab Test 2 Geological setting
encoded sources at low frequencies are factors that contribute           The survey area sits in the Norwegian Sea, the outer western
towards the enhanced signal. The quantification of the quality of        part of the Møre Basin, and onto the Møre Marginal Plateau, a
this low frequency signal is the subject of future work.                 row of SSW-NNE trending basement highs covered by break-up
    For high-resolution shallow imaging, the effects of the ghost        volcanism (55 ma). These highs have evidence of block faulted
must be eliminated. The presence of the ghost creates a smearing         sedimentary rocks covered by thick sections of basalts (Figure 7).
effect in depth. If the primary and its ghosts are migrated as if they   Within the survey area these basalts are estimated to be a few hun-
corresponded to a single event with a wavelet, then the vertical         dred metres thick in the west and thinning within the inner flows,

                                                                                                     Figure 5 Low frequency results at 4 Hz.
                                                                                                     Comparison of channel gathers for the central
                                                                                                     source lines and receiver lines in a time window
                                                                                                     of 2-10 seconds. The horizontal axis shows inline
                                                                                                     position along the sail line in km. Left: Decoded
                                                                                                     decasource data. Right: Decoded pentasource
                                                                                                     data.

                                                                                          FIRST   BREAK   I   VOLUME    39   I   MAY   2021          5
SPECIAL TOPIC: GLOBAL EXPLORATION HOTSPOTS
Figure 6 Zoomed in section of migrated results. Top: Decasource joint decoded/deghosted/designature; Bottom: Pentasource deblended (post-migration deghosted).
the eastern part of the system. The inner flows represented in this analogous to the bathymetry at the Mohn’s ridge in the Northern
survey consist of hyaloclastites, volcanoclastic debris flows, and Atlantic. At the seafloor and in the upper hundreds of metres
invasive flows [Millett, J., et. Al., 2019]. The inner flows and the there are small faults and compressional features within the
Cretaceous basin below have been intruded by volcanic sills cre- Neogene sediments. The survey line sits just west of the big
ating a very challenging seismic terrain. The younger succession sub aquatic Egga slide (~6000 bp) and this slide seems to have
consists of clay-rich, unconsolidated sediments where the amorph affected the near seafloor events on our survey line (Box 2 in
silica to Opal-CT and the Opal-CT to Quartz seismic reflectors figure 3). We interpret small scale reverse faults and shortening
are predominant and typical for muddy rocks. Several weak layers in the uppermost tens of metres probably as an effect from the
have slumping features, are partly mobilized and several siliceous Egga slide nearby. These features serve well as analogues to
ooze diapirs are seen in intermediate levels between the seafloor sulfide complexes with regard to size and their shallow position.
and the basalts below (Box 1 in figure 3). In the preliminary time migrations of the decasource line, we can
observe defined features down to 20 m horizontally and 1-2 m
AM20-Lab Test 2 Geological observations vertically (at water speed). Compared to the reported sizes of
The test’s target were analogues of DSM sulphide complexes sulphide complexes [Murton et. al. 2019], typically 100-300 m
(figure 8). The bathymetry in this area is between 2000-2300 m, in diameter and up to 60 m thick, a 20 m resolution should as
6 FIRST BREAK I VOLUME 39 I MAY 2021SPECIAL TOPIC: GLOBAL EXPLORATION HOTSPOTS
Figure 7 Legacy 2D data showing the geological setting of the AM20-lab.
Figure 8 A time slice of the time migrated decasource at 75ms below the seabed with two structures highlighted that are analogs of sulphite deposits (the areas extend
between 100-200m). As a reference, a vertical slice is also displayed.
such be sufficient to identify and find the extents of real sulphide sulphide deposits, but not too dissimilar. This fact combined with
complexes. the analog structures give us a good indication that the results
Murton, et. Al. [2019] reports that the sulphides’ prop- of this feasibility test are enough to qualify this technology for
erties are within the ranges of 4000 < vp < 6000 m/s and offshore mineral exploration.
3000 < ρ < 4500 kg/m3, while the altered basalts have an esti-
mated vp =4100 m/s and 2600 < ρSPECIAL TOPIC: GLOBAL EXPLORATION HOTSPOTS
known that there are sulphide deposits rich in precious metals Ikelle, L. [2007]. Coding and decoding: Seismic data modelling, acquisi-
as well as rare earth minerals within the deep ocean spreading tion and processing. In: SEG Technical Program Expanded Abstracts
ridges. The seismic structure that needs to be understood is in a 2007, Society of Exploration Geophysicists, 66-70.
rather shallow and small region underneath the seabed. Ji, Y., Kragh, E. and Christie, P. [2012]. A new simultaneous source
A field test has been conducted to assess the possibility to separation algorithm using frequency-diverse filtering. In: SEG
image these structures using a decasource signal apparition con- Technical Program Expanded Abstracts 2012, Society of Exploration
figuration with a 3D streamer spread. Results show that this is a Geophysicists, 1-5.
feasible and cost-effective option for ultra-high resolution seismic Jiawen, S., Peiming, L., Pengyuan, S., Guandong, D., Wei, Y., Yingpeng,
and enhances shallow target characterization. In particular, the C. and Xiaoming, Z. [2020]. Deblending of simultaneous OBN data
geophysical and geological objectives were met with more than via sparse inversion. In: SEG Technical Program Expanded Abstracts
sufficient resolution to identify analogues of sulphide complexes 2020, Society of Exploration Geophysicists, 106-109.
in slightly less seismic contrast than expected on real sulphides Kjølhamar, B., Ramírez, A.C. and Jansen, S. [2020]. Seismic Acquisition
in the Mid Atlantic Mohn’s Ridge. To get the final proof that and Processing: The Technology Race. GEO Magazine, November
3D seismic is indeed an effective exploration tool for sulphides, 9, 30-34.
we suggest repeating this test on the real targets. Thus, we are Langhammer, J. and Bennion, P. [2015]. Triple-source simultaneous
planning a scientific expedition to the Arctic in late summer 2021. shooting (TS3) a future for higher density seismic? 77th EAGE
Finally, the data also seem suitable for deeper target characteriza- Conference and Exhibition, Extended Abstracts, 1-5.
tion in, e.g., oil and gas exploration due to its broadband features Ludwig, R., Iturrino, G. and Rona, P. [1998]. Seismic velocity-porosity
and improved deep data quality and SNR. This will be the subject relationship of sulfide, sulfate, and basalt samples from the TAG hydro-
of future publications. thermal mound. In: Proceedings of the Ocean Drilling Program-Scien-
tific Results. Texas A&M University, College Station, TX., 313-327.
Acknowledgements Millett, J., Manton, B., Zastrozhnov, D., Planke, S., Maharjan, D., Bellwald,
Phil Fontana, Johan Robertsson, and Jon Rogers are gratefully B., Gernigon, L., Faleide, J.I., Jolley, D.W., Walker, F., Abdelmalak,
acknowledged. M.M., Jerram, Myklebust, R., Kjølhamar, B.E., UST6, Halliday, J.
The AM20 multiclient dataset belongs to a TGS multi-year and Birch-Hawkins, A. [2020]. Basin structure and prospectivity of the
3D programme in the Atlantic Margin. It was processed by TGS NE Atlantic volcanic rifted margin: cross-border examples from the
and migrated by Apparition Geoservices. Faroe–Shetland, Møre and Southern Vøring basins. Geological Society
The AM20-lab test 2 dataset belongs to a TGS feasibility London Special Publications.
study for offshore mineral exploration. The test was acquired by Moore, I., Fletcher, R., Beasley, C. and Castellanos, C. [2016]. Data studies
Polarcus, the processing was done by Apparition Geoservices. of simultaneous source separation using robust linear algebra. In: SEG
Technical Program Expanded Abstracts 2016, Society of Exploration
References Geophysicists, 4623-4626.
Abma, R., Howe, D., Foster, M., Ahmed, I., Tanis, M., Zhang, Q., Murton, B.J, et. Al. [2019]. Geological fate of seafloor massive sulphides
Arogunmati, A. and Alexander, G. [2015.] Independent simul- at the TAG hydrothermal field (Mid-Atlantic Ridge), Ore Geology
taneous source acquisition and processing. Geophysics, 80(6), Reviews, 107.
WD37-WD44. Robertsson, J.O., Amundsen, L. and Pedersen, Å.S. [2016]. Signal appa-
Akerberg, P., Hampson, G., Rickett, J., Martin, H. and Cole, J. [2008]. rition for simultaneous source wavefield separation. Geophysical
Simultaneous source separation by sparse Radon transform. In: SEG Journal International, 206(2), 1301-1305.
Technical Program Expanded Abstracts 2008, Society of Exploration Rocke, M., Wallace, J. and Sandvik, P. [2018]. Multisource acquisition in
Geophysicists, 2801-2805. salt basins. SEG Technical Program, Expanded Abstracts, 156-160.
Andersson, F., Van Manen, D.J., Wittsten, J., Eggenberger, K. and Wallace J. et al. [2020] More Smaller Sources in Marine Seismic
Robertsson, J.O. [2017]. Quaternion dealising for simultaneous source Acquisition. Second EAGE Marine Acquisition Workshop, Volume
separation. In: SEG Technical Program Expanded Abstracts 2017, 2020, p.1-3.
Society of Exploration Geophysicists, 4322-4327. Wallace, J., Rocke, M., Hager, E., Rogers, M., Craiggs, C. and Fontana,
Hager, E. and Fontana, P. [2017]. Penta Source: High-Resolution Marine P. [2020]. More Smaller Sources in Marine Seismic Acquisition. In:
Seismic from Shallow to Deep Water. 79th EAGE Conference and 2nd EAGE Marine Acquisition Workshop, Oslo, Norway and Online.
Exhibition, Extended Abstracts, 1-5. European Association of Geoscientists & Engineers.
8 FIRST BREAK I VOLUME 39 I MAY 2021You can also read