Color Rendering: Beyond Pride and Prejudice
←
→
Page content transcription
If your browser does not render page correctly, please read the page content below
Color Rendering: Beyond Pride
and Prejudice

M.S. Rea,* J.P. Freyssinier
Lighting Research Center, Rensselaer Polytechnic Institute, Troy, New York 12180

Received 4 June 2009; revised 14 August 2009; accepted 18 August 2009

Abstract: It is a truth, universally ignored, that a single                should provide good color discrimination between subtle
metric of color rendering must be in want of another. Evi-                 differences in hue, and should, from a marketing and
dence presented here, together with those from an earlier                  sales perspective, be preferred as a light source over one
study, strongly suggest that the quest for a single metric                 with poor color rendering properties. Color rendering
to quantify color rendering will be in vain. Rather, the                   index (CRI) does not meet those expectations.3
strengths of color rendering index (CRI) and of gamut                         The intent behind the development of CRI was to char-
area index (GAI)y seem to counteract the weaknesses of                     acterize how ‘‘true’’ or ‘‘natural’’ colors were rendered
one another, such that together they can be used to guide                  under electric light sources.3 In response to the recog-
lighting practitioners in choosing a source that will pro-                 nized, inherent limitation of CRI, Judd, one of its devel-
vide good color rendering of most objects in most appli-                   opers, proposed ‘‘flattery index’’ as a complementary mea-
cations. The present study was conducted to determine                      sure of color rendering to characterize how ‘‘vivid’’ or
whether sources, both warm and cool, with high levels of                   ‘‘flattering’’ objects, particularly skin, might be rendered
both CRI (above 80) and GAI (above 80 and less than                        by light sources.4 A few years later, Thornton promoted
100) were judged better than ones with high levels of just                 the concept of gamut area as another measure of color
CRI or just GAI. The results support the conclusion that a                 rendering, emphasizing ‘‘color discrimination.’’5 Indeed,
two-metric system of color rendering is needed for                         many alternative or complementary measures of the color
general illumination applications.  2010 Wiley Periodicals,               rendering properties of light sources have been proposed
Inc. Col Res Appl, 35, 401 – 409, 2010; Published online 7 January 2010    since CRI was developed.4–25 Nevertheless, CRI has
in Wiley Online Library (wileyonlinelibrary.com). DOI 10.1002/             become the primary measure of light source color render-
col.20562                                                                  ing by the lighting community.25
                                                                              The inability of CRI to characterize color rendering has
Key words: color rendering; gamut area; CRI; solid state                   become more apparent to members of the lighting com-
lighting; LEDs                                                             munity with the development of light-emitting diodes
                                                                           (LEDs) for general lighting applications. ‘‘White’’ sources
                         INTRODUCTION                                      composed of multiple narrowband LED spectra have illus-
                                                                           trated more clearly the limits of CRI for characterizing
Color rendering is an imprecise construct associated with                  the color rendering properties of electric light sources.
a light source, not with the objects being illuminated.                    Several studies have recently been published showing that
Implicitly, and following P.J. Bouma’s description of                      narrowband LED sources with low CRI can be preferred
daylight as an ideal light source,1,2 a light source with                  to broadband sources with high CRI.26–29 Several
good color rendering should make everyday objects in                       researchers have explored other candidate metrics for
architectural applications appear vivid and natural, it                    characterizing color rendering.4–25 Recently, following
                                                                           much earlier work by Thornton,5,30–32 Rea and Freyssinier
   *Correspondence to: Mark S. Rea (e-mail: ream@rpi.edu).                 demonstrated that gamut area index (GAI) was much bet-
   Contract grant sponsors: U.S. Environmental Protection Agency,          ter than CRI as a predictor of color discrimination,33 one
ASSIST program at the Lighting Research Center.
  y
   The gamut area of the equal energy spectrum is scaled to 100 and all
                                                                           important aspect of color rendering. Rea and Freyssinier
other spectra are defined in terms of gamut area index (GAI), which can     also showed that GAI and CRI were sometimes nega-
be greater or less than 100.                                               tively correlated with each other; one metric would be
                                                                           positively related to subjective judgments of ‘‘vividness’’
V
C 2010 Wiley Periodicals, Inc.                                             and of ‘‘naturalness’’ while the other would be negatively

Volume 35, Number 6, December 2010                                                                                               401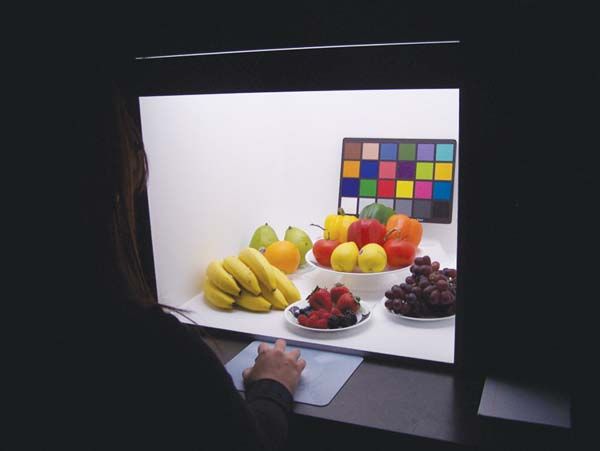
warm and cool, with high levels of both CRI (‡80) and
GAI (‡80 and 100) were judged better than ones with
high levels of CRI or of GAI only. Several commercially
available sources that do meet these CRI and GAI criteria
are provided in the Appendix.
METHODS
Observers
Eighteen observers volunteered for the experiment,
10 males and 8 females. All had normal color vision, as
confirmed by the Ishihara pseudo-isochromatic plates
screening method,34 and were corrected to normal visual
acuity (20/20 or better). The mean age for all subjects
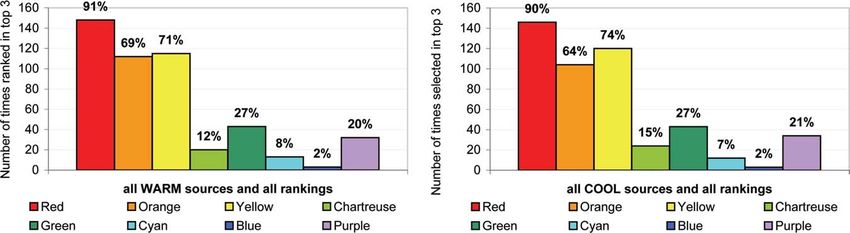
FIG. 1. View of the experimental apparatus. was 26.2 years (sd ¼ 5.5 years) with a median age of 24
years (range: 21 to 38 years). The experiment was
approved by Rensselaer’s Institute Review Board (IRB).
related to these same judgments.33 Moreover, neither GAI
Apparatus and Light Sources
nor CRI were ever consistently predictive of these
judgments; sometimes GAI was a better predictor of A matte-white viewing cube, 2 ft (61 cm) on each side
judgments of ‘‘naturalness’’ and ‘‘vividness’’ than CRI, (Fig. 1), provided diffuse illumination from one of six dif-
and sometimes the opposite was true. What Rea and ferent spectral power distributions (SPDs; Fig. 2). The
Freyssinier concluded from their experiments was that a SPDs were produced by mixing light from among nine
source providing high levels of both CRI and GAI should different commercially available light sources including
be consistently preferred over one that only had a high one 10-W bi-pin halogen lamp, two phosphor-based white
level of CRI or one that only had a high level of GAI.33 LEDs (Luxeon V 5000 K and Nichia Jupiter 6500 K),
The purpose of the present study was to conduct an and six colored LEDs (Luxeon I with peak wavelengths
a priori test of this conclusion. In particular, the present of 450 nm, 465 nm, 525 nm, 530 nm, 625 nm, and 638
study was conducted to determine whether sources, both nm). For testing purposes, the six SPDs were grouped in
FIG. 2. Relative spectral power distributions of the warm white CCT (left) and cool white CCT (right) light sources.
402 COLOR research and application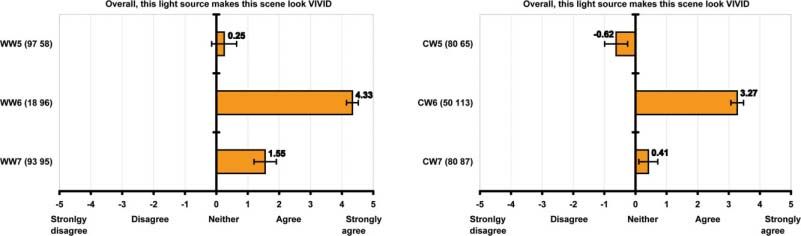
TABLE I. Photometric and colorimetric characteristics of the six light sources used in the experiment.
                                       Horizontal
Light source                       illuminance (lx)a          CCT           CRI (Ra)      GAI      CIE 1931 x       CIE 1931 y         Du0 v0

WW5 (high CRI, low GAI)                   363               2880   K          97           58        0.4432            0.4020          0.0016
WW6 (low CRI, high GAI)                   384               2919   K          18           96        0.4343            0.3891          0.0057
WW7 (high CRI, high GAI)                  366               3147   K          93           95        0.4041            0.3498          0.0186
CW5 (high CRI, low GAI)                   330               4585   K          80           65        0.3640            0.3994          0.0155
CW6 (low CRI, high GAI)                   357               4606   K          50          113        0.3569            0.3590          0.0008
CW7 (high CRI, high GAI)                  346               4788   K          80           87        0.3522            0.3635          0.0031
  a
      The variation in horizontal illuminance between the center of the box and any of the corners was less than 25 percent in all cases.

terms of ‘‘warm’’ and ‘‘cool’’ CCTs. The three warm                           to be readily understandable and meaningful to subjects
white SPDs (denoted WW5, WW6, and WW7) ranged in                              when evaluating the color rendering properties of the light
CCT from 2800 K to 3200 K, whereas the cool white                             sources and to increase evaluation consistency among the
SPDs (denoted CW5, CW6, and CW7) ranged in CCT                                subjects. In this experiment, the ‘‘acceptability’’ criterion
from 4500 K to 4800 K. The six light sources are charac-                      was also introduced so as to determine if ratings of
terized in terms of their CCT, CRI, GAI, and chromaticity                     acceptability were more or less related to subjective judg-
in Table I; these measurements are based upon the SPDs                        ments using the other two criteria. Following instructions,
reflected off the interior walls of the cube. The spectral                     the observers saw the display illuminated by each of the
reflectance of the cube’s walls is shown in Fig. 3. All                        six light sources once, presented in random order in a
spectral measurements were taken with a calibrated spec-                      practice session.
troradiometer (PR-705; Photo Research Inc., Chatsworth,                          Each observer then participated in two short sessions,
CA, USA). The three sources within each CCT group                             one session for each of the warm and the cool CCT sour-
were chosen specifically to have three different combina-                      ces, separated by a short break. The total time required of
tions of CRI and GAI. The convention used for labeling                        each subjects was 30 min or less. In each session, the dis-
the light sources is such that sources designated with a 5                    play was seen by every observer three times under each
(i.e., WW5 and CW5) have high CRI (‡80) and low GAI                           of the three SPDs, for a total of nine presentations. The
(65), those designated with a 6 have low CRI (\80)                           order of the nine presentations was randomized by com-
and high GAI (‡80),{ and those designated with a 7 have                       puter for each observer. All the trials for the first CCT
both high CRI (‡80) and high GAI (‡80 and 100). The                          group were completed before starting the trials for the
horizontal illuminance at the center of the test box ranged                   second CCT group. CCT sessions were counterbalanced
from 330 lx to 384 lx (average ¼ 355 lx) across light                         across observers.
sources (Table I). The matte finish of the white paint                            Observers were asked to look at the display for as long
helped achieve a uniform illuminance distribution across                      as they wished before they responded to the questions
the bottom of the box. In all cases, the illuminance at the                   presented by computer in Fig. 4. The computer program
center of the box was within 6 25% of the illuminance at                      was used to control the presentations and to collect the
either corner of the box.                                                     answers from the observers. At the end of each session,
   Fresh fruits (pears, oranges, bananas, strawberries, blue-                 observers were asked for informal comments on the pros
berries, blackberries, and grapes) and vegetables (green,                     and cons of each source as it rendered each of the hues in
red, and orange bell peppers and lemons), and one color                       the display to help the experimenter understand the atti-
chart (ColorChecker Chart; X-Rite, Grand Rapids, MI,                          tudes of the observers regarding color rendering.
USA) were arranged in the viewing cube to emulate a                              To minimize changes in the fruits and vegetables, the
store display (Fig. 1). The position of the objects in the                    experiment was completed in less than 48 h. Although
display remained constant throughout the experiment.                          a systematic characterization of the ripening of the

Procedures
   Observers were instructed as to the purpose of the
study at the beginning of the experiment using the
instructions shown in Fig. 4. As explained and used in
our previous study,33 subjects were asked to make their
evaluations based upon the psychological criteria of ‘‘viv-
idness’’ and of ‘‘naturalness.’’ These criteria were chosen

   {
     A source with a GAI greater than 100 was chosen with the expectation
that this source would make illuminated objects appear highly saturated       FIG. 3. Relative spectral reflectance of the experimental
(i.e., vivid), but not necessarily natural or preferred.                      box interior.

Volume 35, Number 6, December 2010                                                                                                          403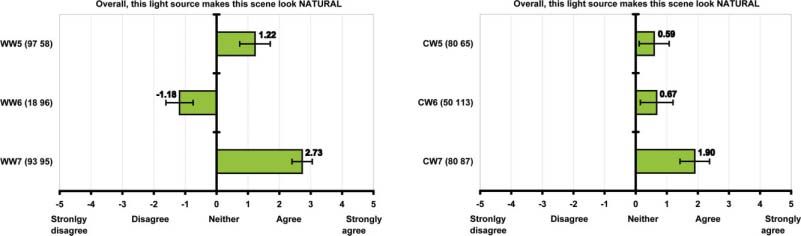
FIG. 4.   Instructions given to the observers at the beginning of the experiment.

fruits and vegetables was not conducted, changes to             as his/her own control in one session, thereby eliminat-
their color and texture were not perceived by the               ing any possible confounding of light source type with
experimenters. More importantly, each observer served           fruit ripening.

FIG. 5. Average level of agreement given to warm CCT (left) and cool CCT (right) light sources in terms of how natural
they render the display. Error bars represent 6 one standard error of the mean (n ¼ 18). The CRI and GAI values of each
light source are given in parentheses after light source notation. [Color figure can be viewed in the online issue, which is
available at wileyonlinelibrary.com.]

404                                                                                 COLOR research and application
FIG. 6. Average level of agreement given to warm CCT (left) and cool CCT (right) light sources in terms of how vivid they
render the display. Error bars represent 6 one standard error of the mean (n ¼ 18). The CRI and GAI values of each light
source are given in parentheses after light source notation. [Color figure can be viewed in the online issue, which is avail-
able at wileyonlinelibrary.com.]

                           RESULTS                                         Figure 5 and the statistical analyses support the hypoth-
                                                                        esis that a light source with both a high level of CRI and
Judgments of Naturalness, Vividness,
                                                                        a high level of GAI will render the display more naturally
and Acceptability
                                                                        than the other two sources of the same CCT but having
   Two-factor (light source and CCT) analyses of variance               either a high level of CRI or a high level of GAI. Figure
(ANOVAs) were conducted for each of the judgments:                      6 and the statistical analyses show that although these
naturalness, vividness, and acceptability.                              two sources (WW7 and CW7) do render the display viv-
   Figures 5 and 6 show the mean level of agreement                     idly, they do not render the display most vividly. Rather,
given to the light sources in terms of how natural and                  GAI is the better indicator of subjective ratings of vivid-
how vivid each light source rendered the display, respec-               ness, as shown by the high ratings of vividness for both
tively. In the case of judgments of vividness, both light-              WW6 and CW6. But clearly, high levels of GAI do not
source (F2, 216 ¼ 154.61, P \ 0.001) and CCT (F1, 216 ¼                 ensure high ratings of naturalness, reinforcing the need
21.24, P \ 0.001) resulted in statistically significant main             for both an upper and a lower limit for the GAI of a light
effects, but the interaction (F2, 216 ¼ 0.09, P \ 0.911)                source for optimal color rendering. Similarly, high values
between these factors was not statistically significant. For             of CRI do not ensure, by themselves, high ratings of natu-
judgments of naturalness, light source (F2, 216 ¼ 19.39,                ralness. WW5, for example, has a very high level of CRI
P \ 0.001) resulted in a statistically significant main                  (97), but with its low value of GAI (58), it is not seen as
effect whereas CCT (F1, 216 ¼ 0.14, P ¼ 0.715) did not.                 the source that renders the display most naturally. Finally,
However, the interaction between light source and CCT                   CRI, by itself, is not a metric well related to impressions
(F2, 216 ¼ 13.42, P \ 0.001) was statistically significant               of vividness. In fact, the sources with the highest CRI in
for naturalness. Paired two-tailed t-tests were performed               the warm set of sources and in the cool set of sources are
comparing the sources within each CCT in terms of both                  associated with the lowest rating of vividness.
naturalness and vividness. Table II summarizes the proba-                  Figure 7 shows the percentage of times that each light
bilities of a Type I error resulting from the different post            source was deemed acceptable to the observers in the
hoc t-test comparisons.                                                 context of a grocery store. The ANOVA for judgments of

TABLE II. Probabilities of a Type I error for each of the post hoc paired two-tailed t-tests within each CCT and
for judgments of both naturalness (left) and vividness (right).
                         Naturalness                                                                   Vividness
            Comparison pair                            P value                           Comparison pair                           P value

WW5 (1.22)                 WW6 (21.18)                 \0.001                WW5 (0.25)                  WW6 (4.33)                \0.001
WW5 (1.22)                 WW7 (2.73)                   0.003                WW5 (0.25)                  WW7 (1.55)                 0.001
WW6 (21.18)                WW7 (2.73)                  \0.001                WW6 (4.33)                  WW7 (1.55)                \0.001
CW5 (0.59)                 CW6 (0.67)                   0.894                CW5 (20.62)                 CW6 (3.27)                \0.001
CW5 (0.59)                 CW7 (1.90)                   0.001                CW5 (20.62)                 CW7 (0.41)                 0.010
CW6 (0.67)                 CW7 (1.90)                   0.041                CW6 (3.27)                  CW7 (0.41)                \0.001

  Statistically significant differences meeting the criterion of P \ 0.05 are indicated in bold. Numbers in parentheses indicate the average
rating for each subjective evaluation.

Volume 35, Number 6, December 2010                                                                                                    405
FIG. 7. Average percentage of times warm CCT (left) and cool CCT (right) light sources were deemed acceptable by
observers. Error bars represent 6 one standard error of the mean (n ¼ 18). The CRI and GAI values of each light source
are given in parentheses after the light source notation.
light source acceptance indicated that the main effect of play that most influenced their opinion about the color
lightsource (F2, 216 ¼ 4.67, P \ 0.016) was statistically rendering properties of each light source evaluated. The
significant but CCT (F1, 216 ¼ 1.26, P ¼ 0.276) was not; percentage of times that each one of the eight hues was
the interaction between light source and CCT (F2, 216 ¼ selected in one of the top three positions was calculated
8.29, P \ 0.001) was also statistically significant. Similar across all sources in each CCT group. Figure 8 summa-
to the ratings of naturalness and vividness, paired two- rizes these percentages for each hue.
tailed t-tests were performed for the percentage of times It can be readily appreciated from Fig. 8 that ‘‘warm’’
each light source was deemed acceptable. Table III sum- colors (i.e., red, orange, and yellow) were the most
marizes probabilities of a Type I error resulting from the prominent in informing the observer’s opinions in terms
different post hoc t-tests for each paired comparison. of naturalness, vividness, and acceptability of the light
It can be readily appreciated from Fig. 7 that the two sources. It is also interesting to note that there is practi-
light sources with both high CRI and high GAI (WW7 and cally no difference in the rankings between the cool and
CW7) were selected as acceptable more times than the warm CCTs. As discussed, there was no statistically sig-
other two sources within the warm and within the cool nificant difference between cool and warm CCTs in ob-
CCTs. Comparing Figs. 5 and 7, it would appear that rat- server ratings of naturalness (Fig. 5) or for acceptability
ings of naturalness and acceptability are similar for this (Fig. 7). Indirectly then, it would seem that the appear-
type of display and that high levels of both CRI and GAI ance of the red, orange, and yellow fruits and vegetables
are important. Ratings of vividness do not appear to be ho- most strongly influenced observer ratings of naturalness
mologous with ratings of acceptability, or at least not in the and of acceptance. It is not possible to infer from these
context of a simulated grocery display. Thus, even if colors data, however, whether the observers’ judgments would
appear more vivid, they are not necessarily seen as more ac- have been different if more blue and purple objects had
ceptable. For displays of this type then, where fruits and been used in the display or if the display had been
vegetables are so prominent, judgments of acceptability arranged differently. As a final note for this section, Rea
seem to mirror those of naturalness, not vividness. and Freyssinier found that when assessing warm hues,
observers indicated a higher degree of vividness from
Ranking of Most Influential Hues warm light sources than that from cool light sources.33
Consistent with those findings, observers in this study
The last question asked of the observers during each found warm object hues (i.e., red, orange, and yellow) to
presentation was to rank the top three hues within the dis- be the most influential in making their judgments of
vividness and naturalness (Fig. 8) and the warm sources
TABLE III. Probabilities of a Type I error for each of to produce the most vivid display (significant main effect
the post hoc paired t-tests within each CCT and for of CCT illustrated in Fig. 6).
ratings of acceptability.
Comparison pair P value
WW5 (70%) WW6 (43%) 0.074 DISCUSSION
WW5 (70%) WW7 (91%) 0.023
WW6 (43%) WW7 (91%) 0.003 Color rendering by electric light sources is important for
CW5 (48%) CW6 (63%) 0.289
CW5 (63%) CW7 (76%) 0.009 architectural applications where any variety of colored
CW6 (63%) CW7 (76%) 0.248 objects might be illuminated. Indeed, lighting practitioners
consider color rendering to be more important than lumi-
Statistically significant differences meeting the criterion of P \
0.05 are indicated in bold. Numbers in parentheses indicate the nous efficacy in many applications (homes, retail, restau-
average percentage of times each source was ‘ acceptable.’’ rants and health care facilities).25
406 COLOR research and applicationFIG. 8. Percentage of times that each hue was ranked in the top three positions, for all warm (left) and all cool (right) light
sources, as being influential in the observers’ decisions. Warm CCT (left) and cool CCT (right) light sources were deemed ac-
ceptable by observers.
A light source with good color rendering properties is stated criteria for CRI (‡80) and GAI (‡80 and 100)
expected to affect the appearance of illuminated objects should make objects appear vivid (but not too vivid), nat-
positively so that they appear vivid and natural. That ural and acceptable. A precise, single metric of color ren-
source should also enable good color discrimination dering is not then needed by the lighting community
among object colors with subtle differences in hue, satu- because reliance on a single metric will likely misinform
ration or lightness. And, in general, it should be accepted and disappoint lighting practitioners concerned with color
by people as a source of illumination for a wide variety rendering. What is needed is a practical measurement sys-
of colored objects. As concluded by Rea and Freyssinier, tem for characterizing the ability of a light source to
however, no single metric can represent the color render- render most colors well enough, most of the time, for
ing ability of a source if all of these expectations are to most people. An electric light source meeting the two-
be met.33 The results of the present study reinforce those metric color rendering criterion [CRI (‡80) and GAI (‡80
reported previously by Rea and Freyssinier, namely that 100)] is likely to meet that need. The pursuit of a single
high levels of GAI or of CRI are not, alone, predictive of metric of color rendering is then probably one based upon
all color judgments.33 Each metric has its strengths and either pride or prejudice.
weaknesses, but together, sources with high levels of both Finally, it must be clearly and unambiguously stated
CRI and GAI are found acceptable for architectural appli- that accepting ‘‘well enough’’ should not be the only goal
cations such as a colorful grocery store display. There- for practical color research, or even for some specific
fore, these results lead to the conclusion that for architec- lighting applications. It is still important, for example, to
tural applications, color rendering must be considered a be able to quantify a source’s ability to enhance the red-
broad but inherently contradictory construct that no single ness of hamburger in a butcher’s case, even if it does not
metric can ever fully capture. In effect, this is what Judd render the appearance of other objects very well. What is
said over 40 years ago.4 clearly needed is to go beyond the practical two-metric
Although the search for a single color rendering metric system of color rendering for architectural lighting pro-
is probably in vain, color rendering does have utility for posed here toward a precise set of metrics for predicting
the lighting industry as a broad construct for characteriz- the appearance of color attributes, like vividness and natu-
ing lamps that, with sufficient irradiance, will render all ralness. This must be at least a two-step process. It will
colors ‘‘well enough.’’ Certainly users and practitioners first be necessary to characterize the sensory information
expect to be given an indication of a lamp’s ability to available for analysis by the conscious brain (e.g.,
render colors in architectural applications. CRI does not vividness). It will then be necessary to characterize the in-
fulfill that promise, as several recent studies have demon- terpretive framework for that sensory information (e.g.,
strated, nor does GAI. Following the recommendations by naturalness). The former goal is likely more tractable than
Figueiro et al.,35§ and the data presented by Rea and the latter because the neural mechanisms underlying
Freyssinier, here and earlier,33 a lamp meeting both the human color vision are fairly well established and several
models of human color vision have been published.36–39
Individual experience as it affects preferences and mean-
§
Figueiro et al.35 proposed the use of GAI and full spectrum color index ings associated with the sensory information will be more
as complementary metrics to augment CRI in the context of neonatal inten- difficult to accurately describe.40 Different cultures will
sive care units where good color rendering is critical to properly diagnose probably have different associations with different colors,
and treat patients. The recommendation by Figueiro et al.35 for GAI is a
range with both a lower (65) and an upper (100) limit. The upper limit and different objects would probably be associated with
(100) was proposed because colors that are over-enhanced (i.e., too satu- different preferences by different people. A recent inter-
rated) can appear distorted. esting paper by Lee et al. demonstrates what common
Volume 35, Number 6, December 2010 407TABLE AI. Examples of light sources that meet the criteria for CRI (‡80) and GAI (‡80 and 100).
Light source Manufacturer Specification CCT (K) CRI (Ra) GAI
Xenon OSRAM Sylvania 1000W 5853 97 91
PC-LED Cree XRE lamp 4154 84 82
PC-LED Sharp Zenigata 5097 95 99
RGB-LED Various Peak wavelengths of 465 nm, 4000 89 82
545 nm, and 614 nm
T8 General Electric F32T8SPX50 4751 87 86
T8 Lumiram Lumichrome 1XX 5960 93 95
T8 Verilux F32T8VLX 6369 85 96
T12 OSRAM Sylvania Design50, 40W 4861 90 84
T12 General Electric Sunshine F40C50 4944 92 87
T12 Duro-Test Vitelite 5500 5159 88 90
T12 Lumiram Lumichrome 1XC 5207 92 93
T12 Philips Colortone 75 6217 90 85
T12 Duro-Test DAYLITE 65, 40W 6588 93 95
MH Philips CDM100W/4K 4075 93 80
MH Philips CDM150W/4K 4197 92 83
Daylight CIE D50 5000 100 88
Daylight CIE D65 6500 100 98
PC-LED: phosphor converted white light emitting diode.
RGB-LED: red, green and blue LEDs mixed to create white light.
T8: linear fluorescent, 1 inch diameter.
T12: linear fluorescent, 112 inch diameter.
MH: metal halide.
sense would likely say; namely, that people have different 1. Nickerson D. Light sources and color rendering. J Opt Soc Am
favorite colors and that people have different preferred 1960;50:57–69.
2. Bouma PJ. Physical Aspects of Colour; An Introduction to the
colors for different objects.41 Some people like red motor- Scientific Study of Colour Stimuli and Colour Sensations, Eind-
cycles, others prefer blue. Some people like yellow shirts, hoven: Philips Gloeilampenfabrieken (Philips Industries) Technical
others prefer green. In all probability, and notwithstanding and Scientific Literature Dept., 1948.
dichromacy and anomalous trichromacy, people have 3. CIE. Technical report: Method of Measuring and Specifying Colour Ren-
dering Properties of Light Sources. Publication CIE No. 13.3. Vienna,
much the same sensory information but the interpretation Austria: Commission Internationale de l’Éclairage; 1995. 16 p.
of that information will depend upon the person’s own 4. Judd DB. A flattery index for artificial illuminants. Illum Eng
experiences and predilections. 1967;62:593–598.
In summary, the multiple-metric color rendering pro- 5. Thornton WA. Color-discrimination index. J Opt Soc Am 1972;62:
posal introduced by Figueiro et al.35 and tested here is 191–194.
6. Jerome CW. Absolute color rendering. J Illum Eng Soc 1974;4:25–
practical and useful today for quantifying the color ren-
28.
dering properties of electric light sources used for archi- 7. Thornton WA. A validation of the color preference index. J Illum
tectural lighting; however, we still have some way to go Eng Soc 1974;4:48–52.
to predict how objects appear under different sources and 8. Einhorn HD. Colour Preference Index (Principles and Formulation
light levels.42 for Warm White Lighting). London: CIE Compte Rendu; 1975.
p 297–304.
9. Worthey JA. Opponent-colors approach to color rendering. J Opt
ACKNOWLEDGMENTS
Soc Am 1982;72:74–82.
Andrew Bierman, John Bullough, Mark Fairchild, 10. Xu H. Colour rendering capacity of illumination. J Illum Eng Soc
1984;13:270–76.
Mariana Figueiro, and Yoshi Ohno are gratefully 11. Seim T. In search of an improved method for assessing the colour
acknowledged for valuable input to the experiment and rendering properties of light sources. Lighting Res Technol 1985;
for their comments on earlier drafts of the manuscript. In 17:12–22.
particular, the authors would like to thank Leora Radetsky 12. Schanda J. A combined colour preference colour rendering index.
for conducting the experiments. Lighting Res Technol 1985;17:31–34.
13. Pointer MR. Measuring colour rendering—A new approach. Lighting
Res Technol 1986;18:175–184.
14. Van Kemenade JTC, Van Der Burgt PJM. Light sources and colour
rendition: Additional information to the Ra index. York: CIBSE, Natl
APPENDIX Lighting Conf 1988. p. 133–143.
15. Xu H. Colour rendering capacity and luminous efficiency of a spec-
Table AI contains examples of light sources that meet the trum. Lighting Res Technol 1993;25:131–132.
16. Hashimoto K, Nayatani Y. Visual clarity and feeling of contrast.
recommended criteria for CRI (‡80) and GAI (‡80 and
Color Res Appl 1994;19:171–185.
100) based on the initial recommendation for neonatal in- 17. van Kemenade JTC, van der Burgt PJM. Toward a User Oriented
tensive care units developed by Figueiro et al.35 This table Description of Colour Rendition of Light Sources: CIE 23rd Session.
is not intended to be a comprehensive compilation. New Delhi: CIE; 1995. Vol. 1, p 43–46.
408 COLOR research and application18. Fotios SA. The Perception of Light Sources of Different Colour 30. Thornton WA. Lamps for assessing metamerism. J Illum Eng Soc
Properties. PhD thesis, Manchester, UMIST UK, 1997. 1974;3:11–18.
19. Worthey JA. Color rendering: Asking the question. Color Res Appl 31. Thornton WA, Corth R, Evans GS. Fluorescent light sources. Light-
2003;28:403–412. ing Des Appl 1975;5:6–14.
20. Worthey JA. Color rendering: A calculation that estimates colorimet- 32. Thornton WA. The high visual efficiency of prime color lamps.
ric shifts. Color Res Appl 2004;29:43–56. Lighting Des Appl 1975;5:35–41.
21. Davis W, Ohno Y. Toward an improved color rendering metric. In Fer- 33. Rea MS, Freyssinier-Nova JP. Color rendering: A tale of two met-
guson IT, Carrano JC, Taguchi T, Ashdown IE, editors. Proceedings of rics. Color Res Appl 2008;33:192–203.
SPIE, Vol. 5941. San Diego, CA: Fifth International Conference on 34. Ishihara S. Tests for Colour-Blindness. Handaya, Tokyo: Hongo Har-
Solid State Lighting; 2005. p 59411G-1–59411G-8. ukicho; 1917.
22. Sándor N, Schanda J. Visual colour rendering based on colour differ- 35. Figueiro MG, Appleman K, Bullough JD, Rea MS. A discussion of
ence evaluations. Light Res Tech 2006;38:225–239. recommended standards for lighting in the NICU. J Perinato
23. Hashimoto K, Yano T, Shimizu M, Nayatani Y. New method for 2006;26:S19–S26.
specifying color-rendering properties of light sources based on feel-
36. Hurvich LM, Jameson D. Some quantitative aspects of an opponent-
ing of contrast. Color Res Appl 2007;32:361–371.
colors theory. II. Brightness, saturation, and hue in normal and
24. Szabó F, Bodrogi P, Schanda J. A colour harmony rendering index
dichromatic vision. J Opt Soc Am 1955;45:602–616.
based on predictions of colour harmony impression. Lighting Res
37. Hurvich LM, Jameson D. An opponent-process theory of color
Technol 2009;41:165–182.
25. Rea M, Deng L, Wolsey R. NLPIP Lighting Answers: Light Sources vision. Psychol Rev 1957;64:384–404.
and Color, Troy, NY: Rensselaer Polytechnic Institute; National 38. Guth SL, Lodge HR. Heterochromatic additivity, foveal spectral
Lighting Product Information Program; 2004. sensitivity, and a new color model. J Opt Soc Am 1973;63:450–
26. Van Trigt C. Color rendering, a reassessment. Color Res App 462.
1999;24:197–206. 39. Ingling CR, Russell P, Rea M, Tsou B. Red-Green opponent spectral
27. Narendran N, Deng L. Color rendering properties of LED light sour- sensitivity: Disparity between cancellation and direct matching meth-
ces. In Ferguson IT, Narendran N, Denbaars SP, Park Y-S, editors. ods. Science 1979;201:1221–1223.
Proceedings of SPIE, Vol. 4776. Seattle, WA: Solid State Lighting 40. Judd DB, Wyszecki G. Color in Business, Science and Industry, 3rd
II; 2002. p 61–67. edition. New York: Wiley; 1975.
28. Commission Internationale de l’Éclairage (CIE). Colour Rendering 41. Lee T-R, Tang D-L, Tsai C-M. Exploring Color Preference Through
of White LED Light Sources. Vienna, Austria: Commission Interna- Eye Tracking. In: Proceedings AIC Color 05–10th Congress of the
tionale de l’Éclairage; 2007. p 14. CIE No. 177:2007 (Publication International Colour Association. Granada, Spain, 2005. p 333–336.
CIE 177:2007, ISBN 978 3 901 906 57 2). 42. Deng L, Chen L, Rea MS. An evaluation of the Hunt94
29. Mahler E, Ezrati JJ, Françoise V. Testing LED lighting for colour color appearance model under different light sources at low
discrimination and colour rendering. Color Res Appl 2009;34:8– photopic to low mesopic light levels. Color Res App 2005;30:
17. 107–117.
Volume 35, Number 6, December 2010 409You can also read