HOUSING & HOMELESSNESS STRATEGY EVIDENCE BASE CHELTENHAM - The evidence base for Cheltenham's Housing & Homelessness Strategy 2018-2023
←
→
Page content transcription
If your browser does not render page correctly, please read the page content below

Appendix 2

DRAFT HOUSING & HOMELESSNESS STRATEGY 2018–2023 EVIDENCE BASE

 HOUSING & HOMELESSNESS STRATEGY
 EVIDENCE BASE
 CHELTENHAM
 The evidence base for Cheltenham’s Housing &
 Homelessness Strategy 2018—2023
DRAFT HOUSING & HOMELESSNESS STRATEGY 2018–2023 EVIDENCE BASE

   CONTENTS
   Introduction                                       3
   1   Overview                                       4
   2   Demographic, Economic and Social context       4
   3   Housing Supply                                 8
   4   Empty Homes                                    10
   5   Housing costs and affordability                11
   6   Housing Need                                   17
   7   Homelessness                                   23

                                                                2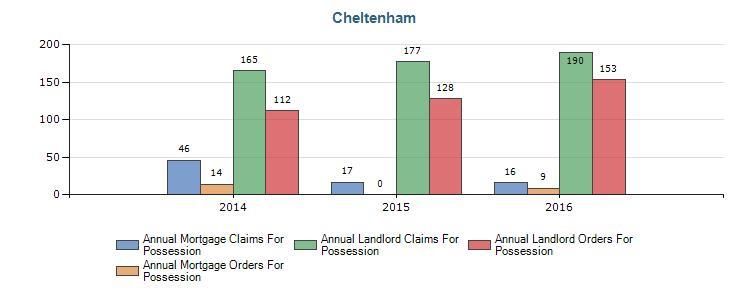
DRAFT HOUSING & HOMELESSNESS STRATEGY 2018–2023 EVIDENCE BASE

 Introduction
 This document is the evidence base for the 2018– 2023 Housing & Homelessness Strategy, looking at
 the key patterns and trends across a wide range of areas relating to Housing & Homelessness within
 Cheltenham.
 This evidence base consists of 7different sections:
 1.   Overview
 2.   Demographic, Economic and Social Context
 3.   Housing Supply
 4.   Empty homes
 5.   Housing Costs and Affordability
 6.   Housing Need
 7.   Homelessness

                                                                                                  3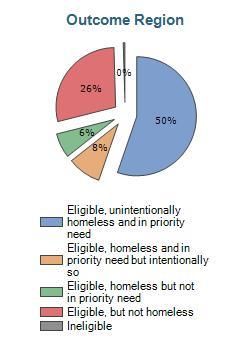
DRAFT HOUSING & HOMELESSNESS STRATEGY 2018–2023 EVIDENCE BASE
1. Overview
Cheltenham is an a regency spa town located on the edge of the Cotswolds in the South West of
England. Cheltenham is easily accessible from the M5 and lies just over an hour away from Bristol &
Birmingham and under 3 hours from London.* Whilst Cheltenham generally is an area of affluence it
also has significant areas of high deprivation and there are 3 wards in Cheltenham that are in the most
10% deprived areas of the UK.**

2. Demographic, Economic and social context
In 2016 the population of Cheltenham was estimated to be 117,500 of which 75,200 people are aged
between 16-64 which accounts for 64% of the total population within Cheltenham* The average life
expectancy in Cheltenham is 80.5 years for men which is above the average life expectancy of 79.4
years in England and in Cheltenham the average life expectancy for women is 83.9 years which is just
above the average life expectancy of 83 years for a woman in England.
The chart below shows the breakdown between men and women which make up the of the population
of Cheltenham.

   * wwww.visitcheltenham.com Source Office for National Statistics 2016
   ** Source: National Index of deprivation 2015 NPSS
   * Source Office for National Statistics 2016
   * Housing Source: Housing Implementation Strategy: June 2017 Strategy: June 2017
   * Table 1: Total population (2016) Source: ONS Population Estimates

                                                                                                      4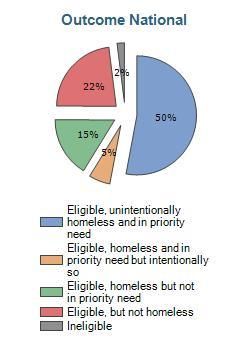
DRAFT HOUSING & HOMELESSNESS STRATEGY 2018–2023 EVIDENCE BASE

  Gloucestershire's Strategic Housing Market Assessment (SHMA)* estimates Cheltenham's need
  for new housing taking into account the projected household growth, affordability and housing
  need. Through this it estimates that over the next 20 years the number of people in Cheltenham
  aged over 65 is expected to grow significantly and estimates that the number of people aged
  over 85 is expected to increase by over 75% by 2031.

  The graph below* shows the anticipated % change in age group from 2013 to 2031. This shows
  that there will be reductions in people living in Cheltenham aged between 25-34 and 45—54
  however the majority of age cohorts are expected to grow this is particularly the case for
  people aged over 65 and the number of people aged 85 or over which is expected to increase by
  over 75% by 2031.

              Forecast population change by age group of household
                         reference person in Cheltenham
                                   2015 - 2031
    70.00%

    60.00%

    50.00%

    40.00%

    30.00%
                                                                   Forecast population change by age
                                                                   group of household reference
                                                                   person in Cheltenham 2015 - 2031
    20.00%

    10.00%

     0.00%
             15 - 24 25- 34 35-44 45-54 55-64 65-74 75-84 85 and
                                                           over
   -10.00%

   -20.00%

* Source: Joint Core Strategy– Gloucester, Cheltenham and Tewkesbury SHMA, Further Update
Affordable Housing September 2015 Neil McDonald

                                                                                                       5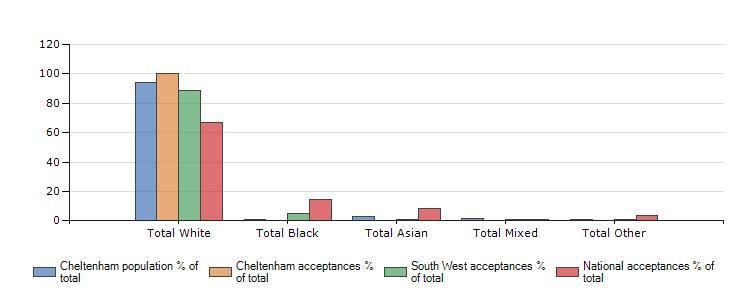
DRAFT HOUSING & HOMELESSNESS STRATEGY 2018–2023 EVIDENCE BASE

The Joint Core Strategy Housing Implementation Strategy 2017 estimates that Cheltenham’s
population is expected to rise to 119,480 by 2033 which is an average of 546 households a year.

Based on population and household changes for Cheltenham, projections suggest that by 2031 the
largest increase in households will be for one person households and couples without dependent
children.** This is illustrated further in the graphs below.

**Source: Neil McDonald with Christine Whitehead: The Objectively Assessed Housing Needs—Gloucestershire SHMA
Update impact of OAN—December 2014
*Source: ONS: What Homes Where 2013

                                                                                                                6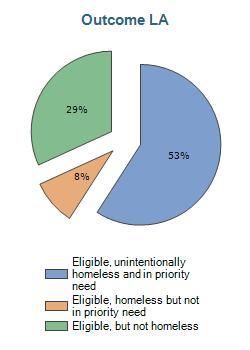
DRAFT HOUSING & HOMELESSNESS STRATEGY 2018–2023 EVIDENCE BASE

Ethnicity
The following charts show the mix of ethnicity in Cheltenham in comparison both with the South West
and also nationally.

                          Ethnicity of population within
                                   Cheltenham

                                     10%

                                                              White British
                                                              BME Categories
                                               90%

                          Ethnicity of population within
                                    South West

                                      7%

                                                             White British
                                                             BME Categories
                                           93%

                               Ethnicity of population within
                                           England

                                     18%

                                                                 White British

                                                     82%         BME Categories

  Source: NPSS: ONS Data 2011 www.ONS.gov.uk

                                                                                                      7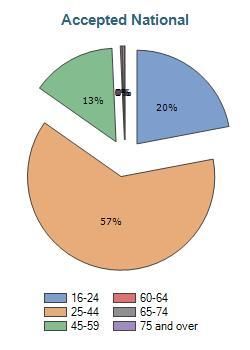
DRAFT HOUSING & HOMELESSNESS STRATEGY 2018–2023 EVIDENCE BASE

 3. Housing Supply

 The SHMA identifies housing requirements in Cheltenham up to 2031 and is used to inform the
 councils planning policies. For further information on supply requirements and affordable
 housing need projections for the period up to 2031. please refer to the latest SHMA update
 September 2015 at www.cheltenham.gov.uk

 The Joint Core Strategy has identified an annual housing requirement for Cheltenham of 546
 homes per year. At the time of writing 2,723 dwellings have planning permission from 2011 to
 2016, however the table below shows the disparity between permissions granted and the
 residential completions. (The values shown for permissions granted in previous years in the table
 change each year the AMR is published. This is because permissions granted in previous years
 are reviewed during the monitoring period to assess which have lapsed or been superseded.)
 Ongoing viability issues are reflected in the low numbers of affordable housing completions.

Year             Net dwellings          Gross              JCS housing         Affordable Housing
                 granted                Completions        requirement         Completions
                 permission

2012/13          307                    282                546                 101

2013/14          662                    430                546                 152

2014/15          876                    335                546                 24

2015/16          411                    422                546                 34

 Source: CBC 2016 Local development framework annual monitoring report

  Self Build Register
  Local authorities in England are required to research demand for self build plots in their area and
  from 1st April 2016 the Self-build and Custom Housebuilding Act 2015 made it compulsory for
  each local authority to maintain a list of people and groups interested in building their own homes.
  There are currently 30 entries on the Self Build register in Cheltenham (as of October 2017).

                                                                                                         8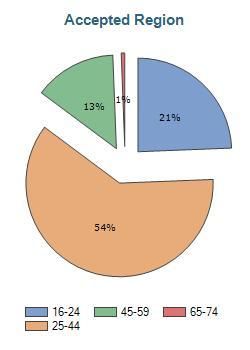
DRAFT HOUSING & HOMELESSNESS STRATEGY 2018–2023 EVIDENCE BASE

Right to Buy

Since 2011/12 there have been 117 properties sold in Cheltenham under the Right to Buy Scheme.
Please see the table and chart below for the breakdown of the number of social housing properties
sold under the Right to Buy Policy in Cheltenham per financial year. As of 2016 there were 6890
affordable homes in Cheltenham.

      2005/06                  23                2011/12                  6

      2006/07                  10                2012/13                  22

      2007/08                  7                 2013/14                  24

      2008/09                  2                 2014/15                  18

      2009/10                  5                 2015/16                  24

      2010/11                  5                 2016/17                  28

        30

        25

        20

        15

        10

         5

         0

                                                                                                    9
DRAFT HOUSING & HOMELESSNESS STRATEGY 2018–2023 EVIDENCE BASE

 Private Rented Accommodation
 According to the English Housing Survey 2015-16 the number of people renting privately in Eng-
 land has more than doubled since 2002 and more than 4.5 million people now live in the private
 rented sector in England

 A survey of 2,195 people conducted by Ipsos MORI for CIH found that people who were privately
 renting were significantly more concerned about their housing costs with 52% saying they fear
 they will not be able to afford the cost of their housing compared to 27% across the wider public.
 Meanwhile 56% of private renters reported a great deal or fair amount of stress being caused by
 housing costs compared to 33% of people across all types of housing and 44% of people privately
 renting think they might have to move from their area in the future because the cost of housing is
 too high, compared to just 23% across the wider public. Source: www.CIH.org

 The proportion of households living in the private rented sector who have dependent children has
 increased from 30% in 2005/06 to 36% in 2015/16 equating to about 1 million more households
 with dependent children in the private rented sector.
 This increase is particular apparent for lone parents with dependent children which increased from
 9 % in 2005/06 to 11% in 2015/16 and during this time there was a corresponding decrease in such
 households in the social rented sector.

                                                                                                      10
DRAFT HOUSING & HOMELESSNESS STRATEGY 2018–2023 EVIDENCE BASE
4. Empty Homes
In 2016 there were 395 vacant dwellings in Cheltenham which have been unoccupied for over 6
months. The council continues to identify vacant homes and to consider and implement activities
that will encourage members of the public and other relevant sources to report any properties that
are believed to be unoccupied and in 2016/17, 130 empty homes were brought back into use.
In 2012, Cabinet approved the use of CPOs to bring empty homes back into use and in 2016 / 17 1
house has been compulsorily purchased and 3 more were identified as requiring CPO action.
The graph below shows the number of vacant dwellings by local authority district between 2011–
2016 (long term empty homes are those dwellings which have been unoccupied and substantially
unfurnished for over 6 months). source: DCLG
800
700
600 Cheltenham
500 Cotswold
400 Forest of Dean
300 Gloucester
200 Stroud
100 Tewkesbury
0
2011 2012 2013 2014 2015 2016
Source: Number of vacant dwellings by local authority district 2011– 2016 DCLG
11DRAFT HOUSING & HOMELESSNESS STRATEGY 2018–2023 EVIDENCE BASE
5. Housing Costs and Affordability
The average house price in Cheltenham has risen from £125,000 in 2002 to £232,500 in 2016 (the
national average house price in England is currently £226,185 (July 2017) whilst the average gross
annual earnings in Cheltenham has risen from £22,571 in 2002 to £28,138 in 2016 (the national
average salary is £27,600—tax year 2016/17).
These figures show that property prices within the borough have far outstripped income levels
resulting in many people being priced out of owner occupation within the borough. This trend
does not seem to show any signs of stopping as house prices in Cheltenham rose by almost 5 times
the national average during 2017 which was the steepest rise of any major town or city in England.
Median House Price by local authority district, England and Wales, year ending q 2002 to year
ending q3- 2016.
Q3 - 2002 Q3 - 2016
England £106,000 £220,000
Cheltenham £125,000 £232,500
Cotswold £163,000 £325,000
Forest of Dean £98,000 £190,000
Gloucester £85,500 £175,000
Stroud £120,000 £230,000
Tewkesbury £117,000 £230,995
Median Gross Annual (where available) residence – based earning by county and region (2002-
2016)
2002 2016
England £20,739 £28,503
Gloucestershire £20,335 £27,818
Cheltenham £22,571 £28,138
Cotswold £20,373 £28,671
Forest of Dean £18,487 £28,375
Gloucester £18,870 £26,555
Stroud £19,944 £26,345
Tewkesbury £22,271 £29,450 *
**** Source: ONS Data for annual earnings not available. Annualised weekly earnings are used but these are not pro-
duced on an identical basis to annual earnings and are therefore not directly comparable.
Earnings are based on full-time residence based earnings Annual estimation of earnings is based on the tax year that
ended on 5th April in the reference year and relate to employees on adult rates of pay who have been in the same job
for more than a year.
12DRAFT HOUSING & HOMELESSNESS STRATEGY 2018–2023 EVIDENCE BASE
Mortgagee & Landlord Possessions
Nationally landlord possession claims, warrants and orders of possessions along with repossessions
by the county court bailiffs have decreased continuing the long-term downward trend since 2008
which co-coincides with lower interest rates, a proactive approach from lenders, and managing
consumers in financial difficulties along with other interventions. The highest rates of landlord
possessions actions are concentrated in London*
The table below shows the amount of annual mortgage and landlord claims and orders from 2014—
2016**
*Source: www.gov.uk / government / statistics (crown copyright—produced by ministry of justice)
**source: Mortgage and landlord possession statistics NPSS: ONS: Data 2011 www.ons.gov,uk
13DRAFT HOUSING & HOMELESSNESS STRATEGY 2018–2023 EVIDENCE BASE
The table below shows the annual household income required for Affordable Rented Tenancies within
the Cheltenham area without Housing Benefit.
1 Bedroom 2 Bedroom 3 Bedroom 4 Bed
Accommodation Accommodation Accommoda- Accommodation
tion
Weekly Rent £92.05 £122.36 £147.10 £187.14
Monthly Rent £398.88 £530.23 £637.56 £810.94
Annual Household In- £13,675 £18,179 £21,859 £27,804
come required with no
Housing Benefit
Source: ONS Annual Survey of Hours and Earnings (personal) - Gross for all employees 2016 projected)
The table below shows the range of household incomes required for Affordable Rented Tenancies
within the Cheltenham area, without Housing Benefit (assuming 35% of gross income is
affordable.). This is assessed as of May 2017 on a quartile basis of 80% market rents and gives an
indication of the average income that you need even when rents are 80 %of the average rent
based on spending 35 % of your household income on rent.
Annual Household 1 Bed Flat 2 Bed Flat 2 Bed House 3 Bed House 4 Bed House
Income Range
Lower Quartile £12,343— £13,029— £18,514— £20,571— £27,429—
£15,086 £19,063 £21,257 £25,371 £31,543
Third Quartile £15,086— £19,063— £21,257— £25,371— £31,543—
£17,143 £21,806 £23,314 £30,034 £38,400
The following table shows the Average RP General Needs Rents as a Proportion of Market Rents for
Cheltenham:
1 Bed Flat 2 Bed Flat 2 Bed 3 Bed 4 Bed House
House House
Mean Registered Provider £90.28 £106.36 £106.36 £119.61 £138.53
( General Needs) rent
Mean Social Rent as a % 87% 68% 69% 69% 60%
of Lowest Market rent
Mean social rent as a % of 60% 54% 49% 69% 54%
the average market rent
Source: ONS Annual Survey of Hours and Earnings (personal) - Gross for all employees 2016 (projected)
14DRAFT HOUSING & HOMELESSNESS STRATEGY 2018–2023 EVIDENCE BASE
Welfare Reform Changes
62,000 people are economically active in Cheltenham (aged 16-64) which equates to 83.7% of the
economically active population. The graph below shows the rate of Employment and
unemployment from April 2016—March 2017 *Source: ONS annual population survey—numbers
are for those aged 16 and over, % are for those aged 16-64.
90
80
70
60
50
40
30 Cheltenham (%)
20
10 Gloucestershire(%)
0
England (%)
Universal Credit
Universal Credit (UC) is a means-tested benefit (for people of working age) that combines the six
benefits listed below into a single monthly payment:
Job Seekers Allowance - Income based JSA
Employment and Support Allowance - Income-related
Income Support
Child Tax Credit
Working Tax Credit
Housing Benefit
Universal Credit for new claims was fully rolled out in Cheltenham from the 17th January 2018.
Registered providers, housing associations and Cheltenham Borough Homes have prepared fully for
this roll out to support tenants who will be affected and any potential impact will be carefully
monitored and ongoing support will be offered.
15DRAFT HOUSING & HOMELESSNESS STRATEGY 2018–2023 EVIDENCE BASE
There are 1403 working age and 402 pension age customers claiming HB under the LHA rules in
Cheltenham and there are 990 cases with rents higher than the local housing allowance figures.
The Benefit Cap
The Benefit Cap was introduced in 2013 and limits the total amount of benefit that most people aged 16
to 64 can receive. In Cheltenham the cap is as follows:
£384.62 per week (£20,000 a year) if you’re in a couple, whether your children live with you or
not, or if you’re single and your children live with you
£257.69 per week (£13,400 a year) if you’re single and you don’t have children, or your children
don’t live with you
As of March 2018 there are currently 52 tenants subject to the benefit cap in Cheltenham. This includes
15 council tenants, 16 housing association tenants and 21 tenants with private landlords.
Under Occupation Charge (Bedroom Tax)
The Under Occupation Charge (Bedroom Tax) was introduced in April 2013 and is a reduction in
Housing Benefit for people who live in a council or housing association home and have more bedrooms
that the rules allow and are of working age* The reduction rates are:
1 bedroom – reduction in housing benefit by 14% of the rent charge
2 or more bedrooms – reduction in housing benefit by 25% of the rent charge
As of February 2018 there were 407 tenants in Cheltenham subject to the bedroom tax and the
Discretionary Housing Payment has been paid to 47 of these tenants.
Shared Room Rate
The Shared room rate applies to single people under the age of 35 years old who are renting a property
from a private landlord where the maximum Housing Benefit entitlement is the shared room rate*. *
Source: www.shelter.org.uk. Exemptions do apply and this only applies to people living in private
rented accommodation.
As of February 2018 there were 98 single people on Housing Benefit in Cheltenham who live in private
rented self-contained flats that have had their rent restricted to the shared room rate and there are 3
rent restrictions for 18-21 year olds
16DRAFT HOUSING & HOMELESSNESS STRATEGY 2018–2023 EVIDENCE BASE
6. Housing Need
Data from the housing register through Homeseeker Plus shows the snapshot of need at a given
point in time and is useful for an understanding of future needs based on projected supply and
growth in household formation and determining need and demand for specific areas for new
development. For further information please refer to the SHMA
The graph below shows the number of people waiting for accommodation in Cheltenham by
bedroom need (March 2018) and shows that the majority of people on Homeseeker Plus are waiting
for one bedroom accommodation (54%).
There are 143 households who have been awarded additional priority through banding for medical
needs and of these, 130 households are in a silver band and 13 are in a gold band please see the
Homeseeker Plus policy for further information regarding banding criteria.
60%
50%
40%
30%
20%
10%
0%
1 Bedroom 2 Bedroom 3 Bedroom 4 Bedroom 5 Bedroom 6 Bedroom
Source: Homeseeker Plus: Households registered by bedroom need and banding as a percentage of all applicants
Physical Disabilities
There are 300 households who have been assessed as needing ground floor accommodation due to a
medical need and 24 households have stated that they are wheelchair users. We will regularly
monitor the number of households requiring ground floor or wheelchair accessible accommodation
when informing future lettings plans on new development and consider the housing needs of
wheelchair users.
17DRAFT HOUSING & HOMELESSNESS STRATEGY 2018–2023 EVIDENCE BASE
Mobility & Decent Homes
A countywide accreditation scheme (Fit to Rent) has been developed for private landlords in
Cheltenham and in 2016/17 the safety of 906 households were improved in the private rented
sector as a direct result of enforcement action undertaken by the councils housing enforcement
team.
Inspections of Houses of Multiple Occupancy are undertaken periodically prior to the expiry of
their current licence. In 2016/17 74 HMOs were inspected and licences renewed In 2016/17
130 empty homes were bought back into use.
Disabled Facilities Grants
DFGs provide households with a variety of aids and adaptations. In 2016/17 77 DFG applications
were approved by CBC with minor adaptations continuing to be delivered by CBH within CBC’s
housing stock and Gloucestershire Care Services NHS trust delivering all other minor (under
£1,000) adaptations to residents within the borough.
A relocation grant is used as an alternative to the use of DFGs where appropriate and each appli-
cation is considered on a case by case basis. Applicants are awarded grants to facilitate a move to
more suitable accommodation, rather than carrying out a DFG on their existing property.
Community Based Support
Gloucestershire County Council commissions community based support services which is provided
throughout the county and P3 currently deliver this service within Cheltenham. This service
supports people in their own homes throughout Gloucestershire providing support and guidance
on a wide range of issues this may include budgeting, Improving daily living skills, accessing special-
ist services, dealing with debt, mental health problems, education and employment, tackling
addiction issues etc. – this support is also available to people who may be homeless and need this
extra support.
Lifelines
In 2016/17 there were 238 new lifeline alarm installations plus a further 74 key safe installations
were carried out by the lifeline alarm service team.
The lifeline service now offers additional peripherals which can be added to the existing lifeline
unit. These include smoke detectors, carbon monoxide detectors, flood detectors, bogus caller
buttons and the Vibbys fall detector which automatically calls for help if someone falls. In addition
CBC can also offer a key safe installation service supporting an increase in vulnerable people living
alone with no close family support. The lifeline team also work in conjunction with the
Gloucestershire Telecare service, delivered by the Gloucestershire Care Services NHS Trust and
clients are referred onto this more specialist service where appropriate.
18DRAFT HOUSING & HOMELESSNESS STRATEGY 2018–2023 EVIDENCE BASE
Veterans
The graph below shows the number of households that are on Homeseeker plus who have stated
that they have served in the armed forces and what bedroom need they require. We will regularly
monitor the needs of veterans to inform future lettings plans.
1 Bed Need
2 Bed Need
3 Bed Need
4 Bed Need
Source: Homeseeker Plus: March 2018
Domestic Abuse
Gloucestershire County Council commission a range of options to support people experiencing
domestic abuse. In the last 12 months Gloucestershire Domestic Abuse Support Service (GDASS) have
supported 223 high risk victims form Cheltenham and 178 victims have received floating support.
Along with district colleagues Cheltenham Borough Council also commission a target hardening and
sanctuary service which provides enhanced security measures to someone’s home with the aim to
reducing homelessness by enabling (where safe & appropriate) victims to stay in their homes.
Measures can include replacing locks, installing window locks, alarms, providing fire safety equipment
etc. The table below shows the numbers of people in Cheltenham who have had target hardening
and Sanctuary works on their properties.
Year Target Hardening Sanctuary
2015 23 2
2016 38 3
2017 24 1
19DRAFT HOUSING & HOMELESSNESS STRATEGY 2018–2023 EVIDENCE BASE
Care Leavers
The following graph shows the age of the number of care leavers and children in care in
Cheltenham from 2014—2017
50
45
40
35
30
25 2014
20 2015
15
10 2016
5 2017
0
16 yrs 17 yrs Under 18-20 yrs 21 +
18yrs
Children In Care Care Leavers
The graph below shows the breakdown by accommodation type for children in care and care
leavers in Cheltenham from 2014—2017
60
50
40
30 2014
2015
20
2016
10
2017
0
Foster Other B&B Staying Other
Care Put
Children In Care Care Leavers
Source: ATM Wraparound Team 11+ Children In Care & Care Leavers: Gloucestershire County Council: February
2018
20DRAFT HOUSING & HOMELESSNESS STRATEGY 2018–2023 EVIDENCE BASE
Help to Buy South
Help to Buy South are a Help to Buy agent for the South West of England offering affordable
options to purchase / rent a home. At the time of writing there were 781 applicants registered with
Help to Buy South for properties in Cheltenham. The chart below shows the breakdown of the age
distribution of the applicants (Source: Help to Buy South: Application & Completion Statistics: Oct 2017)
18-29
30-39
40-49
50-59
60+
Help to Buy Shared Ownership
The Help to Buy Shared Ownership scheme allows someone to buy a share in a property between
25– 75% of the purchase property and then pay a low cost rent on the remaining share. This can
often be an affordable alternative to renting or buying on the open market (Source: Help to Buy South:
Application & Completion Statistics: Oct 2017)
The average household income of someone registered with Help to buy south in Cheltenham
Is £28,048,
The average household savings are £17,381 and the average age of applicant is 36
5 % of applicants are registered as having a disability
43 % of applicants currently privately rent.
21DRAFT HOUSING & HOMELESSNESS STRATEGY 2018–2023 EVIDENCE BASE
The below chart shows the current accommodation of applicants with Help to Buy South : Source: Help
to Buy South: Application & Completion Statistics: Oct 2017
Family & Friends
RSL Tenant
LA Tenant
MOD accom
Other
Home Owner
Private Tenant
Shared Owner
Tied
Help to Buy Equity Loan Completions
The Help to Buy Equity Loan Scheme is available to both first time buyers and also those who have
bought a property before. In order to qualify someone needs to buy a new build home and have a
minimum of a 5% deposit. The buyer then takes out a mortgage for 75% of the value and the re-
maining 20 % is funded by a repayable loan from the government*– for more information please
visit www.helptobuysouth.co.uk
The median purchase price is £216,995
The median loan amount is £43,000
81% of applicants are first time buyers
23% of applicants had an income of between £30,001—£40,000
134,558 properties were completed with the Equity Loan
* Source: Help to Buy South: Application & Completion Statistics: Oct 2017
22DRAFT HOUSING & HOMELESSNESS STRATEGY 2018–2023 EVIDENCE BASE
7. Homelessness
Part 7 of the 1996 Housing Act (as amended 2002) & the 2017 Homelessness Reduction Act out-
lines the statutory requirements regarding homelessness and places a duty on all housing authori-
ties in England to assist individuals and families who are homeless or threatened with homeless-
ness and to also ensure that advice and information about homelessness and preventing home-
lessness is available to everyone. (www.gov.uk).
The graphs below shows the most common reasons in England why someone approaches a local
authority as Homeless. The most common reason for someone approaching as homeless in England
is due to the end of an assured shorthold tenancy which has increased steadily since 2011.
35%
30%
25%
20% 2011/12
15%
2012/13
10%
5% 2013/14
0%
2014/15
2015/16
2016/17
Source: DCLG: Households accepted by local authorities as owed a main homelessness duty by reason for loss of
last settled home. England 2004 (Q1) TO 2017 (Q1)
23DRAFT HOUSING & HOMELESSNESS STRATEGY 2018–2023 EVIDENCE BASE
Homelessness acceptances—the national picture
The graph below shows the percentages of households accepted by local authorities in England
by priority need category . This shows that throughout England the most common reason that
people are accepted as being in priority need is due to having dependent children. In 2016/17 the
second highest reason for someone being accepted as having a priority need was due to a mental
health illness which has slightly increased from 2011/12 , followed by a physical disability which
has remained the same.
Homeless in an emergency
Other
Domestic Abuse
2016/17
Young Person
2015/16
Mental Illness 2014/15
2013/14
Physical Disability 2012/13
2011/12
Old age
Pregnancy
Dependent children
0% 10% 20% 30% 40% 50% 60% 70% 80%
Source: Households accepted by local authorities as owed a main homelessness duty by priority need category Eng-
land 2011 Q1—2017 Q1—Department for communities and local government.
24DRAFT HOUSING & HOMELESSNESS STRATEGY 2018–2023 EVIDENCE BASE
The graph below shows the number of homeless acceptances broken down by the age of the
main applicant. This shows that over half of all homeless acceptances in England are people aged
between 25-44 , followed by people aged 16-24. Those people aged 60 or above are the least
likely household group to be accepted by homeless.
70%
60%
2011/12
50%
2012/13
40%
2013/14
30%
2014/15
20% 2015/16
10% 2016/17
0%
16-24 25-44 45-59 60-64 65-74 75 +
Source: DCLG: Households accepted by local authority as owed a main homelessness duty by
age of applicant—England 2011 Q2 to 2017 Q1.–
25DRAFT HOUSING & HOMELESSNESS STRATEGY 2018–2023 EVIDENCE BASE
The graphs below show the age ranges of applicants found to be eligible, unintentionally home-
less and in priority need for Cheltenham as compared to the South West Region and also nation-
ally .This data provides a snapshot of information as of Q4 2016. Source: DCLG P1E data—Breakdown of
homelessness decision.
The graphs below details the breakdown of decisions made for decisions made on homeless
applications by Cheltenham Borough Council during Q4 2016 which provides a snapshot of
information to reflect this time period. Source: DCLG P1E data—Breakdown of Homelessness Decisions.
26DRAFT HOUSING & HOMELESSNESS STRATEGY 2018–2023 EVIDENCE BASE
The graph below shows the reasons why someone was accepted as homeless in Cheltenham. This
shows the main increase and reasons for someone being accepted as homeless being due to the end
of an assured shorthold tenancy.
35%
30%
25%
20%
15%
10%
5% 2016/17
0% 2011/12
Source: DCLG: Households accepted by CBC: Reasons for loss of last settled accommodation
27DRAFT HOUSING & HOMELESSNESS STRATEGY 2018–2023 EVIDENCE BASE
The graph below shows the increase in the number of homeless acceptances in Cheltenham since
2011/12 up to 2016/ 17. The he rise in homelessness acceptances reflects the steep rise in the
increase of people approaching as homeless following the end of an assured shorthold tenancy
and reflects the national trend of an increase in homeless acceptances.
The number of homeless acceptances in Cheltenham 2011/12 and 2016/17
160
140
120
100
80
60
40
20
0
2011/12 2016/17
Source: Total number of acceptances in Cheltenham 2011/12– 2016/17
Department for communities and local government
The table and graph below shows the homeless acceptances in Cheltenham broken down by
Ethnic Origin as compared to the South West and also nationally. This shows a snapshot in time
as of Q4 2016
28DRAFT HOUSING & HOMELESSNESS STRATEGY 2018–2023 EVIDENCE BASE
Homeless Preventions
The graph below shows the total number and breakdown of prevention cases in Cheltenham from
2011/12 to 2016 /17
400
Total prevention
350 cases
300
250
200 Able to remain in
150 exisiting home
100
50
Prevented by
0 assisting to obtain
alternative
accommodation
29DRAFT HOUSING & HOMELESSNESS STRATEGY 2018–2023 EVIDENCE BASE
The table below shows the total number of prevention cases in Cheltenham from 2011/12 to
2016 /17 and the breakdown of this.
350
Prevented to able to
300 remain in existing
250 home
200
Prevented by
150 assisting to obtain
100 alternative
accommodation
50
Cases successful in
0 relieving
homelessness
Source: Total Prevention Cases—Cheltenham Department of communities and Local Government
30DRAFT HOUSING & HOMELESSNESS STRATEGY 2018–2023 EVIDENCE BASE
Temporary Accommodation
Cheltenham Borough Council have not placed any families with children in Bed and Breakfast
accommodation for more than 6 weeks and where possible try and place homeless families
in temporary furnished accommodation.
The following graph shows the outcomes of people leaving temporary accommodation in
England from 2011/12 to 2016/17
Outcomes of people leaving temporary accommodation in
2016/17
Accepted LA/HA accom
Refused LA/HA accom
Accepted assured tenancy with a RP
Accepted qualifying offer of AST
Accepted offer of settled AST in PRS
Refused offer
Ceased to be eligible
Became intentionally homeless
from TA
Voluntarily ceased to occupy
Source: Street Counts and Estimates of rough sleeping in England, Autumn 2010-2016Department for communities
and Local Government.
31DRAFT HOUSING & HOMELESSNESS STRATEGY 2018–2023 EVIDENCE BASE
Rough Sleeping
National rough sleeping statistics provide information on the single night snapshot of rough
sleeping that is taken annually in England using street counts and intelligence driven
estimates. *
For the purposes of rough sleeping counts and estimates a rough sleeper is defined as:
people sleeping, about to bed down (sitting on/in or standing next to their bedding) or
actually bedded down in the open air (such as on the streets, in tents, doorways, parks,
bus shelters or encampments)
people in buildings or other places not designed for habitation (such as stairwells, barns,
sheds, car parks, cars, derelict boats, stations, or ‘bashes’).
The definition does not include people in hostels or shelters, people in campsites or other
sites used for recreational purposes or organised protest, squatters or
travellers.*
Many people who sleep rough will have a number of complex support issues,
Gloucestershire County Council commission Accommodation Based Support Services of
which a number of units are based in Cheltenham. This provides support for people who
have complex needs and require a high level of support.
Since 2010 the numbers of people rough sleeping in England has increased by 132% rising
from 1,768 to 4,134
In Cheltenham this number has risen from 1 rough sleeper identified in 2010 to 11 people
rough sleeping identified in 2016.
Assertive Outreach Service
Cheltenham Borough Council along with the other 5 districts in Gloucestershire, Gloucestershire
County Council, The Police and Crime Commissioner and the Clinical Commissioning Group
commission an assertive outreach service which is currently provided by p3.
This service carries out the Severe Weather Emergency Protocol and works with some of the
county’s most vulnerable individuals, and will respond to Streetlink alerts and also actively search
for people who are new to sleeping on the streets or who are longer term rough sleepers with
complex needs. Aiming to support people to access appropriate accommodation, support, and
healthcare, and to begin their journey into longer term sustained housing.
*Source: Street Counts and Estimates of rough sleeping in England, Autumn 2010-2016Department for communities
and Local Government
32DRAFT HOUSING & HOMELESSNESS STRATEGY 2018–2023 EVIDENCE BASE
The graph and table below shows the number of people rough sleeping in Gloucestershire
Source: Street Counts and Estimates of rough sleeping in England, Autumn 2010-2016 Department for communities
and Local Government
Rough Sleeper Count Data
2010 2011 2012 2013 2014 2015 2016 2017
England 1,768 2,181 2,309 2,414 2,744 3,569 4,134 4,751
London 415 446 557 543 742 940 964 1,137
Bristol 8 8 9 41 41 97 74 86
Cheltenham 1 3 6 3 0 1 11 9
Gloucester 14 8 11 11 17 13 23 15
Forest Of Dean 2 2 1 0 0 2 0 1
Cotswold 7 5 4 2 4 4 6 1
Stroud 4 5 5 5 1 1 2 2
Tewkesbury 2 2 2 1 4 0 0 2
25
20
Cheltenham
Gloucester
15
Forest Of Dean
10 Cotswold
Stroud
5
Tewkesbury
0
20102011201220132014201520162017
33You can also read