Re-pressurized magma at Mt. Etna, Italy, may feed eruptions for years
←
→
Page content transcription
If your browser does not render page correctly, please read the page content below
ARTICLE
                  https://doi.org/10.1038/s43247-021-00282-9                 OPEN

                  Re-pressurized magma at Mt. Etna, Italy,
                  may feed eruptions for years
                  Pasquale De Gori            1 ✉,   Elisabetta Giampiccolo2, Ornella Cocina2, Stefano Branca2, Carlo Doglioni1 &
                  Claudio Chiarabba             1

                  Identifying and monitoring the presence of pressurized magma beneath volcanoes allows for
                  improved understanding of internal dynamics and prediction of eruptions. Here we show with
                  time-repeated tomography clear evidence that fresh melts accumulate since 2019 in three
                  reservoirs located at different depths in the central feeding system. In these three volumes,
1234567890():,;

                  we observe a significant reduction of seismic wave velocity, an anomaly that has endured for
                  almost two years. Reservoir re-pressurization induced seismicity clusters around the pres-
                  surized volumes within high fluid pressure compartments. This indicated a sharp change in
                  volcano behavior, with re-pressurization of the central system replacing two-decade-long,
                  flank collapse-dominated dynamics. The volume where the velocities are altered is remark-
                  able in size, suggesting the injection of new melt, and that erupted lava represents only a
                  small percentage. Our findings suggest that ongoing volcanic recrudescence can persist.

                  1 Istituto Nazionale di Geofisica e Vulcanologia, Roma, Italy. 2 Istituto Nazionale di Geofisica e Vulcanologia, Osservatorio Etneo, Catania, Italy.
                  ✉email: pasquale.degori@ingv.it

                  COMMUNICATIONS EARTH & ENVIRONMENT | (2021)2:216 | https://doi.org/10.1038/s43247-021-00282-9 | www.nature.com/commsenv                              1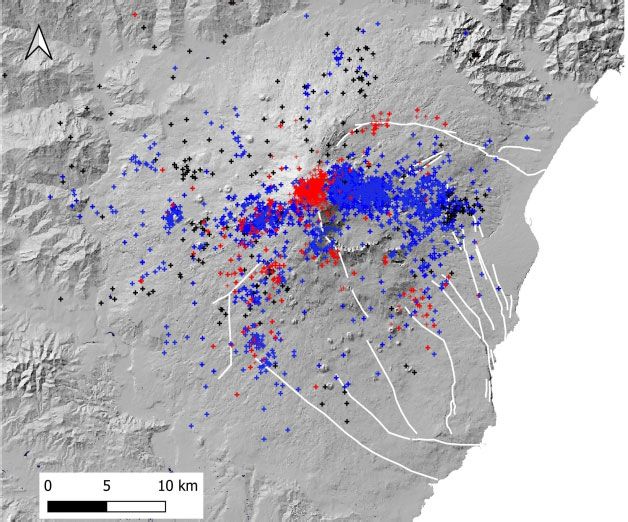
ARTICLE                                             COMMUNICATIONS EARTH & ENVIRONMENT | https://doi.org/10.1038/s43247-021-00282-9

D
         eciphering how volcanoes work is one of the most chal-
         lenging issues of Earth physics and it is a prerequisite for
         hazard assessment. Many volcanoes erupt abruptly while
others only after some period of unrest, but the unrest duration
and the entity of precursory signals are still poorly understood.
One major challenge is to forecast how long an eruption will last,
how big will be its size, i.e., what will be the volume of lava that is
going to erupt. Answering such challenging questions requires a
deep knowledge of the magmatic system, good examples and
multidisciplinary data. For many decades, our constant focus on
Mt. Etna yielded great steps in the understanding of volcanic
processes, taking advantage of the intense and disparate activity
well monitored by modern multidisciplinary systems1,2. The
volcano is located at the leading edge of the accretionary prism
along the Apennines subduction system in southern Italy, in
particular above the tear between the SE-ward faster retreating
slab of the Ionian oceanic lithosphere relative to the continental
Sicily3. Its hybrid origin emphasizes a variety of processes and
complex dynamics raised by the contamination of a pristine low
viscosity magma sourced by the asthenosphere above a vertical
slab window3–5.
   Although the volcano is continuously active, episodes of
inflation and increase of eruptions are documented in recent and
historic times6,7. Since December 2020, volcanic activity has
resumed sharply with some paroxysmal events, after more than 1
year of long steady activity starting in September 2019. The
present violent eruptive episode with spectacular lava fountains
started in mid-February 2021. This sharp reactivation, still
ongoing at the time we are writing, follows an overall inflation
trend observed by GNSS data and a general increase in seismicity
since summer 2020, suggesting a resumption of pressurization in
the magmatic system8. Petrological analysis shows that the che-
mical composition of the magma that erupted from the Southeast
Crater from December 2020 to February 2021 episodes is one of
the most “primitive” and rich in gas of the last 20 years9.
   The seismicity rate increase was pronounced, with shallow
(z ≤ 3 km) clusters in the central area and inter-medial (3 km <
z ≤ 12 km) and deep clusters (z ≥ 12 km) along the western and
                                                                           Fig. 1 Mt. Etna Seismicity and tectonic lineaments. (a) Map of Mt Etna
north-eastern flanks (Fig. 1). The occurrence of peripheral deep
                                                                           volcano and main faults and tectonic lineaments (white lines). Seismicity
earthquakes is thought to be a marker of the volcano recharging,
                                                                           in the period January 2019–February 2021 is shown, with crosses color-
heralding eruptive phenomena10–13. It is then not surprising that
                                                                           coded for hypocentral depth (red = z ≤ 3 km, blue = 3 < z ≤ 12 km,
in a short time, after an Ml 3.1 earthquake on February 11 2021,
                                                                           black = z ≥ 12 km, b.s.l.). (b) 3D view of the seismicity distribution, note
beneath the summit area, a series of paroxysmal events and lava
                                                                           the central shallow and the peripheral deep seismicity.
fountains started at the Southeast Crater. Since mid-February
2021 to April 2021, the number of strong lava fountain episodes
constantly increased, accompanied by a sharp increment in vol-             deformation, migration of fluids, and melts accumulation under
canic tremor amplitude and infrasonic activity, but with scarce            volcanoes14,17,19. Limits in the application of time-repeated
earthquakes and moderate tiltmetric variations9. Activity in this          tomography derives from differences in ray sampling between
period is referred as the first 2021 lava fountain cycle.                   distinct time periods, a consequence of the not optimal dis-
   In this study, we get for the first time near real-time imaging of       tribution of sources (local earthquakes) and receivers. Peculiar
the magmatic system with time-lapse local earthquake tomo-                 care in data selection and inversion is usually taken to ensure that
graphy. We compute changes in P- and S-wave velocity between               the time-resolution of images is similar among periods, avoiding
the present and older periods to trace and locate the new fresh            that spatial anomalies could map into spurious time
accumulation of melts within the crustal reservoirs. The observed          anomalies15,19.
transient anomalies help in understanding the ongoing dynamics                Here, we get inference on the present setting of the Mt. Etna
and quantifying the percentage of melt recently added to the               magmatic system from differences in body wave velocity between
system, useful to forecast the evolution of the unrest.                    the static 3D image of the volcano20 and data in the present
                                                                           period (i.e., December 2019–February 2021). To enforce the
                                                                           modelling, we use static background models as the starting
Results                                                                    models for the inversion.
In time-lapse tomography, 4D velocity changes (in space and                   The distribution of P- and S-wave residuals for earthquakes
time) are computed by differences between 3D images obtained               located with the static 3D model gives a rough, blind, indication
by data that span different time intervals14–17. Applications in           that data possibly contain significant velocity changes in time
many geo-sites and different tectonic processes give strength to           (Fig. 2). The asymmetric trend of residuals toward positive values
this pseudo-4D structural imaging15,18,19. The variations of seis-         indicates that the data need a slower model than the static 3D
mic properties are related to changes in the stress and                    model. Selecting peculiar events and stations, we observe that ray

2           COMMUNICATIONS EARTH & ENVIRONMENT | (2021)2:216 | https://doi.org/10.1038/s43247-021-00282-9 | www.nature.com/commsenv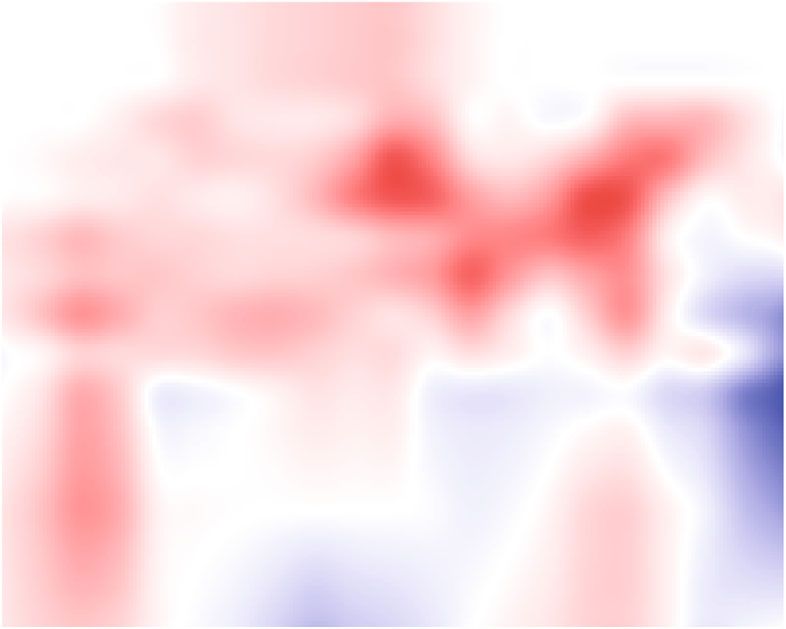
COMMUNICATIONS EARTH & ENVIRONMENT | https://doi.org/10.1038/s43247-021-00282-9 ARTICLE
The most salient feature of the Mt. Etna deep structure is a
high-velocity body interpreted as a huge magma-mush formed
during volcanic history10,12,14,20–24. This body, extending from 3
to 15 km depth, is the main feature of any deep images of the
volcano, as well as for this model. We catched several velocity
changes from the background model (Fig. 3). Here we present
and discuss the most intriguing features, relevant for the defini-
tion of the magmatic system:
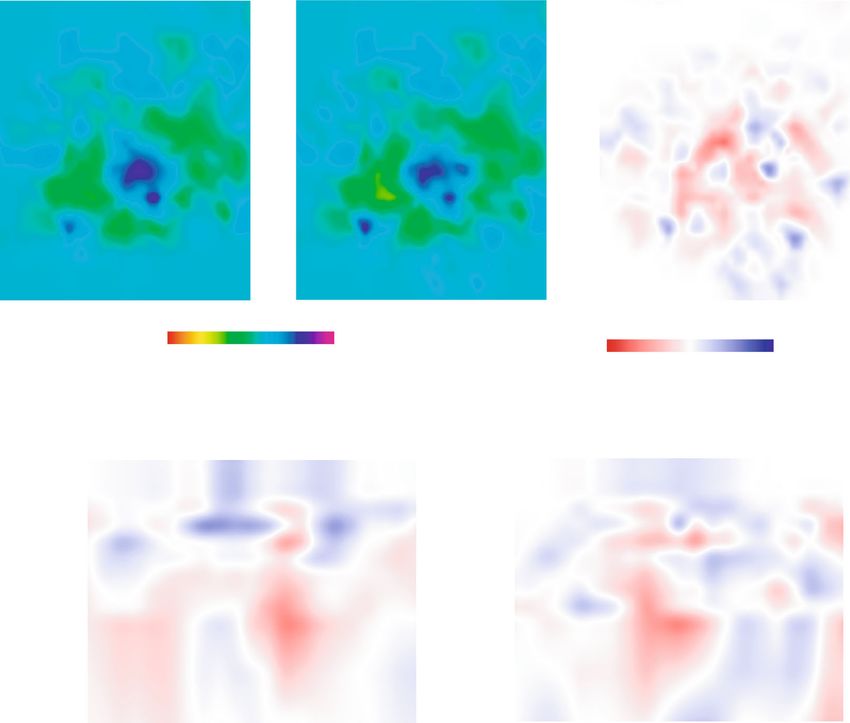
A broad volume with a strong Vp reduction, centred at 6 km
depth (b.s.l.) and extending between 3 and 9 km depth is found
beneath the central area (R-3). The Vp anomaly is well resolved,
but the Vs resolution in the same region is very poor (Supple-
mentary Fig. 2), although the potential ray coverage should be
adequate based on earthquakes and station distribution. We
explain this poor resolution as due to the difficulty in reading the
phase onset on highly attenuated S-waves that pass through the
anomalous body (see Fig. 4). These are indirect evidence for melt
accumulation within the central feeding system. Seismicity is
mostly located around the low Vp deep volume (Fig. 3).
Two small, central volumes with clear Vp reduction are centred
beneath the summit craters at −1 (R-2) and 1 (R-1) km depth
(b.s.l.). These anomalies are resolved and reasonably indicate
fresh melt addition in the shallow reservoirs. A clear on/off of
shallow seismicity at −1 km depth around R-2 is observed
(Fig. 2d).
The three anomalous Vp volumes are different in size but they
are all well resolved (according to the Resolution matrix analysis,
see Data and Method section). R-3 is deep and elongated sug-
gesting that the principal magma accumulation is vertically dis-
tributed at the edge of the high-velocity body. The volume of R-2
and R-1 is smaller, but they emerge as a permanent residence for
magma feeding lava fountains and explosive activity of the
summit craters. To verify if eventual bias in the velocity change is
introduced by an uneven distribution of events, we have inverted
the dataset following a conservative approach designed to mini-
mize such changes, in which the static 3D model is computed
with the entire dataset to absorb as much heterogeneities as
possible25. We observe that the transient low-velocity anomalies
are similar to those computed with the first approach (Fig. 5).
To further assess the reliability of velocity changes, we have
Fig. 2 Time evolution of seismicity and velocity residuals since January computed a synthetic test where a transient low Vp anomaly is
2019. P-wave (a) and S-wave (b) residuals after location in the 3D model introduced only in the last period. The recovery of the synthetic
vs time. The mean residuals of each event, normalized by the traveltime to feature is quite reasonable, although the procedure partially
account for different ray path-lengths, are smoothed by a moving average under-sizes the amplitude of the recovered anomaly (Fig. 6).
of 200 points (events) shifted forward by 100 points. The average values
(red points) are associated to the right end of the window, determining an
apparent visual shift of the mobile mean. Red vertical bars are the standard Discussion
deviation of the mean. Green lines mark a 3 months period. (c) Seismicity Forecasting the evolution of volcanic activity is very compelling
rate and Energy vs time, (d) hypocentral depth vs time. Note the large P and controversial, even for well-monitored volcanoes like Mt.
and S positive residuals after mid-September 2019 highlighting a change in Etna. Short time scenarios are always based on time series of
the volcano structure (red arrow). This change occurred after a deep geochemical and geophysical data and changes in monitored
seismicity cluster and in concomitance with a sharp increase of seismicity. parameters, but the information on how much melt is accumu-
Note the further and more recent increase in seismicity, both deep and lated and at which depth it resides is often unknown or not
shallow clusters, started in December 2020. considered. Earthquakes and low-frequency signals as volcanic
tremor indirectly trace the ascent of magma within the crust and
in local conduits close to the surface26–29, but estimates on the
volumes involved are lacking.
paths that travel beneath the central part of the volcano structure Decades of studies revealed a central high-velocity magma
accumulate positive residuals with respect to rays that travel mush beneath Mt. Etna, formed by long-term activity21,30,31. The
outside the volcano (Supplementary Fig. 1). The tomography mush incorporates a gabbroic intrusive counterpart of non-
successfully catches this pattern (see Method and data for details). erupted lavas32 and the pervasion of deep fluids in its interior is
A clear drop in residuals is observed before the sharp increase, somehow connected with the re-feeding of shallow reservoirs and
suggesting that rays travel through faster anomalies. A similar flank instability2,20,21,33–36. During the recent life of the volcano,
drop is also observed at the end of the period, concomitant with a intense central activity alternates with episodes dominated by
renewal of deep seismicity, with rays that sample deep fast shallow intrusions and increasing of the ESE sliding of the eastern
anomalies. flank2,20,37–40. The strong explosive activity of the summit craters
COMMUNICATIONS EARTH & ENVIRONMENT | (2021)2:216 | https://doi.org/10.1038/s43247-021-00282-9 | www.nature.com/commsenv 3
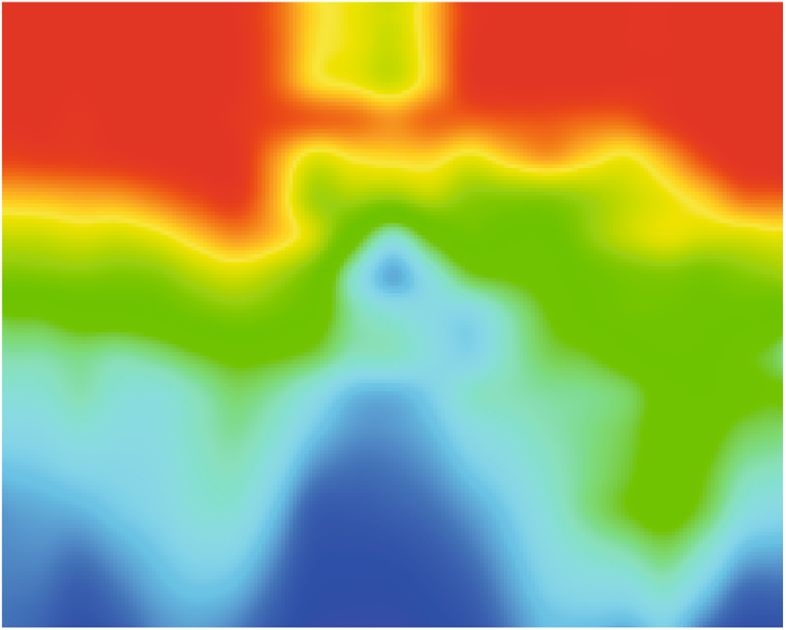
ARTICLE                                                COMMUNICATIONS EARTH & ENVIRONMENT | https://doi.org/10.1038/s43247-021-00282-9

Fig. 3 Time-lapse tomography at Mt. Etna. (a) Vp at 6 km depth b.s.l. in the period before 2019 (background model) and in the period 2019–2021 (new
model). Vp changes between the two models related to the variation of temperature and stress beneath the volcano. Seismicity occurred in the
three distinct periods is shown (gray = pre 2019, yellow 2019–2020, purple 2020–2021 most recent). (b) S-N and W-E vertical sections of Vp changes
crossing the volcano. Seismicity is represented with the same colors of (a). Purple lines = limit of the resolved volume. Green diamonds on the Vp changes
map are the summit craters.

of early 2000 was the first successfully observed and well docu-               volcano. The main addition is in a deep reservoir (R-3), broadly
mented by high-quality data from INGV-OE monitoring systems.                  elongated between 4 and 9 km depth at the northern edge of the
These paroxysmal episodes followed a period of pressurization of              high-velocity magma mush (Fig. 7). This is the principal volume
the crustal reservoir, inferred by seismicity distribution and local          of storage where primitive melts ascending directly from the
stress10,13,41,42. Also, in that case, we missed indications on melt          mantle source contaminate shallow residing magma. R-3 is
volumes that were large for having fed a prolonged activity. For              connected with two shallower and smaller reservoirs (R-2 and R-
all the following intrusive episodes, the identification of fresh              1) that directly feed the summit craters activity.
melts in the shallow reservoir remained eluded by geophysics.                    Based on the distribution of velocity residuals vs time (Fig. 2a,
Velocity changes from time-lapse tomography defined only local                 b), we hypothesize that this new accumulation started in mid-
variation in volumes around shallow intruding dykes12,14,20,23.               September 2019, in concomitance with the resumption of the
   After a period without important paroxysms, the sharp                      summit activity after the end of the 2018 flank eruptions, with a
resumption of volcanic activity in mid-February 2021 represents               recent acceleration in December 2020. The portion of melt added
the first opportunity to investigate the broad dynamics of the                 in 2 years is indeed significant to be traceable with local earth-
volcano. The reappraisal follows an increase of seismic release               quake tomography, whose resolution is in the order of kilometres.
started in December 2020 where elongated deep (z > 12 km) and                 Although the size of the transient anomalies is broadened by the
shallow (z < 3 km) clusters occurred in concomitance.                         alteration of temperature and pressure due to the injection, we
   The need for a quantitative estimate of magma volumes                      can infer that fresh melts intrudes and pervades wide volumes of
potentially in play can be answered by time-lapse imaging of the              crustal reservoirs. Melt percentage can be extrapolated from
volcano. The abundant and diffuse seismicity is a good pre-                   velocity perturbations, following the approach used for the
requisite for its feasibility. We observe clear transient velocity            Kilauea43. By considering P-wave velocity differences and
anomalies associable with melt accumulation within three reser-               assuming a simplified composition compatible with the petrolo-
voirs located at different depths beneath the central portion of the          gical characteristics of products and a mid-crustal depth (6–9 km

4            COMMUNICATIONS EARTH & ENVIRONMENT | (2021)2:216 | https://doi.org/10.1038/s43247-021-00282-9 | www.nature.com/commsenv
COMMUNICATIONS EARTH & ENVIRONMENT | https://doi.org/10.1038/s43247-021-00282-9                                                            ARTICLE

Fig. 4 Attenuation of S-wave traveling through the central low-velocity anomaly. We plot seismic waveforms for a local earthquake (04 GEN 2021, hh
08:24 (UTC), lat = 37.74, lon = 14.96, depth = 11.10 km, Ml = 1.80), yellow star in (a) as recorded at some stations (red triangles) shown in map (a). In (c)
red and green bars on waveforms, mark the arrival times of P and S waves, respectively. The signal at station EPLC, located on top of Mt. Etna, travels
through the anomalous body (seismic ray within the tomographic model in (b) and does not show clear S-waves (c), opposite to the other stations, located
also at 30 km distance (AIO). The poor resolution of the S-wave model (purple line in b) depends on this severe attenuation of signals.

COMMUNICATIONS EARTH & ENVIRONMENT | (2021)2:216 | https://doi.org/10.1038/s43247-021-00282-9 | www.nature.com/commsenv                                    5
ARTICLE                                                COMMUNICATIONS EARTH & ENVIRONMENT | https://doi.org/10.1038/s43247-021-00282-9

Fig. 5 Time-lapse tomography at Mt. Etna. S-N and W-E vertical sections of Vp changes crossing the volcano similar to those of (Fig. 3b) but done
following the Foulger approach25.

Fig. 6 Reliability of the transient Vp change at Mt. Etna. Synthetic test: an artificial low-velocity anomaly (a) is introduced in the 2019–2021 sub-period
and the inversion procedure is repeated as in the real inversion, with similar hypocentral and velocity parameters and damping. Note the good recovery (b)
of the low-velocity anomaly, although with a slightly minor amplitude.

6            COMMUNICATIONS EARTH & ENVIRONMENT | (2021)2:216 | https://doi.org/10.1038/s43247-021-00282-9 | www.nature.com/commsenv
COMMUNICATIONS EARTH & ENVIRONMENT | https://doi.org/10.1038/s43247-021-00282-9                                                                     ARTICLE

Fig. 7 Synthesis of the Mt. Etna plumbing system with Vp velocity changes. E-W vertical sections of Vp (left) and Vp/Vs (right) across the volcano,
showing the past two years of seismicity. Purple lines indicate the extent of the volume with the Vp transient reduction. Note the poor low resolution of the
Vp/Vs model in this central area due to the lack of S-waves passing through the melt body.

b.s.l.), we could expect that the −6% of Vp anomaly is compatible                  permanent network deployed in the Mt. Etna area, equipped with broadband
with a melt fraction of about 4% (i.e., about 1.4% for 1% of melt,                 (0.01–40 s) three-component seismometers. About 80% of the events have a
                                                                                   magnitude >1.0 and the maximum magnitude is Ml = 4.1.
see44). This melt fraction has been added during the past 2 years                     From the whole dataset, we extracted 3140 earthquakes having at least 6 P and
to the central reservoir (R-3), reasonably after the start of pres-                2 S arrival times (with an average of 15 arrival times), RMS
ARTICLE COMMUNICATIONS EARTH & ENVIRONMENT | https://doi.org/10.1038/s43247-021-00282-9
Data availability 21. Chiarabba, C., De Gori, P. & Patanè, D. The Mt. Etna plumbing system: the
Waveform data can be retrieved on the EIDA seismic database, http://eida.ingv.it/it/ contribution of seismic tomography. Mt. Etna: Volcano Labor. Geophys.
getdata. Earthquakes data and velocity models are accessible at ftp.ingv.it/pub/ Monogr. Ser 143, 191–204 (2004).
pasquale.degori/COMMSENV-21-0279B 22. Aloisi, M., Cocina, O., Neri, G., Orecchio, B. & Privitera, E.
Seismictomography of the crust underneath the Etna volcano, Sicily. Phys.
Earth Planet. Inter. 134, 139–155 (2002).
Code availability 23. Patanè, D. et al. Tomographic images and 3D earthquake locations of the
The seismic tomography software code is free and a version can be downloaded at http://
seismic swarm preceding the 2001 Mt. Etna eruption: evidence for a dyke
faldersons.net/Software/Simulps
intrusion. Geophys. Res. Lett. 29, 1497 (2002).
24. Díaz-Moreno, A. et al. New Insights on Mt. Etna’s Crust and Relationship
Received: 30 April 2021; Accepted: 14 September 2021; with the Regional Tectonic Framework from Joint Active and Passive P-Wave
Seismic Tomography. Surv. Geophys. 39, 57 (2018).
25. Foulger, G. R. et al. Three-dimensional crustal structure of Long Valley
caldera, California, and evidence for the migration of CO2 under Mammoth
Mountain. J. Geophys. Res. 108, 2147 (2003).
26. Corsaro, R. A., Rotolo, S. G., Cocina, O. & Tumbarello, G. Cognate xenoliths
References in Mt. Etna lavas: witnesses of the high-velocity body beneath the volcano.
1. Patanè, D., Cocina, O., Falsaperla, S., Privitera, E. & Spampinato, S. Mt. Etna Bull. Volcanol. 76, 772 (2014).
volcano: a seismological framework. Mt. Etna Volcano, Geophys. Monogr. Ser,. 27. Sgattoni, G. et al. The 2011 unrest at Katla volcano: characterization and
143, 147–165 (2004). interpretation of the tremor sources. J. Volcanol. Geotherm. Res. 338, 63–78
2. Pezzo, G. et al. Flank sliding: a valve and a sentinel for paroxysmal (2017).
eruptions and magma ascent at Mount Etna, Italy. Geology 48, 1077–1082 28. Roman, D. C. & Cashman, K. V. Top–Down Precursory Volcanic Seismicity:
(2020). implications for ‘Stealth’ Magma Ascent and Long-Term Eruption
3. Branca, S., Coltelli, M., Groppelli, G. & Lentini, F. Geological map of Etna Forecasting. Front. Earth Sci. 6, 124 (2018).
volcano, 1: 50,000 scale. Italian J. Geosci. 130, 265–291 (2011). 29. Woods, J. et al. Long-period seismicity reveals magma pathways above a
4. Doglioni, C., Innocenti, F. & Mariotti, S. Why Mt. Etna? Terra Nova 13, 25–31 laterally propagating dyke during the 2014–15 Bárðarbunga rifting event,
(2001). Iceland. Earth Planetary Sci. Letters 490, 216–229 (2018).
5. Barreca, G. et al. Slab detachment, mantle flow, and crustal collision in eastern 30. Patanè, D. et al. Interplay between Tectonics and Mount Etna’s Volcanism:
Sicily (southern Italy): Implications on Mount Etna volcanism. Tectonics 39, insights into the Geometry of the Plumbing System, (ed. Uri Schattner), New
e2020TC006188 (2020). Frontiers in Tectonic Research-At the Midst of Plate Convergence, 73-104,
6. Allard, P., Behncke, B., D’Amico, S., Neri, M. & Gambino, S. Mount Etna (2011). ISBN 978-953-307-594-5
1993–2005: anatomy of an evolving eruptive cycle. Earth Sci. Rev. 78, 85–114 31. Kahl, M., Chakraborty, S., Pompilio, M. & Costa, F. Constraints on the nature
(2006). and evolution of the magma plumbing system of Mt. Etna Volcano
7. Bonaccorso, A. & Aloisi, M. Tracking Magma Storage: New Perspectives From (1991–2008) from a combined thermodynamic and kinetic modelling of the
40 Years (1980–2020) of Ground Deformation Source Modeling on Etna compositional record of minerals. J. Petrol. 56, 2025–2068 (2015).
Volcano. Front. Earth Sci. 9, 171 (2021). 32. Corsaro, R. A., Rotolo, S. G., Cocina, O. & Tumbarello, G. Cognate xenoliths
8. INGV-OE, Bollettino settimanale sul monitoraggio vulcanico, geochimico e in Mt. Etna lavas: witnesses of the high velocity body beneath the volcano.
sismico del vulcano Etna del 16/06/2020. (2020) https://www.ct.ingv.it/ Bull. Volcanol. 76, 772 (2014).
index.php/monitoraggio-e-sorveglianza/prodotti-del-monitoraggio/bollettini- 33. Bonaccorso, A. et al. Dynamics of a lava fountain revealed by geophysical,
settimanali-multidisciplinari geochemical and thermal satellite measurements: the case of the 10 April 2011
9. INGV-OE Bollettino settimanale sul monitoraggio vulcanico, geochimico e Mt Etna eruption. Geophys. Res. Lett. (2011). https://doi.org/10.1029/
sismico del vulcano Etna del 23/02/2021. (2021) https://www.ct.ingv.it/ 2011GL049637
index.php/monitoraggio-e-sorveglianza/prodotti-del-monitoraggio/bollettini- 34. Azzaro, R., D’Amico, S., Peruzza, L. & Tuvè, T. Probabilistic seismic hazard at
settimanali-multidisciplinari. Mt. Etna (Italy): the contribution of local fault activity in mid-term
10. Chiarabba, C., Amato, A., Boschi, E. & Barberi, F. Recent seismicity and assessment. J. Volcanol. Geoth. Res. 251, 158–169 (2013).
tomographic modeling of the Mount Etna plumbing system. J. Geophys. Res. 35. Bonaccorso, A., Currenti, G. & Del Negro, C. Interaction of volcano-tectonic
105, 10923–10938 (2000). fault with magma storage, intrusion and flank instability: a thirty years study
11. Bonaccorso, A., Bonforte, A., Guglielmino, F., Palano, M. & Puglisi, G. at Mt. Etna volcano. J. Volcanol. Geotherm. Res. 251, 98–111 (2013).
Composite ground deformation pattern forerunning the 2004–2005 36. Murray, J. B., Van Wyk de Vries, B., Pitty, A., Sargent, P. & Wooller, L.
Mount Etna eruption. J. Geophys. Res. (2006). https://doi.org/10.1029/ Gravitational sliding of the Mt. Etna massif along a sloping basement. Bull.
2005JB004206. Volcanol. 80, 40 (2018).
12. Alparone, S. et al. Intrusive mechanism of the 2008–2009 Mt. Etna eruption: 37. Solaro, G. et al. Anatomy of an unstable volcano from InSAR: multiple
constraints by tomographic images and stress tensor analysis. J. Volcanol. processes affecting flank instability at Mt. Etna, 1994–2008. J. Geophys. Res.
Geotherm. Res. 229–230, 50–63 (2012). 115, B10405 (2010).
13. Sicali, S., Barberi, G., Cocina, O., Musumeci, C. & Patanè, D. Volcanic unrest 38. Bonforte, A., Gambino, S. & Neri, M. Intrusion of eccentric dikes: the case of
leading to the July-August 2001 lateral eruption at Mt. Etna: Seismological the 2001 eruption and its role in the dynamics of Mt. Etna volcano.
constraints. J. Volcanol. Geotherm. Res. 304, 11–23 (2015). Tectonophysics 471, 78–86 (2009).
14. Patanè, D., Barberi, G., Cocina, O., De Gori, P. & Chiarabba, C. Time-resolved 39. Bonforte, A. & Guglielmino, F. Very shallow dyke intrusion and potential
seismic tomography detects magma intrusions at Mount Etna. Science 313, slope failure imaged by ground deformation: the 28 December 2014 eruption
821 (2006). on Mount Etna. Geophys. Res. Lett. 42, 2727–2733 (2015).
15. Calò, M., Dorbath, M. C., Cornet, F. & Cuenot, N. Large-scale aseismic 40. Alparone, S. et al. Seismological constraints on the 2018 Mt. Etna (Italy) flank
motion identified through 4-D P-wave tomography. Geophys. J. Int. 186, eruption and implications for the flank dynamics of the volcano. Terra Nova
1295–1314 (2011). 32, 334–344 (2020).
16. De Gori, P., Chiarabba, C., Giampiccolo, E., Martinez-Arèvalo, C. & Patanè, 41. Patane, D., De Gori, P., Chiarabba, C. & Bonaccorso, A. Magma ascent and
D. Body wave attenuation heralds incoming eruptions at Mount Etna, the pressurization of Mount Etna’s volcanic system. Science 299, 2061–2063
Geology. Geology (2011) 39, 503–506 (2011). (2003).
17. Londoño, J. M. & Kumagai, H. 4D seismic tomography of Nevado del Ruiz 42. Musumeci, C., Cocina, O., De Gori, P. & Patanè, D. Seismological evidence of
Volcano, Colombia, 2000–2016. J. Volcanol. Geotherm. Res. 358, 105–123 stress induced by dike injection during the 2001 Mt. Etna eruption. Geophys.
(2018). Res. Lett. 31, L07617 (2004).
18. Chiarabba, C., Piccinini, D. & De Gori, P. Velocity and attenuation 43. Lin, G., Amelung, F., Lavallée, Y. & Okubo, P. G. Seismic evidence for a crustal
tomography of the Umbria Marche 1997 fault system: evidence of a fluid- magma reservoir beneath the upper east rift zone of Kilauea volcano, Hawaii.
governed seismic sequence. Tectonophysics 476, 73–84 (2009). Geology 42, 187–190 (2014).
19. Koulakov, I. et al. Rapid changes in magma storage beneath the Klyuchevskoy 44. Caricchi, L., Burlini, L. & Ulmer, P. Propagation of P and S-waves in magmas
group of volcanoes inferred from time-dependent seismic tomography. J. with different crystal contents: Insights into the crystallinity of magmatic
Volcanol. Geotherm. Res. 263, 75–91 (2013). reservoirs: J. Volcanol. Geotherm. Res. 178, 740–750 (2008).
20. Giampiccolo, E., Cocina, O., De Gori, P. & Chiarabba, C. Dyke intrusion and 45. Alparone, S. C. et al. Mt. Etna Revised and Concise Seismic Catalog from 1999
stress-induced collapse of volcano flanks: the example of the 2018 event at Mt. (EtnaRCSC) [Data set]. Istituto Nazionale di Geofisica e Vulcanologia
Etna (Sicily, Italy). Sci. Rep. 10, 6373 (2020). (INGV), https://doi.org/10.13127/ETNASC/ETNARCSC (2020).
8 COMMUNICATIONS EARTH & ENVIRONMENT | (2021)2:216 | https://doi.org/10.1038/s43247-021-00282-9 | www.nature.com/commsenvCOMMUNICATIONS EARTH & ENVIRONMENT | https://doi.org/10.1038/s43247-021-00282-9 ARTICLE
46. Barberi, G. et al. Mt. Etna Revised Seismic Catalog from 2020 (EtnaRSC2020) Additional information
[Data set]. Istituto Nazionale di Geofisica e Vulcanologia (INGV). https:// Supplementary information The online version contains supplementary material
doi.org/10.13127/etnasc/etnarsc2020 (2021). available at https://doi.org/10.1038/s43247-021-00282-9.
47. Haslinger, F. Velocity structure, seismicity and seismotectonics of
Northwestern Greece between the Gulf of Arta and Zakynthos, Diss. ETH, Correspondence and requests for materials should be addressed to Pasquale De Gori.
12966, https://doi.org/10.3929/ethz-a-002025706
48. Toomey, D. R. & Foulger, G. R. Tomographic inversion of local earthquake Peer review information Communications Earth & Environment thanks Tim Greenfield
data from the Hengill-Grensdalur central volcano complex, Iceland. J. and the other, anonymous, reviewer(s) for their contribution to the peer review of this
Geophys. Res. 94, 17497–17510 (1989). work. Primary Handling Editors: Emma Liu and Clare Davis. Peer reviewer reports are
available.
Reprints and permission information is available at http://www.nature.com/reprints
Acknowledgements
We wish to thank the INGV-OE seismic technical staff who ensured the regular working
of the seismic monitoring network and the Gruppo Analisi Dati Sismici for providing Publisher’s note Springer Nature remains neutral with regard to jurisdictional claims in
manual pickings and 1D earthquakes locations. This study has benefited from funding published maps and institutional affiliations.
provided by the Italian Presidenza del Consiglio dei Ministri—Dipartimento della Pro-
tezione Civile (DPC). This paper does not necessarily represent DPC official opinion and
policies. We are grateful for the constructive comments raised by the Editor, Tim Open Access This article is licensed under a Creative Commons
Greenfield and two anonymous reviewers. This research was carried out in the frame Attribution 4.0 International License, which permits use, sharing,
of the IMPACT PROJECT (INGV Department strategic Projects - 2019) WP1, Task 2- adaptation, distribution and reproduction in any medium or format, as long as you give
Mt. Etna structure. appropriate credit to the original author(s) and the source, provide a link to the Creative
Commons license, and indicate if changes were made. The images or other third party
material in this article are included in the article’s Creative Commons license, unless
Author contributions indicated otherwise in a credit line to the material. If material is not included in the
P.D.G., E.G. and O.C. analyzed data and models and contributed to figures and text, C.C. article’s Creative Commons license and your intended use is not permitted by statutory
contributed to the analysis and prepared and edited the paper, S.B. and C.D. collaborated regulation or exceeds the permitted use, you will need to obtain permission directly from
in the discussion and edited the text. the copyright holder. To view a copy of this license, visit http://creativecommons.org/
licenses/by/4.0/.
Competing interests
The authors declare no competing interests. © The Author(s) 2021
COMMUNICATIONS EARTH & ENVIRONMENT | (2021)2:216 | https://doi.org/10.1038/s43247-021-00282-9 | www.nature.com/commsenv 9You can also read