Metabolic responses to polychromatic LED and OLED light at night
←
→
Page content transcription
If your browser does not render page correctly, please read the page content below
www.nature.com/scientificreports
OPEN Metabolic responses
to polychromatic LED and OLED
light at night
Asuka Ishihara1,2, Insung Park1, Yoko Suzuki1, Katsuhiko Yajima3, Huiyun Cui4,
Masashi Yanagisawa1, Takeshi Sano5, Junji Kido6 & Kumpei Tokuyama1*
Light exposure at night has various implications for human health, but little is known about its effects
on energy metabolism during subsequent sleep. We investigated the effects of polychromatic white
light using conventional light-emitting diodes (LED) and an alternative light source, organic light-
emitting diodes (OLED), producing reduced spectral content in the short wavelength of blue light
(455 nm). Ten male participants were exposed to either LED, OLED (1000 lx), or dim (< 10 lx) light for
4 h before sleep in a metabolic chamber. Following OLED exposure, energy expenditure and core body
temperature during sleep were significantly decreased (p < 0.001). Fat oxidation during sleep was
significantly reduced (p = 0.001) after the exposure to LED compared with OLED. Following exposure
to OLED, fat oxidation positively correlated with the 6-sulfatoxymelatonin levels, suggesting that the
role of melatonin in lipolysis differs depending on the light. These findings advance our knowledge
regarding the role of light in energy metabolism during sleep and provide a potential alternative to
mitigate the negative consequences of light exposure at night.
Artificial light at night has transformed the lives of human beings, enabling a wide array of evening activities.
Accompanied by this development in the modern-day world and lifestyle dominated by electronic devices,
extended exposure to light during the dark hours has also brought negative consequences on human health,
including alterations in sleep/wake regulation1, circadian rhythm2, thermoregulation3, and secretion pattern of
hormones such as melatonin and cortisol4.
Light-emitting diodes (LED) are the most widely adopted lights for its advantages in easy usage, low power
consumption, long lifetime, and instant ignition at low temperatures, but their emission spectrum is rich in the
short wavelength of blue light at 460 n m5. A previous study demonstrated that the exposure to monochromatic
blue light (469 nm) between 2:00 and 3:30 elicited an increase in plasma melatonin suppression compared to
fluorescent white light in a dose dependent m anner6. In addition, light-emitting electronic devices 4 h prior to
sleep promotes alertness by decreasing delta/theta activity, suppressing melatonin, and increasing sleep l atency7.
The use of alternative light sources has been proposed to mitigate the negative physiological effects of LED.
Organic light-emitting diodes (OLED) have recently gained popularity, especially for use in displays and devices
for their glare-free, flexible nature, as well as its ability to achieve color temperature as low as 1 773K8, but most
importantly for its spectral content of polychromatic white light containing less blue light9.
The difference in the spectral composition between LEDs and OLEDs is crucial because melanopsin-express-
ing intrinsically photosensitive retinal ganglion cells (ipRGCs) are most sensitive to short wavelength of blue
light10. These non-image-forming photoreceptors transmit their signals to the suprachiasmatic nucleus in the
anterior hypothalamus, thereby entraining the circadian rhythm, and further project information to the pineal
gland where they affect melatonin s ynthesis11. Park and colleagues demonstrated that the delay in dim light
melatonin onset (DLMO) was greater by exposure to LED light 6.5 h prior to sleep compared to the delay in
DLMO by OLED. However, studies evaluating the effects of OLED have been scarce to fully understand its
impact on human physiology.
In addition, the rapid development and increase in the number of studies of artificial light at night have pro-
vided insight into its important role in metabolic health. The results of both animal model and epidemiologic
1
International Institute for Integrative Sleep Medicine (WPI‑IIIS), University of Tsukuba, Tsukuba, Ibaraki,
Japan. 2Ph.D. Program in Human Biology, School of Integrative Global Majors, University of Tsukuba, Tsukuba,
Japan. 3Faculty of Pharmaceutical Sciences, Josai University, Saitama, Japan. 4Graduate School of Comprehensive
Human Sciences, University of Tsukuba, Ibaraki, Japan. 5Innovation Center for Organic Electronics, Yamagata
University, Yamagata, Japan. 6Graduate School of Organic Materials Science, Yamagata University, Yamagata,
Japan. *email: tokuyama.kumpei.gf@u.tsukuba.ac.jp
Scientific Reports | (2021) 11:12402 | https://doi.org/10.1038/s41598-021-91828-6 1
Vol.:(0123456789)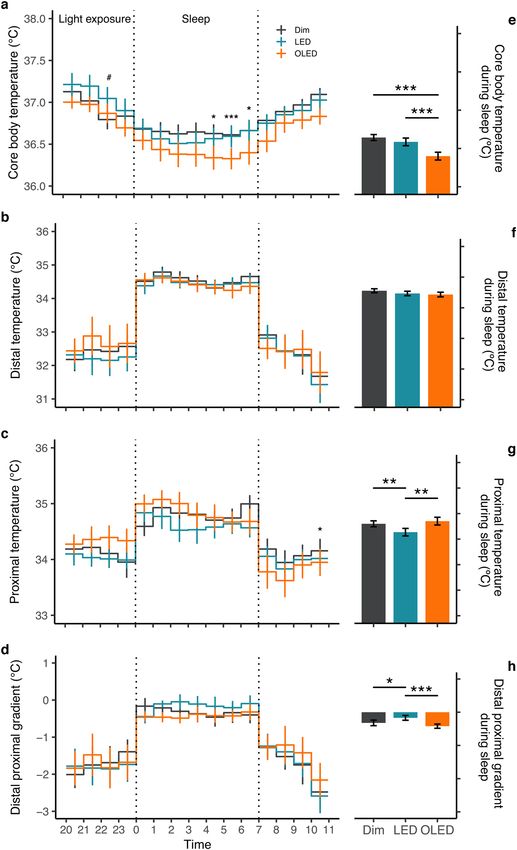
www.nature.com/scientificreports/
Dim LED OLED p†
TIB 420 420 420
TST 387.7 ± 9.7 396.6 ± 3.5 384.7 ± 8.2 0.481
Sleep latency 4.8 ± 1.7 5.7 ± 2.4 14.5 ± 8.4 0.281
SWS latency 21.6 ± 3.0 20.3 ± 4.3 30.4 ± 9.6 0.233
REM latency 120.8 ± 16.8 99.1 ± 14.2 109.7 ± 23.2 0.639
N1 45.9 ± 4.6 47.6 ± 6.8 44.8 ± 5.0 0.786
N2 199.6 ± 11.7 208.6 ± 13.1 194.7 ± 11.7 0.392
SWS 68.7 ± 9.0 66.6 ± 10.7 73.9 ± 7.9 0.496
REM 73.6 ± 9.2 73.9 ± 7.7 71.4 ± 6.8 0.870
WASO 27.9 ± 9.2 19.6 ± 2.2 21.2 ± 4.0 0.495
SE (%) 92.3 ± 2.3 94.4 ± 0.8 91.6 ± 1.9 0.481
Table 1. Sleep architecture. Sleep parameters indicated as TIB, Time in bed; TST, total sleep time; SWS,
slow-wave sleep; REM, rapid eye movement; N1, non-rapid eye movement sleep stage 1; N2, non-rapid eye
movement sleep stage 2; WASO, wake after sleep onset; SE, sleep efficiency. Values are mean ± SE in minutes
(n = 10). p†; one-way repeated measures ANOVA.
studies have demonstrated a link between light exposure and an increased risk of weight g ain13, obesity14–16,
insulin resistance17, and metabolic impairments18. An emerging topic of interest is the effects of light, particularly
OLED, on energy expenditure and substrate oxidation. Morning light exposure as a treatment for individuals
with seasonal depression lowers19 or has no significant immediate effect on resting metabolic rate20. Daytime
light treatment with 2500 lx between 14:00 and 16:00 for 1 week increases oxygen consumption in individu-
als with seasonal d epression21. Daytime light exposure at 750 lx for 14 continuous hours starting at 08:00 in
healthy participants has no significant impact on 24-h energy expenditure or substrate oxidation22. Exposure to
monochromatic blue light (465 nm) 2 h before sleep does not affect energy metabolism during sleep, whereas
it decreases energy expenditure, oxygen consumption, and carbon dioxide production after waking the next
morning23. Thus, the impact of light exposure at night on energy metabolism during sleep remains unknown.
Here, we aimed to examine the effects of exposure to light with varying spectral composition on energy
metabolism and sleep using polychromatic OLED and LED lights. We hypothesized that OLED containing less
blue light relative to LED would have minimal effects on sleep and energy metabolism, comparable to that of dim
light condition. Administration of light was set to evening to assess the immediate effects of light exposure on
energy metabolism during sleep. With the rapid development and widespread use of light at night in our current
society, understanding the physiological effects of these lights is crucial when considering long-term implications.
Results
Sleep. The overall sleep architecture did not differ significantly among LED, OLED or dim light conditions
(Table 1). To investigate the effects of light exposure on sleep homeostasis, we analyzed the EEG delta power
(0.5–4 Hz) during slow-wave sleep. Neither the delta power time course (p = 0.125; Supplementary Fig. 1a) nor
the delta power density (p = 0.425; Supplementary Fig. 1b) differed significantly among the conditions. Subjec-
tive sleep and sleepiness assessment scores using the Oguri-Shirakawa-Azumi sleep inventory MA version and
Karolinska Sleepiness Scale also did not differ significantly among the conditions (Supplementary Table 1, Sup-
plementary Fig. 2).
Energy metabolism. Mean energy expenditure, respiratory quotient (RQ), and fat oxidation were ana-
lyzed separately according to sleep and wake periods (Fig. 1, Supplementary Fig. 3). During sleep, there was a
difference in mean energy expenditure (F2,138 = 6.1, p = 0.003) with a significant post hoc comparison between
OLED and dim light (p < 0.001; Fig. 1e). Mean RQ during sleep was also different among the light conditions
(F1,126 = 3.8, p = 0.029) with significant post hoc comparison between LED and OLED (p = 0.016; Fig. 1f). This
was consistent to the decrease in fat oxidation (F1,111 = 6.8, p = 0.003) with post hoc comparison revealing signifi-
cance between LED and OLED (p = 0.001), and LED and dim light (p = 0.003; Fig. 1g). The effect of light persisted
to the next morning after waking (Supplementary Fig. 3). Differences in mean energy expenditure ( F1,63 = 7.5,
p = 0.002) indicated significant post hoc comparison between dim light and OLED (p = 0.001), and dim light
and LED (p = 0.047) (Supplementary Fig. 3a). Mean RQ remained high after waking ( F2,78 = 3.7, p = 0.03) with a
significant post hoc between LED and dim light (p = 0.024). Fat oxidation was significantly decreased (F2,78 = 5.6,
p = 0.005) with post hoc comparison resulting in a significance between LED and dim light (p = 0.003; Sup-
plementary Fig. 3b, c). Carbohydrate (p = 0.163) and protein oxidation (p = 0.307) were unaffected by the light
conditions, both during sleep and after waking (Fig. 1h, Supplementary Fig. 3d). A two-way repeated measures
ANOVA on the time course of energy metabolism with factors of light condition and time revealed no signifi-
cant main effect of light condition or of the interaction between condition and time (Fig. 1).
Thermoregulation. A two-way repeated measures ANOVA revealed no significant effect of the light condi-
tion on the time course of the core body temperature (p = 0.162), but a significant interaction between condition
Scientific Reports | (2021) 11:12402 | https://doi.org/10.1038/s41598-021-91828-6 2
Vol:.(1234567890)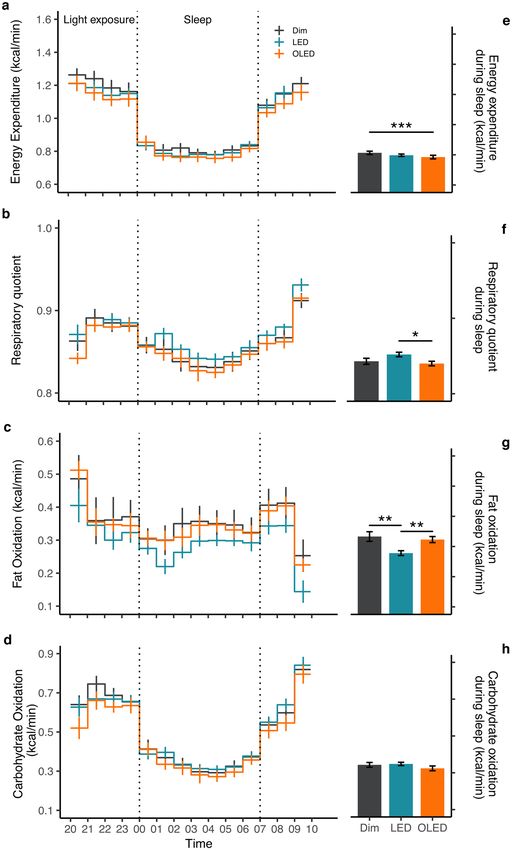
www.nature.com/scientificreports/
Figure 1. Energy metabolism. Time course (left panel) and mean values during sleep (right panel) are shown
for (a) energy expenditure, (b) respiratory quotient, (c) fat oxidation, and (d) carbohydrate oxidation indicated
as mean ± SE (n = 10). Significant differences among light conditions in energy metabolism during sleep were
assessed by one-way repeated measures ANOVA with Bonferroni’s adjustment, *p < 0.05, **p < 0.01, ***p < 0.001.
and time ( F30,250 = 1.7, p = 0.016; Fig. 2a). Post hoc analysis showed a significant increase in body temperature in
LED compared with dim light before sleep and a significant decrease in OLED compared with dim light during
Scientific Reports | (2021) 11:12402 | https://doi.org/10.1038/s41598-021-91828-6 3
Vol.:(0123456789)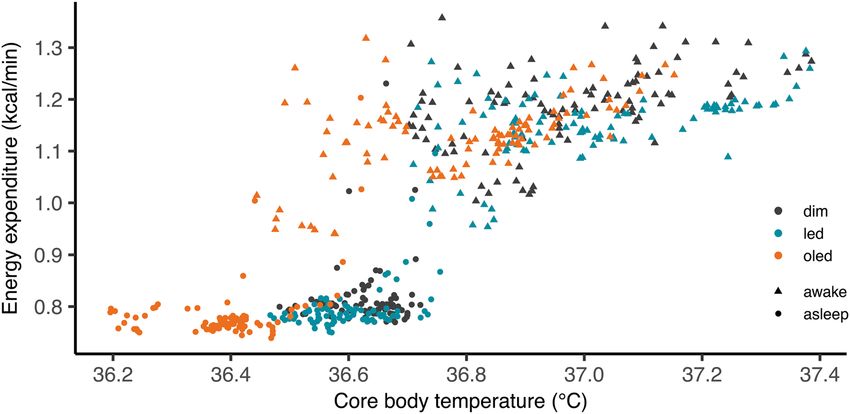
www.nature.com/scientificreports/
sleep (Fig. 2a). Mean body temperature was significantly lower (F1,120 = 21.1, p < 0.001) with post hoc revealing
significant difference between OLED and dim light, and OLED and LED, both during sleep (p = 0.001; Fig. 2e)
and after waking (p < 0.001; Supplementary Fig. 4a).
Skin temperature was assessed on the basis of proximal and distal temperatures from a total of eight locations.
A two-way repeated measures ANOVA on the time course of the proximal temperature revealed no significant
effect of the light condition (p = 0.327), but a significant interaction between condition and time ( F30,201 = 1.8,
p = 0.009). Post hoc analysis indicated a significant decrease in OLED compared with dim light after waking at
10:00 (Fig. 2c). Furthermore, proximal temperature, assessed at the forehead demonstrated a significant increase
in OLED compared with LED during and after sleep, but no significant differences were observed in other loca-
tions (Supplementary Fig. 5). No significant main effects of light condition were detected for distal temperature
or the distal proximal gradient (DPG); nor was there any interaction between condition and time.
Mean temperature during sleep was then assessed using a one-way repeated measures ANOVA on distal and
proximal temperatures and on the DPG (Fig. 2). During sleep, the proximal temperature was different among
the conditions (F2,96 = 8.6, p = 0.0004) with significant post hoc comparison between LED and OLED (p = 0.004),
and LED and dim light (p = 0.002) (Fig. 2c). A greater widening of the DPG ( F2,96 = 7.2, p = 0.001) was observed
in both dim light (p = 0.02) and OLED (p < 0.001) compared with LED after post hoc analysis (Fig. 2h). The distal
temperature did not differ significantly among the light conditions (Fig. 2f).
Relationship between body temperature and energy expenditure during the sleep and wake periods are shown
in Fig. 3. In all lighting conditions, core body temperature and energy expenditure showed a higher value during
wake period compared to that of sleep period (Fig. 3).
Urinary melatonin. Total urinary excretion of 6-sulfatoxymelatonin (aMT6s) did not differ between the
light conditions (p = 0.923; Fig. 4a). Urinary melatonin metabolites and energy metabolism were then further
analyzed stratified by light conditions. Urinary aMT6s positively correlated with energy expenditure under
OLED (Supplementary Fig. 6). Urinary melatonin metabolites showed no correlation with RQ in each of the
light conditions; dim light (p = 0.52), OLED (p = 0.42), and LED (p = 0.41; Supplementary Fig. 6). A significant
positive correlation between urinary aMT6s and fat oxidation was observed under OLED (r2 = 0.46, p = 0.032).
There was no correlation under dim light (r2 = 0.36, p = 0.068) or LED (p = 0.96; Fig. 4b).
Discussion
Evening exposure to polychromatic light altered the energy metabolism and core body temperature during sleep
while showing little effect on the sleep architecture, suggesting that the influence of light on energy metabolism
and thermoregulation observed in the present study is possibly affected by regulatory systems unrelated to those
of sleep. The effect on metabolism continued until after waking the subsequent morning.
Wavelength dependency of light on sleep and the circadian rhythm is such that exposure to shorter wave-
length of light in the evening suppress melatonin and increase sleep l atency24. Exposure to monochromatic blue
light (460 nm) compared to green light (550 nm) reduces slow wave-activity24, and polychromatic blue-enriched
light reduces frontal NREM slow-wave activity during the first cycle of sleep25. In the present study, however, dif-
ferences in homeostatic sleep pressure were not observed from a one-night exposure to spectrally different light,
but this was consistent with findings from a previous study comparing the effects of OLED and LED on sleep12.
The contradictory results may be due to the methods of administering light among the studies. Direct, high-
intensity light utilizing a customized ganzfeld dome or goggles is often used in light exposure e xperiments26,27.
In the present study, as well as in the previous study by Park and colleagues12, light exposure was conducted
using ambient light placed above or in front of the participant’s angle of gaze. Thus, the precise amount of light
reaching the retina at the cornea level remains to be an approximation. Nevertheless, it should be noted that
ambient lighting more closely resembles our daily light exposure.
The alerting effect of light before sleep is reflected in EEG activity7 but also on thermoregulatory parameters
such that exposure to bright light prior to sleep significantly increases core body temperature compared with dim
light1,28. Likewise, evening exposure to monochromatic blue light significantly increases the core body tempera-
ture compared with monochromatic green and dim light3,24. The significant increase in core body temperature
in the LED condition before sleep in the present study also supports the alerting effect of high-content blue light
that was evaluated in previous studies.
Core body temperature is known to decrease before and during sleep, reflecting the suppression of heat
production and enhancement of heat loss from distal regions of the b ody29. Heat dissipation from the core to
the periphery is described as DPG, and its increase is associated with sleep p ropensity30. In the present study,
despite the significant decrease in core body temperature during sleep in OLED compared with dim light, DPG
and the proximal/distal temperatures did not differ significantly between the two conditions. This is in line with
a previous study reporting the inconsistency in heat production and heat dissipation following evening expo-
sure to monochromatic blue, green, and dim light3. Therefore, heat dissipation alone is insufficient to explain
the drop in the core body temperature during sleep exhibited in the present study in the OLED condition. Heat
production in the form of energy expenditure was also significantly lower in OLED compared with dim light. This
attenuation in energy expenditure, as well as core body temperature, may be the result of the Q 10 effect ( Q10 is a
measure of the change in a biological process due to a change in temperature), which downregulates metabolism
by decreasing body temperature. A previous study on patients with pathological conditions showed that a 1ºC
increase in body temperature is associated with an approximate 13% increase in the metabolic rate31. The Q10 of
biological reactions mainly ranges between 2.0 and 3.0 with a 7%-12% increase in the rate of a chemical reaction
from a 1ºC rise in temperature32. Because the regression analysis in the present study showed a 10.4% change
in energy metabolism due to an increase of 1ºC, the decrease in energy expenditure in OLED may be explained
Scientific Reports | (2021) 11:12402 | https://doi.org/10.1038/s41598-021-91828-6 4
Vol:.(1234567890)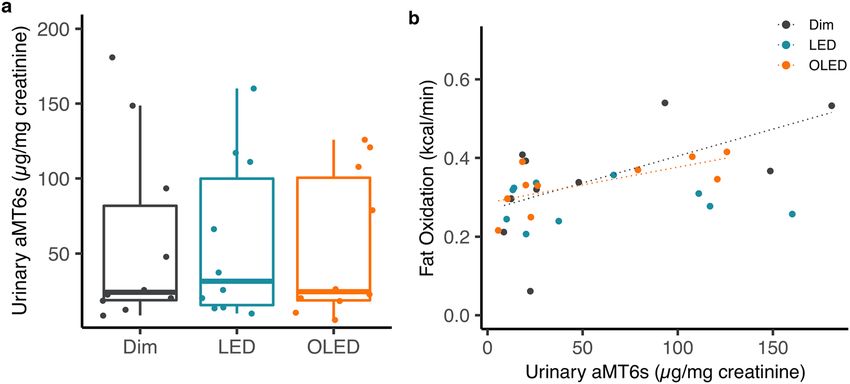
www.nature.com/scientificreports/
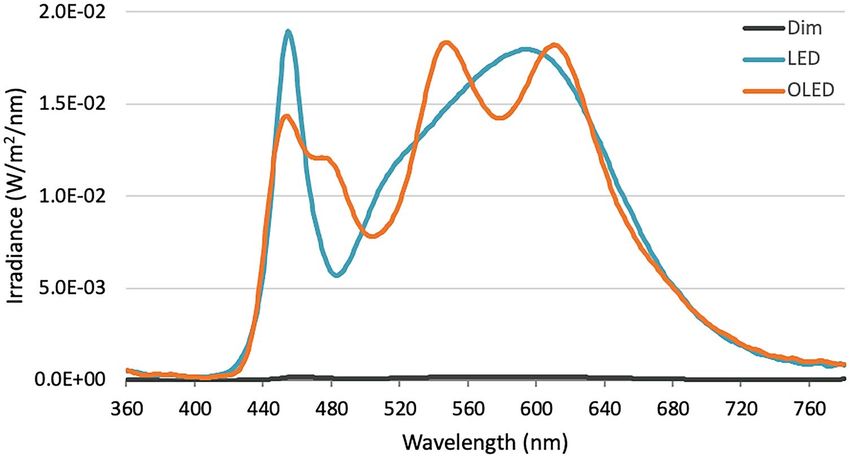
Figure 2. Thermoregulatory measures. Time course (left panel) and mean values during sleep (right panel)
are illustrated. (a) Core body temperature, (b) distal temperature, (c) proximal temperature, and (d) distal
proximal gradient expressed as mean ± SE. Time course analysis from two-way repeated measures ANOVA,
post-hoc pairwise comparison with Bonferroni’s adjustment; *p < 0.05, ***p < 0.001 between OLED and dim
light, #p < 0.05 between LED and dim light. Mean temperature during sleep by light condition from one-way
repeated measures ANOVA, post-hoc pairwise comparison with Bonferroni’s adjustment; *p < 0.05, **p < 0.01,
***p < 0.001. (n = 10 core body temperature; n = 8 skin temperature).
Scientific Reports | (2021) 11:12402 | https://doi.org/10.1038/s41598-021-91828-6 5
Vol.:(0123456789)www.nature.com/scientificreports/
Figure 3. Correlation between core body temperature and energy expenditure. Correlation plotted as 5-min
mean during sleep (circle) and wake (triangle) for dim (black), LED (blue), and OLED (orange) conditions.
Figure 4. Urinary 6-sulfatoxymelatonin (aMT6s). (a) Concentration of total aMT6s normalized to urinary
creatinine concentration. (b) Correlation between urinary aMT6s and fat oxidation of dim (black), LED (blue),
and OLED (orange) light.
by the Q 10 effect. Body temperature, however, also varies with energy expended in the form of heat production
fueled by protein, fat, and carbohydrates. Thus, the amount of macronutrient oxidized, ultimately contributing to
thermoregulation, remains to be determined. Further studies are necessary to understand the causal relationship
between energy expenditure and thermoregulation resulting from light exposure.
The ability to select fuel in response to alterations in the nutritional and physiological states is referred to as
metabolic flexibility and is often measured as the change in RQ of whole-body energy m etabolism33. During the
fasting state, such as during sleep, energy metabolism becomes reliant on fat oxidation to maintain a low RQ34.
The inability to switch to fat oxidation during sleep is associated with an increased risk of o besity35. In the pre-
sent study, evening exposure to LED light resulted in a significantly higher RQ compared with exposure to the
OLED light, and a significant decrease in fat oxidation during sleep. The difference in RQ during sleep suggests
that exposure to different light spectra at night affects substrate oxidation, providing a plausible link between
light exposure at night and weight gain36.
The specific factors that contribute to the alteration of substrate oxidation by light exposure remain to be iden-
tified. One of the main key factors transmitting photic stimulation to regulate energy metabolism is the hormone
melatonin, the secretion of which is suppressed by light with an optimal sensitivity to short wavelengths between
446 and 477 n m26. Melatonin, produced in the pineal gland, binds to melatonin receptors which are expressed
throughout the body, including pancreatic islets, adipose tissue, skeletal muscle, and liver, thus entraining the
downstream circadian r hythm37,38. In the present study, we assessed the concentration of aMT6s, the major
urinary metabolite of melatonin, which is strongly correlated with the serum melatonin concentration39. The
total excretion of aMT6s, however, did not differ among the light conditions. This is partly due to the poor time
resolution of the collected urinary samples as they reflect the total, combined amount of melatonin metabolites
Scientific Reports | (2021) 11:12402 | https://doi.org/10.1038/s41598-021-91828-6 6
Vol:.(1234567890)www.nature.com/scientificreports/
from day 1 to day 2 of the experimental days while participants were in the metabolic chamber. For this reason,
temporal changes in the concentration of melatonin metabolites were not identified. Additionally, because mela-
tonin has a large inter-individual variability40, we further analyzed the correlation between aMT6s and metabolic
parameters. Our results indicated that aMT6s excretion was marginally (p = 0.068) and significantly (p = 0.032)
correlated with fat oxidation in the dim and OLED conditions, respectively. This finding was consistent with
that of a previous study showing an inverse correlation between RQ and melatonin41. Interestingly, the tendency
toward a positive correlation between aMT6s excretion and fat oxidation was not observed in the LED condition
(p = 0.96). This suggests that the role of melatonin to stimulate lipolysis in intramuscular adipocytes observed
in porcine and bovine42,43 may not be preserved under exposure to LED, but retained under exposure to OLED,
possibly due to the reduction in the blue light spectrum. However, since OLED showed a stronger positive cor-
relation compared to dim light despite the increase in intensity and short wavelength of blue light, spectral com-
position alone seems to be insufficient to explicate these results. Temporal changes in melatonin concentration
need to be assessed to further understand its relation to energy metabolism during sleep. Additionally, although
the spectral peak occurred at 455 nm for LED, limitations exist in using blue light to excite melanopsin with a
maximum sensitivity at 4 80nm44. Considering that the melanopic lux between LED and OLED in the present
study were 730 and 780 lx respectively, the effect of the spectral composition of LED peaking at 454 nm of blue
light did not reflect clearly on the melanopic functions. In addition, since the non-image forming responses to
light is partially compensated by rods and cones45, melanopic responses alone may not be sufficient to explicate
the effects of spectral differences between LED and OLED.
In the present study, measurements of energy metabolism and thermoregulation were conducted for only one
night, thereby limiting our understanding of the overall metabolic changes throughout the day. Considering that
the physiological impact of light varies with the timing of the e xposure46, it is likely that daytime metabolism is
altered depending on the intensity, duration, and wavelength of light. Additionally, although our experiment
was not designed to account for the circadian changes caused by light exposure, a preliminary study showed
that maintaining a modified constant posture in dim light (< 10 lx) for 8 h prior to sleep moved the core body
temperature nadir time to either 30 min before or at sleep onset (unpublished data). Thus, it is important to
note whether dim light is indeed an ideal control to compare with the other light exposure conditions as it has
its own characteristic to possibly shift body temperature to an earlier time. Additionally, future studies involv-
ing light exposure must take into consideration the participants’ age and sex, as these factors may also impact
energy metabolism47,48.
The present study is one of the first to show that evening light exposure affects metabolism by selectively
utilizing substrates during sleep and the subsequent morning after waking. The contrasting metabolic outcomes
observed in the LED and OLED conditions may indicate differences in the spectral composition of light in which
the short wavelength of blue light negatively affects energy metabolism by increasing the RQ and decreasing fat
oxidation during sleep and after waking. Because the spectral composition and melanopic lux between LED and
OLED did not differ greatly, it is important to note that characteristics of light, apart from wavelength, such as the
glare, luminance, and frequency of fluctuation49, may play an additional role in human physiology. Nevertheless,
these findings suggest that OLED may be a viable alternative source of light at night.
Methods
Participants. Ten healthy males (mean ± SE: 25.7 ± 0.65 years; BMI: 22.3 ± 0.65 kg/m2) participated in a bal-
anced cross-over study. Participants were non-smokers, non-shift workers, and had not engaged in transmerid-
ian travel within 1 month prior to the experiment day. Participants did not have major sleep disorders (Pitts-
burgh Sleep Quality Index score ≤ 5), did not take sleeping pills, and had intermediate chronotypes as assessed
by the Morningness-Eveningness Questionnaire (MEQ)50. The study was conducted according to the guidelines
of the Declaration of Helsinki and the ethics committee of the University of Tsukuba reviewed and approved this
study (UMIN: 000042654). All participants signed an informed consent form before the experiment.
Study protocol and light exposure. One week prior to the experiment day, the participants maintained
a regular sleep and wake time and refrained from ingesting caffeine and alcoholic beverages for 3 days before the
experiment day. They underwent an adaptation night prior to the experiment day to familiarize themselves with
sleeping in the metabolic chamber room with polysomnographic recording. Body composition was measured
using the bioimpedance method (BC-118E, TANITA, Tokyo, Japan).
On the experiment day, the participants arrived at the sleep laboratory 6 h prior to their habitual sleep time
(Fig. 5). Relative clock time was normalized to a sleep time at 24:00 and wake time at 07:00. All sensors were
attached before entering the metabolic chamber. Dinner was served after the 30-min dark adaptation time, which
was conducted to attenuate any influence of daytime light exposure. The participants were then exposed to either
the 1000 lx LED, 1000 lx OLED, or dim LED (< 10 lx) at eye level for 4 h continuously while maintaining a sitting
posture until their habitual sleep time. They were prohibited from using any devices that emitted light. Hourly
questionnaires using the Karolinska Sleepiness Scale and tasks were administered to assess sleepiness during
light exposure. Immediately upon awakening, the Oguri-Shirakawa-Azumi sleep inventory middle-age version
(OSA-MA) was given to evaluate their subjective sleep. The questionnaire assesses sleep on the basis of 5 factors,
including sleepiness after waking, initiation and maintenance of sleep, dreaming, how refreshed they feel, and
sleep length. Participants ate breakfast 1 h after waking, and subjective sleepiness and energy metabolism were
continuously measured for 4 h after waking under regular room light (300 lx). Hourly questionnaires and tasks
were administered as during the previous night.
Polychromatic white light exposure was conducted using LED (OL291241, ODELIC Co., Ltd., Japan) and
OLED (P09, Lumiotec Inc., Japan). The spectral power distribution (Fig. 6) was measured using an illuminance
Scientific Reports | (2021) 11:12402 | https://doi.org/10.1038/s41598-021-91828-6 7
Vol.:(0123456789)www.nature.com/scientificreports/
Figure 5. Study protocol. Exposure to either LED (1000 lx), OLED (1000 lx), or dim (< 10 lx) light at eye level
for 4 h before sleep. Time of day indicated as relative hours with sleep time from 24:00 to 07:00.
Figure 6. Spectral power distribution of LED, OLED, and dim lights expressed in irradiance.
spectrophotometer (CL-500A, Konica Minolta Inc., Tokyo, Japan). Spectral irradiance measured at 455 nm
for LED was 1.89 × 10⁻² W m−22 nm−1 and OLED was 1.43 × 10⁻² W m−2 nm−1 under the same color tempera-
ture 4000 K. Light panels were set against the wall (Organic Lighting Corporation, Yamagata, Japan) directly
in front of the participants and adjusted to match the illuminance of around 1000 lx (log photon flux: 14.97
log10(cm−2 s−1)) at eye level with melanopic lux of 730 and 780 for LED and OLED r espectively51. Illuminance
was measured using a lux meter before the experiment (CL-70F, Konica Minolta Inc., Tokyo, Japan). Dim light
and day-2 morning room light exposures were conducted using a ceiling-mounted LED (Kitera 100, Aurora
Daiichi, Aichi, Japan).
Measurements. Energy metabolism. A whole room metabolic chamber was used to measure energy me-
tabolism (Fuji Medical Science Co., Ltd., Chiba, Japan). The airtight chamber, measuring 2.00 × 3.45 × 2.10 m
with an internal volume of 14.49 m 3, was furnished with a mattress, desk, chair, and toilet. Airflow in the
chamber was ventilated at a rate of 80 L/min. Temperature and humidity were maintained at 25.0 ± 0.5 °C and
55.0 ± 3.0%, respectively. The oxygen (O2) and carbon dioxide (CO2) concentrations were measured by mass
spectrometry (VG Prima δB, Thermo Electron Co., Winsford, UK). The precision of the mass spectrometry was
calculated from the standard deviation of measurements of a calibrated gas mixture ( O2 15%, C O2 5%), which
was < 0.002% for both O 2 and C
O2. Hourly average O2 (V̇O2) consumption and CO2 production (V̇CO2) rates
were calculated using an improved algorithm for transient r esponses52. Energy expenditure and macronutrient
oxidation were calculated based on V̇O2, V̇CO2, and urinary nitrogen excretion53, and the RQ was determined
as the ratio of V̇CO2 and V̇O2.
Sleep recordings and analysis. Sleep was recorded polysomnographically using a PSG-1100 (Nihon Kohden,
Tokyo, Japan). Electrodes were attached to record the electroencephalograms (F3/M2, F4/M1, C3/M2, C4/M1,
O1/M2, O2/M1), electrooculograms, and electromyograms. Sleep stages were visually scored by a registered pol-
ysomnographic technologist according to standard c riteria54. Spectral analysis on C3/M2 was conducted using
fast Fourier transformation on a 5-s window to obtain a 0.2 Hz resolution55. Delta power density was calculated
during non-rapid eye movement sleep in the frequency range from 0.75 to 4.00 Hz for each 30-s epoch of sleep.
Scientific Reports | (2021) 11:12402 | https://doi.org/10.1038/s41598-021-91828-6 8
Vol:.(1234567890)www.nature.com/scientificreports/
Thermometry. Core body temperature was continuously measured every 30 s using a CorTemp sensor and
a data recorder (CorTemp, HQ Inc., Palmetto, FL, USA). The sensor in a single-use ingestible pill is accurate
to ± 0.1ºC and was calibrated each time before use. Recorded data was reported as an hourly average.
Skin temperature was recorded at four proximal points; (infraclavicular area, midthigh on the right musculus
rectus femoris, 1 cm above the navel on the stomach, and forehead) and four distal points; (back of right and left
hands, middle of right and left foot instep). The mean proximal temperature was calculated with the following
equation; (forehead × 0.093) + (thigh × 0.347) + (infraclavicular area × 0.266) + (stomach × 0.294). The mean distal
temperature was the mean of both hands and feet. The DPG was calculated as the difference between the distal
and proximal skin t emperature56. Thermistor probes (ITP082-24, Nikkiso-Thermo Co., Tokyo, Japan) connected
to a data logger (N543, Nikkiso-Thermo Co.) were used to continuously record the skin temperature.
Urinary 6‑sulfatoxymelatonin assessment. Participants collected their urine samples continuously while they
were in the metabolic chamber room from 4 h before sleep to 4 h after waking. Total volume was measured, and
samples were stored at − 20ºC until assay. Urinary aMT6s was assayed from the sampled urine by a fluoromet-
ric high-pressure liquid chromatography57 comprised of an LC-20AD pump system (Shimadzu, Kyoto, Japan),
equipped with RF-10-A spectrofluorometer (Shimadzu, Kyoto, Japan), Inertsil ODS-3 analytical column (5020-
01732 GL Sciences, Tokyo, Japan), column oven kept at 40˚C (GL Science, Tokyo, Japan), and LCsolution (Ver-
sion 1.22 SP1 software, Shimadzu, Kyoto, Japan). All aMT6s was assayed using indole-3-acetamide as the inter-
nal standard and normalized to urinary creatinine levels to control for variations in the urine c oncentration58.
Statistics. All data are presented as mean ± SE. Time course data for delta power and energy metabolism
were analyzed by two-way repeated-measures ANOVA. Data during sleep or the subsequent morning was com-
pared using one-way repeated-measures ANOVA using post hoc Bonferroni’s adjustment for multiple compari-
sons. Greenhouse–Geisser correction was conducted when Mauchily’s spherecity was largely violated. Pearson’s
correlation was conducted for the association analysis. Semiparametric regression analysis was used to analyze
energy metabolism by sleep s tages59. All statistical analysis was conducted using R studio (version: 1.2.1335, R
Consortium, https://www.r-consortium.org).
Received: 15 March 2021; Accepted: 1 June 2021
References
1. Cajochen, C., Dijk, D. J. & Borbély, A. A. Dynamics of EEG slow-wave activity and core body temperature in human sleep after
exposure to bright light. Sleep 15, 337–343 (1992).
2. Czeisler, C. A. et al. Bright light resets the human circadian pacemaker independent of the timing of the sleep-wake cycle. Science
233, 667–671 (1986).
3. Cajochen, C. et al. High sensitivity of human melatonin, alertness, thermoregulation, and heart rate to short wavelength light. J.
Clin. Endocrinol. Metab. 90, 1311–1316 (2005).
4. Jung, C. M. et al. Acute effects of bright light exposure on cortisol levels. J. Biol. Rhythms. 25, 208–216 (2010).
5. Touitou, Y. & Point, S. Effects and mechanisms of action of light-emitting diodes on human retina and internal clock. Environ.
Res. 190, 109942. https://doi.org/10.1016/j.envres.2020.109942 (2020).
6. West, K. E. et al. Blue light from light-emitting diodes elicit a dose-dependent suppression of melatonin in humans. J. Appl. Physiol.
110, 619–626 (2011).
7. Chang, A. M., Aeschbach, D., Duffy, J. F. & Czeisler, C. A. Evening use of light-emitting eReaders negatively affects sleep, circadian
timing, and next-morning alertness. Proc. Natl. Acad. Sci. U.S.A. 112, 1232–1237 (2015).
8. Jou, J. H. et al. Organic light-emitting diode-based plausibly physiologically-friendly low color-temperature night light. Org.
Electron. 13, 1349–1355 (2012).
9. Kido, J., Kimura, M. & Nagai, K. Multilayer white light-emitting organic electroluminescent device. Science 267, 1332–1334 (1995).
10. Do, M. T. H. Melanopsin and the intrinsically photosensitive retinal ganglion cells: biophysics to behavior. Neuron 104, 205–226
(2019).
11. Perreau-Lenz, S. et al. Suprachiasmatic control of melatonin synthesis in rats: inhibitory and stimulatory mechanisms. Eur. J.
Neurosci. 17, 221–228 (2003).
12. Park, H. R., Choi, S. J., Jo, H., Cho, J. W. & Joo, E. Y. Effects of evening exposure to light from organic light-emitting diodes on
melatonin and sleep. J. Clin. Neurol. 16, 401–407 (2020).
13. Fonken, L. K. et al. Light at night increases body mass by shifting the time of food intake. Proc. Natl. Acad. Sci. U.S.A. 107,
18664–18669. https://doi.org/10.1073/pnas.1008734107 (2010).
14. Obayashi, K. et al. Exposure to light at night, nocturnal urinary melatonin excretion, and obesity/dyslipidemia in the elderly: a
cross-sectional analysis of the HEIJO-KYO study. J. Clin. Endocrinol. Metab. 98, 337–344 (2013).
15. Rybnikova, N. A., Haim, A. & Portnov, B. A. Does artificial light-at-night exposure contribute to the worldwide obesity pandemic?.
Int. J. Obes. (Lond) 40, 815–823 (2016).
16. Albreiki, M. S., Middleton, B. & Hampton, S. M. A single night light exposure acutely alters hormonal and metabolic responses
in healthy participants. Endocr. Connect. 6, 100–110 (2017).
17. Shi, S. Q., Ansari, T. S., McGuinness, O. P., Wasserman, D. H. & Johnson, C. H. Circadian disruption leads to insulin resistance
and obesity. Curr. Biol. 23, 372–381 (2013).
18. Wang, X. S., Armstrong, M. E. G., Cairns, B. J., Key, T. J. & Travis, R. C. Shift work and chronic disease: the epidemiological evi-
dence. Occup. Med. (Lond) 61, 78–89 (2011).
19. Gaist, P. A. et al. Effects of bright light on resting metabolic rate in patients with seasonal affective disorder and control subjects.
Biol. Psychiatry. 28, 989–996 (1990).
20. Ivanova, I. A., Danilenko, K. V. & Aftanas, L. Investigation of an immediate effect of bright light on oxygen consumption, heart
rate, cortisol, and α-amylase in seasonal affective disorder subjects and healthy controls. Neuropsychobiology 74, 219–225 (2016).
21. Pinchasov, B. B., Shurgaja, A. M., Grischin, O. V. & Putilov, A. A. Mood and energy regulation in seasonal and non-seasonal
depression before and after midday treatment with physical exercise or bright light. Psychiatry Res. 94, 29–42 (2000).
Scientific Reports | (2021) 11:12402 | https://doi.org/10.1038/s41598-021-91828-6 9
Vol.:(0123456789)www.nature.com/scientificreports/
22. Melanson, E. L. et al. Daytime bright light exposure, metabolism, and individual differences in wake and sleep energy expenditure
during circadian entrainment and misalignment. Neurobiol. Sleep Circadian Rhythms. 4, 49–56 (2018).
23. Kayaba, M. et al. The effect of nocturnal blue light exposure from light-emitting diodes on wakefulness and energy metabolism
the following morning. Environ. Health. Prev. Med. 19, 354–361 (2014).
24. Münch, M. et al. Wavelength-dependent effects of evening light exposure on sleep architecture and sleep EEG power density in
men. Am. J. Physiol. Regul. Integr. Comp. Physiol. 290, R1421–R1428 (2006).
25. Chellappa, S. L. et al. Acute exposure to evening blue-enriched light impacts on human sleep. J. Sleep Res. 22, 573–580 (2013).
26. Brainard, G. C. et al. Action spectrum for melatonin regulation in humans: evidence for a novel circadian photoreceptor. J. Neurosci.
21, 6405–6412 (2001).
27 Zeitzer, J. M., Ruby, N. F., Fisicaro, R. A. & Heller, H. C. Response of the human circadian system to millisecond flashes of light.
PLoS ONE 6, e22078. https://doi.org/10.1371/journal.pone.0022078 (2011).
28. Dijk, D. J., Cajochen, C. & Borbély, A. A. Effect of a single 3-hour exposure to bright light on core body temperature and sleep in
humans. Neurosci. Lett. 121, 59–62 (1991).
29. Kräuchi, K. & Wirz-Justice, A. Circadian clues to sleep onset mechanisms. Neuropsychopharmacology 25, S92–S96 (2001).
30. Kräuchi, K., Cajochen, C., Werth, E. & Wirz-Justice, A. Warm feet promote the rapid onset of sleep. Nature 401, 36–37 (1999).
31. Du Bois, E. F. The basal metabolism in fever. JAMA 77, 352–357 (1921).
32. Hochachka, P. W. & Somero, G. N. Biochemical Adaptation (Princeton University Press, 1984).
33. Kelley, D. E., Goodpaster, B., Wing, R. R. & Simoneau, J. A. Skeletal muscle fatty acid metabolism in association with insulin
resistance, obesity, and weight loss. Am. J. Physiol. 277, E1130–E1141 (1999).
34. Galgani, J. E., Moro, C. & Ravussin, E. Metabolic flexibility and insulin resistance. Am. J. Physiol. Endocrinol. Metab. 295, E1009–
E1017 (2008).
35. Mynatt, R. L. et al. The RNA binding protein HuR influences skeletal muscle metabolic flexibility in rodents and humans. Metabo‑
lism 97, 40–49 (2019).
36. Wyse, C. A., Selman, C., Page, M. M., Coogan, A. N. & Hazlerigg, D. G. Circadian desynchrony and metabolic dysfunction; did
light pollution make us fat?. Med. Hypotheses 77, 1139–1144 (2011).
37. Ha, E. et al. Melatonin stimulates glucose transport via insulin receptor substrate-1/phosphatidylinositol 3-kinase pathway in
C2C12 murine skeletal muscle cells. J. Pineal Rs. 41, 67–72 (2006).
38. Nagorny, C. & Lyssenko, V. Tired of diabetes genetics? Circadian rhythms and diabetes: the MTNR1B story?. Curr. Diab. Rep. 12,
667–672 (2012).
39. Nowake, R., McMillen, I. C., Redman, J. & Short, R. V. The correlation between serum and salivary melatonin concentrations and
urinary 6-hydroxymelatonin sulphate excretion rates: two non-invasive techniques for monitoring human circadian rhythmicity.
Clin. Endocrinol. (Oxf) 27, 445–452 (1987).
40. Burgess, H. J. & Fogg, L. F. Individual differences in the amount and timing of salivary melatonin secretion. PLoS ONE 3, e3055.
https://doi.org/10.1371/journal.pone.0003055 (2008).
41. Tapia, M. et al. Melatonin relations with respiratory quotient weaken on acute exposure to high altitude. Front. Physiol. 9, 798.
https://doi.org/10.3389/fphys.2018.00798 (2018).
42. Yang, W., Tang, K., Zhang, Y. & Zan, L. Melatonin promotes triacylglycerol accumulation via MT2 receptor during differentiation
in bovine intramuscular preadipocytes. Sci. Rep. 7, 15080. https://doi.org/10.1038/s41598-017-12780-y (2017).
43. Li, J. et al. Adipose HuR protects against diet-induced obesity and insulin resistance. Nat. Commun. 10, 2375. https://doi.org/10.
1038/s41467-019-10348-0 (2019).
44. Berson, D. M., Dunn, F. A. & Takao, M. Phototransduction by retinal ganglion cells that set the circadian clock. Science 295,
1070–1073 (2002).
45. Panda, S. et al. Melanopsin (Opn4) requirement for normal light-induced circadian phase shifting. Science 298, 2213–2216 (2002).
46. St. Hilaire, M. A. et al. Human phase response curve to a 1 h pulse of bright white light. J. Physiol. 590, 3035–3045. https://doi.org/
10.1113/jphysiol.2012.227892 (2012).
47. Zhang, S. et al. Changes in sleeping energy metabolism and thermoregulation during menstrual cycle. Physiol. Rep. 8, e14353.
https://doi.org/10.14814/phy2.14353 (2020).
48. Roberts, S. B. & Rosenberg, I. Nutrition and aging: changes in the regulation of energy metabolism with aging. Physiol. Rev. 86,
651–667 (2006).
49. Inger, R., Bennie, J., Davies, T. W. & Gaston, K. J. Potential biological and ecological effects of flickering artificial light. PLoS ONE
9, e98631. https://doi.org/10.1371/journal.pone.0098631 (2014).
50. Horne, J. A. & Östberg, O. A self-assessment questionnaire to determine morningness-eveningness in human circadian rhythms.
Int. J. Chronobiol. 4, 97–100 (1976).
51. Lucas, R. J. et al. Measuring and using light in the melanopsin age. Trends. Neurosci. 37, 1–9 (2014).
52. Tokuyama, K., Ogata, H., Katayose, Y. & Satoh, M. Algorithm for transient response of whole body indirect calorimeter: decon-
volution with a regularization parameter. J. Appl. Physiol. 106, 640–650 (2009).
53. Ferrannini, E. The theoretical bases of indirect calorimetry: a review. Metabolism 37, 287–301 (1988).
54. Berry, R. B, Albertario, C. L., Harding, S. M., et al. for the American Academy of Sleep Medicine. The AASM manual for the scor-
ing of sleep and associated events: rules, terminology and technical specifications, version 2.5. Darien, IL: American Academy of
Sleep Medicine (2018).
55. Park, I. et al. Effects of subacute ingestion of chlorogenic acids on sleep architecture and energy metabolism through activity of the
autonomic nervous system: a randomised, placebo-controlled, double-blinded cross-over trial. Br. J. Nutr. 117, 979–984 (2017).
56. Kräuchi, K., Cajochen, C., Werth, E. & Wirtz-Justice, A. Functional link between distal vasodilation and sleep-onset latency?. Am.
J. Physiol. Regul. Integr. Comp. Physiol. 278, R741–R748 (2000).
57. Minami, M. et al. Novel tryptamine-related substances, 5-sulphatoxydiacetyltryptamine, 5-hydroxydiacetyltryptamine, and reduced
melatonin in human urine and the determination of those compounds, 6-sulphatoxymelatonin, and melatonin with fluorometric
HPLC. J. Chromatogr. B. Analyt. Technol. Biomed. Life. Sci. 877, 814–822 (2009).
58. Bonsnes, R. W. & Taussky, H. H. On the colorimetric determination of creatinine by the Jaffe reaction. J. Biol. Chem. 158, 581–591
(1945).
59. Kayaba, M. et al. Energy metabolism differs between sleep stages and begins to increase prior to awakening. Metabolism 69, 14–23
(2017).
Acknowledgements
We wish to thank Mr. Yoshiaki Tanaka and Ms. Simeng Zhang for their assistance with the study; Organic
Lighting Co. (Yamagata, Japan) for providing the lighting equipment; Fuji Medical Science Co. (Chiba, Japan)
for the technical support with the metabolic chamber; and the research participants for their dedication and
cooperation. This work was supported by the JSPS KAKENHI Grant Number JP 20H04120 and JST COI Grant
Number JPMJCE1312.
Scientific Reports | (2021) 11:12402 | https://doi.org/10.1038/s41598-021-91828-6 10
Vol:.(1234567890)www.nature.com/scientificreports/
Author contributions
A.I., T.K., T.S., and J.K. designed the experiments; A.I. and H.C. carried out the study; A.I., I.P., Y.S., and K.Y.
analyzed the data; A.I. wrote the manuscript; M.Y., T.S., J.K., and K.T. provided critical review and revisions to
the manuscript.
Competing interests
The authors declare no competing interests.
Additional information
Supplementary Information The online version contains supplementary material available at https://doi.org/
10.1038/s41598-021-91828-6.
Correspondence and requests for materials should be addressed to K.T.
Reprints and permissions information is available at www.nature.com/reprints.
Publisher’s note Springer Nature remains neutral with regard to jurisdictional claims in published maps and
institutional affiliations.
Open Access This article is licensed under a Creative Commons Attribution 4.0 International
License, which permits use, sharing, adaptation, distribution and reproduction in any medium or
format, as long as you give appropriate credit to the original author(s) and the source, provide a link to the
Creative Commons licence, and indicate if changes were made. The images or other third party material in this
article are included in the article’s Creative Commons licence, unless indicated otherwise in a credit line to the
material. If material is not included in the article’s Creative Commons licence and your intended use is not
permitted by statutory regulation or exceeds the permitted use, you will need to obtain permission directly from
the copyright holder. To view a copy of this licence, visit http://creativecommons.org/licenses/by/4.0/.
© The Author(s) 2021
Scientific Reports | (2021) 11:12402 | https://doi.org/10.1038/s41598-021-91828-6 11
Vol.:(0123456789)You can also read