Mechanisms of classical crystal growth theory explain quartz and silicate dissolution behavior
←
→
Page content transcription
If your browser does not render page correctly, please read the page content below
Mechanisms of classical crystal growth theory explain
quartz and silicate dissolution behavior
Patricia M. Dove*†, Nizhou Han*, and James J. De Yoreo‡
*Department of Geosciences, Virginia Polytechnic Institute and State University, Blacksburg, VA 24061; and ‡Department of Chemistry and Materials
Science, Lawrence Livermore National Laboratory, Livermore, CA 94551
Communicated by James K. Mitchell, Virginia Polytechnic Institute and State University, Blacksburg, VA, September 6, 2005 (received for review
July 14, 2005)
The central control of mineral weathering rates on biogeochemical
systems has motivated studies of dissolution for more than 50
years. A complete physical picture that explains widely observed
variations in dissolution behavior is lacking, and some data show
apparent serious inconsistencies that cannot be explained by the
largely empirical kinetic ‘‘laws.’’ Here, we show that mineral
dissolution can, in fact, be understood through the same mecha- Scheme 1.
nistic theory of nucleation developed for mineral growth. In
principle, this theory should describe dissolution but has never
been tested. By generalizing nucleation rate equations to include Twenty years ago, a mechanistic model of nucleation-driven
dissolution, we arrive at a model that predicts how quartz disso- crystal growth was introduced that described growth kinetics in
lution processes change with undersaturation from step retreat, to terms of four primary parameters: temperature T, supersaturation
defect-driven and homogeneous etch pit formation. This finding , step edge energy ␣, and step kinetic coefficient  (8, 9). By
reveals that the ‘‘salt effect,’’ recognized almost 100 years ago, examining energy barriers to growth, the theory considered the
arises from a crossover in dominant nucleation mechanism to probability of growth at dislocation defects vs. growth by nucleation
greatly increase step density. The theory also explains the disso- of two-dimensional (2D) adatom islands either at impurity defects
lution kinetics of major weathering aluminosilicates, kaolinite and or homogeneously across the surface, as illustrated in Scheme 1.
K-feldspar. In doing so, it provides a sensible origin of discrepancies This same theory also should apply to dissolution by analogous
reported for the dependence of kaolinite dissolution and growth processes that also assume rates are controlled through T, , ␣, and
rates on saturation state by invoking a temperature-activated , but this hypothesis has never been tested. Application of this
transition in the nucleation process. Although dissolution by nu- formalism to dissolution assumes that, in analogy to growth, it may
cleation processes was previously unknown for oxides or silicates, occur by activating ‘‘corrosion’’ either at dislocation defects or by
our mechanism-based findings are consistent with recent obser- nucleation of 2D vacancy islands at impurities or homogeneous
vations of dissolution (i.e., demineralization) in biological minerals. sites, as illustrated in Scheme 2.
Nucleation theory may be the missing link to unifying mineral Indeed, by using this approach, we can quantitatively explain the
growth and dissolution into a mechanistic and quantitative frame- dissolution kinetics of quartz and of the major silicate weathering
work across the continuum of driving force. minerals, feldspar (KAlSi3O8) and kaolinite [Al2Si2O5(OH)4]. We
also show that the principle of detailed balancing (5) is only
silica 兩 kinetics 兩 mineralization
applicable to quartz dissolution at very near to equilibrium condi-
tions where corrosion occurs by simple step edge retreat.
O ver long time scales, the geochemistry of earth systems is,
in large part, controlled by the kinetics of silicate mineral
dissolution. Because waters contain a wide variety of solute types
Methods
Dissolution Experiments. Dissolution- rate experiments used the
300- to 425-m fraction of pure quartz sand (Destin, FL). The
and concentrations, including significant levels of aqueous silica, material was pretreated with 30% H2O2 for 24 h, then alternately
there is considerable need to understand the dependence of washed with 10% HNO3 and distilled deionized water. Specific
GEOLOGY
silicate mineral dissolution rates on chemical driving force, as surface area of the final material was determined in triplicate
measured by the extent of undersaturation. This need has (Micromeritics, Norcross, GA). Mixed flow-through reactors con-
motivated intense investigations of both mineral weathering and structed of commercially pure titanium were used to measure the
the corrosion behavior of silica-based glasses. rate of silica production at 200°C for the overall reaction
Basic thermodynamic principles predict that mineral dissolution
rates should increase with increasing driving force or chemical SiO2 ⫹ 2H2O ⫽ H4SiOo4 , [1]
potential; however, experimental studies of major silicate minerals
show that this dependence is complex. A further complication is the
so-called ‘‘salt effect’’ reported for quartz, SiO2, whereby the
dissolution rate of this oxide end-member to all silicates is increased
up to 100 times in the presence of the major cationic solutes found
in natural waters (Na⫹, K⫹, Ca2⫹, Mg2⫹) (1–3). In contrast,
dissolution rates of silicate minerals have only a weak sensitivity to
the introduction of electrolytes (4). To explain these behaviors,
many of the widely used rate models are based on variants of Scheme 2.
transition state theory and assume microscopic reversibility (5–7).
Their shortcomings raise the question of whether or not the
Downloaded by guest on November 9, 2021
mechanistic models developed in the last few decades to so suc- Abbreviation: AFM, atomic force microscopy.
cessfully explain crystallization can be used to resolve the confusion †To whom correspondence should be addressed. E-mail: dove@vt.edu.
surrounding mineral dissolution. © 2005 by The National Academy of Sciences of the USA
www.pnas.org兾cgi兾doi兾10.1073兾pnas.0507777102 PNAS 兩 October 25, 2005 兩 vol. 102 兩 no. 43 兩 15357–15362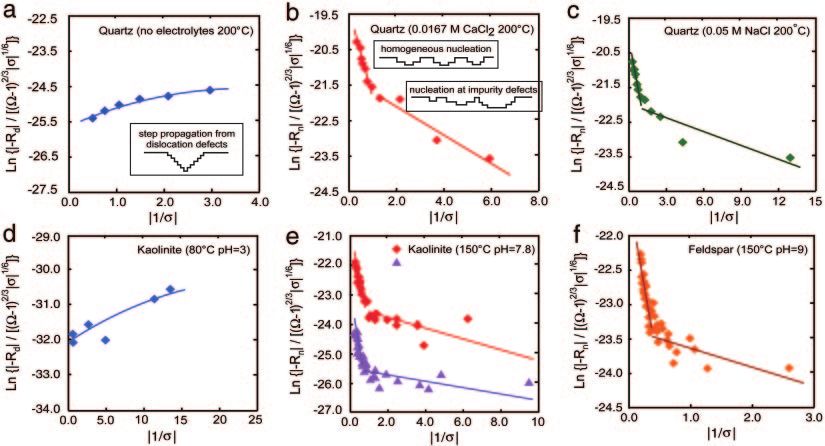
Table 1. Treatment conditions for (100) quartz surfaces
Number Solution ⍀
➀ No electrolyte 0.10 ⫺2.3
➁ 0.0167 M CaCl2 0.10 ⫺2.3
➂ 0.0167 M CaCl2 0.65 ⫺0.4
➃ 0.0167 M CaCl2 0.90 ⫺0.1
at steady-state conditions using established methods (3). The
solutions were prepared to specific values of undersaturation by
adding carefully characterized levels of the monomeric silicic acid,
H4SiO4. Some silica solutions also contained reagent-grade salts
(Aldrich) using 0.05 M NaCl or 0.0167 M CaCl2䡠2H2O such that
total ionic strength was constant at 0.05 M. All input solutions had
circumneutral pH and calculated in situ pH (pHT) of ⬇5.7. The
degree of undersaturation, , is defined by
⫽ ln⍀ ⫽ ln共C兾C e兲, [2]
where C and Ce are the measured and equilibrium concentrations
of H4SiOo4. We use concentrations instead of activities because H2O
and H4SiOo4 have activity coefficients very near unity for the
conditions of our experiments. A value of Ce ⫽ 10⫺2.4 M SiO2 (236
ppm SiO2), obtained from our dissolution experiments, is used to
calculate undersaturation, .
Atomic Force Microscopy (AFM) Imaging. In parallel experiments,
natural (100) prismatic surfaces of euhedral quartz crystals
(Herkimer, NY) were exposed to the solution conditions provided
in Table 1. The rationale for these choices will become clear later.
The surfaces were prepared as thin slices taken from the natural
crystal surface and restrained in a hydrothermal mixed flow-
through reactor using titanium screen. Durations of each treatment Fig. 1. Measured rates of quartz dissolution vs. saturation state (⍀) show the
were determined by using measured dissolution rates to calculate dependence on driving force and the presence or absence of simple electro-
the amount of reaction time necessary to give equal silica produc- lyte salts. Calculated experimental errors indicate 1SD of the mean estimate
and are illustrated for values larger than the symbol diameter. (a) Logarithm
tion (0.010 mol䡠m⫺2) for each treatment. Thus, etching times ranged
of rate vs. saturation state in water (blue circles), 0.0167 M CaCl2 (red dia-
from 28 days to 4 h. Resulting surface morphologies were examined monds), and 0.05 M NaCl (green triangles). Numbers correspond to conditions
by AFM under a drop of water at ambient conditions. that produced the surface structures in Fig. 2, and gray zones show under-
saturation range where transitions occur in the dominant dissolution mech-
Results anism. Inset uses a linear ordinate to better illustrate the exponential depen-
Kinetic measurements of quartz dissolution show a complex de- dence of rate on driving force when salts are introduced. (b) Expanded view
pendence on saturation state (Fig. 1a). At the low driving force of of rate dependence on ⍀ shows the linear dependence on saturation at
near-equilibrium conditions, dissolution rates are inversely corre- near-equilibrium conditions. This region is where the widely accepted first-
order rate dependence such as Eq. 8 applies. Eq. 8 is fit to the data by forcing
lated with ⍀ and the rate-enhancing effect of electrolytes is small
rate to zero at ⍀ ⫽ 1.0 as denoted by open symbols.
(1–4⫻, Fig. 1b). This result indicates that salts have relatively little
effect on quartz dissolution at the near-equilibrium conditions
commonly found in geothermal systems with large rock兾water by removal of molecules from the otherwise perfect crystal surface.
ratios or long contact times. When the driving force to reaction is These pits will, on average, grow provided they exceed a critical size
higher (⍀ ⬍ 0.70) rates acquire a nonlinear dependence on determined by the Gibbs–Thomson effect, a well-known thermo-
undersaturation. In the absence of electrolytes, quartz exhibits the dynamic principle. At this critical size, the free energy change goes
characteristic ‘‘dissolution plateau’’ also reported for gibbsite and through a maximum that defines an energy barrier to island
kaolinite (6, 10) (Fig. 1a). In contrast, rates measured in solutions formation. The height of the free energy barrier decreases with
that also contain 0.05 M NaCl or 0.0167 M CaCl2 become up to 100 increasing undersaturation and increases with increasing interfacial
times faster with decreasing ⍀. This salt-promoted rate enhance- energy of the newly created surface (i.e., the edge of the island).
ment at low ⍀, the so-called salt effect, is unique to quartz (3), and At sufficiently low undersaturation, the free energy barrier
Fig. 1a Inset shows that this effect is highly dependent on ⍀. becomes too high for vacancy island nucleation to occur on a time
scale that is competitive with the other processes. Dislocations,
Discussion although few in number, then provide the dominant source of steps.
A mechanism-based explanation for the kinetic behavior in Fig. 1a The step density of etch pits at dislocations also depends on
is found in the dislocation and 2D nucleation theories developed for interfacial energy and undersaturation. At very low undersatura-
crystal growth (8, 9, 11). A brief description of our application to tions, step density drops below the natural roughness of the crystal
dissolution is as follows. The rate at which a crystal dissolves is surface including the crystal edges, which are always a source of
controlled by the density of steps on the surface. These steps can be steps because they are rounded due to free energy minimization.
preexisting on the initial crystal surface or at the crystal edges, Dissolution then is dominated by retreat of these preexisting steps.
Downloaded by guest on November 9, 2021
emerge from dislocation sources, or be created by nucleating new To test these models for the dissolution of minerals, we
vacancy islands. Whichever source creates the greatest step density generalize the original growth equations so that they describe
will dominate the dissolution process. Vacancy islands are initiated both growth and dissolution for a wide range of saturations.
15358 兩 www.pnas.org兾cgi兾doi兾10.1073兾pnas.0507777102 Dove et al.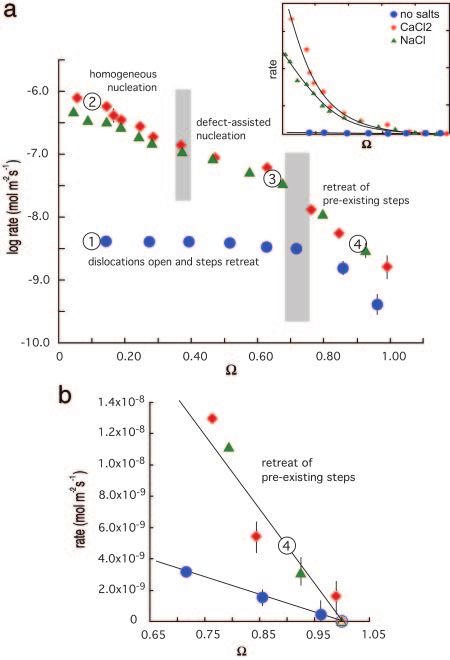
Dissolution at Dislocation. Regardless of the step source, the surface approaches 1 where step spacing at dislocation sources, which varies
normal growth or retreat rate R of a crystal can be expressed as as 1兾⍀, becomes larger than the average step spacing of the initial
crystal surface and兾or the steps retreating from the crystal’s edges,
h 0. In addition, there is a critical energy barrier to etch pit
R⫽ , [3]
formation. In this case, the step spacing also is given by 0.
Combining Eqs. 3 and 4, the dissolution rate becomes
where h ⫽ step height, ⫽ step spacing, and ⫽ speed of a moving
step. Both R and v are negative for dissolution. Similarly, regardless  hC e
of the step source, the in Eq. 3 depends on solution concentration ⫺R ⫽ k ⫹共1 ⫺ ⍀兲, k ⫹ ⫽ . [8]
according to the relation (8, 12)
This equation is of the form used to describe macroscopic disso-
⫽ 共C ⫺ Ce兲 ⫽  C e共⍀ ⫺ 1兲, [4] lution rate data within standard transition state theory (5, 7) for the
kinetics of a pseudo-first-order reaction. Here, we have related the
where  is the step kinetic coefficient (cm䡠s⫺1). Because  macroscopic rate coefficient k⫹ to the microscopic kinetic coeffi-
depends only on step direction and not the source of the steps, cient  of elementary step motion. As Fig. 1b shows, the near-
the determining factor for which step source dominates is the equilibrium dissolution data do indeed exhibit a linear dependence
step spacing, . on ⍀. As a result, the electrolyte effect on relative dissolution rate
Classical crystal growth theory states that there is a critical becomes constant, whereas the absolute differences diminish to
negatively free energy, ⌬GCrit, beyond which the line defects would zero as the two curves converge to equilibrium (⍀ ⫽ 1). From a fit
expand continuously and become an etch pit (13–16). This relation to the data we estimate k⫹ to be 1.1 ⫾ 0.2 ⫻ 10⫺8 and 5.1 ⫾ 1.2 ⫻
is given by 10⫺8 mol䡠m⫺2䡠s⫺1 for dissolution in the absence and presence of
2 2␣ 2 electrolytes, respectively.
⌬GCrit
d
⫽⫺ , [5] Independent evidence for a transition from step retreat to
b2 dislocation-controlled dissolution at these conditions is found in the
AFM images of the (100) quartz surfaces. Samples treated in
where ␣ is the interfacial free energy, is the molecular volume of
solutions without salts at high driving force (⍀ ⫽ 0.1) reveal
a molecule in the crystal, is the bulk shear modulus, and b is a
irregularly spaced etch pits having large dimensions of ⬇4,000 ⫻
Burgers vector. This critical value represents the activation energy
10,000 nm (Fig. 2, ①). The sloping sides of these features merge with
barrier for the formation of an etch pit at a dislocation. The height
pointed bottoms, thus indicating that they arise from dislocation
of the activation energy barrier depends on the nature of the crystal
defects in the mineral (18). The prevalence of these etch structures
(e.g., interfacial free energy and its Burgers vector) and is inde-
concurs with earlier studies citing the importance of dislocation
pendent of solution undersaturation. Note that for an edge dislo-
defects in controlling silicate dissolution at small values of ⍀ (15).
cation in quartz, the equation still applies because Poisson’s ratio for
The complementary AFM images of quartz surfaces exposed to
quartz is small (0.077) (15).
very near-equilibrium conditions (⍀ ⫽ 0.90) in CaCl2 solutions
When dissolution occurs at a dislocation, is related to the
confirm that dissolution occurs through a simple step retreat
critical size rc and the perimeter of the dislocation source P by
process by showing surfaces comprised of multiple straight-edged
8rc ⫹ P ␣ steps without evidence of etch pits (Fig. 2, ④). Note that these
⫽ with r c ⫽ , [6] experiments purposefully used CaCl2 solutions, which, as we show
m kT兩 兩 below, increase rates and probabilities of pit formation. We infer,
where m ⫽ number of elementary steps, k ⫽ Boltzmann constant, therefore, that dissolution in solutions without electrolytes in these
T ⫽ temperature, and ␣ ⫽ interfacial free energy associated with near-equilibrium solutions also proceeds by simple step retreat. At
the step edge created at a pit, henceforth called ‘‘step edge energy.’’ conditions where the driving force needed to initiate dissolution at
By substituting Eqs. 4 and 6 into Eq. 3 and rewriting in the form of dislocation defects is exceeded, our AFM observations reinforce the
log兩⫺R兩 vs. ⍀ to conform to the conventional method of presenting conclusion that total rate is governed by density of step edges.
mineral dissolution data (as in Fig. 1a), we obtain the surface
Dissolution by Nucleation of Vacancy Islands. To explain the differ-
normal dissolution rate at a dislocation Rd as a function of under-
saturation ences in the data obtained with and without salts in Fig. 1a, we now
GEOLOGY
consider dissolution by etch pit nucleation at vacancy islands. The
log兩⫺R d兩 ⫽ log 冋 A 1共1 ⫺ ⍀兲兩ln⍀兩
1 ⫹ A 2兩ln⍀兩
, 册 A1 ⫽
mh  C ekT
8␣
,
general expression for dissolution or growth by nucleation processes
is based on the assumption that the free energy barrier to initiating
a vacancy or adatom island, respectively, from a perfect surface,
PkT ⌬GCrit
n
, is given by (9)
A2 ⫽ . [7]
8 ␣ ␣ 2 h
⌬GCrit
n
⫽⫺ . [9]
Eq. 7 has properties that show the physical basis of the dissolution kT ln ⍀
plateau and also shows the link to macroscopic rate laws. This
Eq. 9 shows that the barrier to formation of vacancy islands by 2D
function diverges negatively as ⍀ approaches 1, rises rapidly as ⍀
nucleation depends on solution undersaturation, in contrast to the
decreases, transitions to a plateau region of low slope near ⍀ ⫽
energy barrier for etch pits formed at dislocations (Eq. 5). Hence,
exp(⫺1兾A2), and reaches a finite value as ⍀ goes to zero (note that
as the undersaturation increases, the energy barrier to nucleation
plotting the data in this form accentuates the plateau). This result
must decrease.
is qualitatively in agreement with quartz dissolution rates in pure When growth or dissolution occurs at a smooth face through 2D
H2O. There are two additional effects that need to be considered. nucleation, the normal growth or dissolution rate (Rn) of the face
First, at very small ⍀, step spacing becomes so close that the due to formation of 2D nuclei at a rate of J is expressed as (8, 18)
relationship in Eq. 4 is no longer valid because overlap in the
diffusion fields for adjacent steps weakens the dependence on ⍀
Downloaded by guest on November 9, 2021
兩Rn兩 ⫽ h2/3J1/3, [10]
(17). This effect accentuates the dissolution plateau by further
reducing the slope. The second effect becomes important as ⍀ where the steady-state nucleation rate, J, is given by (9)
Dove et al. PNAS 兩 October 25, 2005 兩 vol. 102 兩 no. 43 兩 15359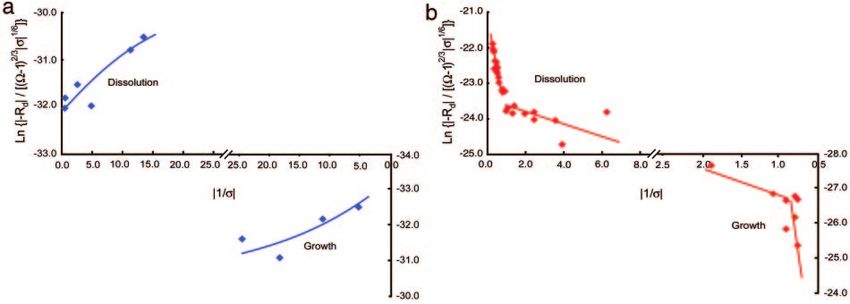
Although this expression is no longer linear in 1兾, it allows us to
make a direct comparison with Eq. 12a. The slopes of Eqs. 12a and
12b yield the step edge free energy, ␣, that corresponds to disso-
lution or growth by nucleation and dislocation processes, respec-
tively. However, these energies are not those of the perfect crystal
surface. Rather they are associated with the region of the crystal in
the vicinity of the dislocation and兾or impurity. Consequently, they
are expected to be far less than that of the perfect crystal surface.
Applying Eq. 12a to the dissolution rate measurements collected
in CaCl2 and NaCl solutions results in two linear trends (Fig. 3 b and
c). A similar result also was documented for the dependence of
growth on supersaturation in both inorganic and macromolecular
systems (9, 19, 20). The region of steep slope found for growth at
far-from-equilibrium conditions was postulated to correspond to
the homogenous nucleation of adatom islands, whereas the region
of shallow slope corresponds to islands nucleated at defects such as
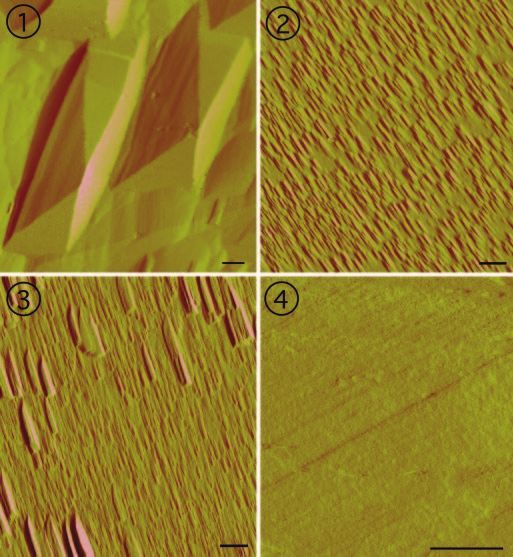
impurity atoms (9, 19, 20). Images ② and ③ in Fig. 2 confirm that
dissolution features show the analogous nucleation of vacancy
islands, and comparison with image ① in Fig. 2 shows that these
structures contrast sharply with those produced in the absence of
electrolytes; instead of exhibiting large, widely spaced, pointed-
bottom pits, the (100) surfaces treated with solutions at ⍀ ⫽ 0.1 that
also contained CaCl2 display a very high density of small etch pits
with typical sizes of 250 ⫻ 600 nm.
On surfaces etched under conditions corresponding to the region
of steeper slope in Fig. 3b, the small, uniform size and distribution
of pits across the surface indicate that they are the result of
homogeneous 2D nucleation of vacancy islands (Fig. 2, ②). As such,
Fig. 2. AFM images of representative (100) surfaces of quartz exposed to
they are continuously regenerated as the surface retreats. Com-
four different solution chemistries for equivalent extents of reaction show the
different dissolution processes across driving force and solution chemistry.
parisons of images ① and ② in Fig. 2 show that the physical basis
(Scale bar: 1 m in all images.) ➀ When ⍀ ⫽ 0.10 in H2O, surfaces are for the salt effect arises through a transition from dissolution
dominated by large etch pits with sloping sides that converge at dislocation controlled by the population of dislocation defects to 2D nucleation
sources. Pits are separated by relatively flat regions on the surface. ➁ For of vacancy islands. As shown in Eqs. 11 and 12a, the data do not
conditions where ⍀ ⫽ 0.10 and the solution contains 0.0167 M CaCl2, the allow us to determine whether the source of this transition is from
surface is covered with a high density of small pits with flat bottoms and with a reduction in the step edge free energy associated with the free
flanks that are 25% steeper than those measured for pits in ➀. ➂ At the energy barrier to stabilizing a pit or a reduction in the kinetic
intermediate driving force of ⍀ ⫽ 0.65 in a salt solution of 0.0167 M CaCl2, a barrier, Eb, to removing atoms from the surface to initiate a pit,
mixture of larger and smaller flat bottom pits form across the surface. ➃ At a
which manifests itself in ns. Moreover, this physical model provides
low driving force of ⍀ ⫽ 0.90 in 0.0167 M CaCl2, the surface shows only
straight-edged steps with no evidence of pitting.
no information about the chemical source of either reduction. The
calculated free energy barriers to dissolution by the 2D process are
61 ⫾ 6 and 79 ⫾ 14 mJ兾m2 for NaCl and CaCl2 solutions,
J ⫽ 兩兩1/2nsahC e exp ⫺ 冉 冏 冏冊,
␣ 2 h 1
共kT兲 2
[11]
respectively (see Table 2, which is published as supporting infor-
mation on the PNAS web site).
The nucleation model also fits rates measured at the intermediate
where a is the lattice spacing and ns is the density of nucleation sites, driving force to exhibit a linear trend of lower slope (Fig. 3 b and
which in turn is proportional to exp(⫺Eb兾kT) where Eb is the c). This result corresponds to the growth regime in which Malkin
kinetic barrier to etch pit formation associated with removal of and others (9, 19, 20) postulated that nucleation occurred prefer-
atoms from the surface layer. Note that Eq. 11 shows that the entially at impurity defects. In this ‘‘defect-assisted’’ model, impu-
nucleation process takes over because of the strong exponential rities induce localized strain to give lower free energy barriers than
dependence of rate on saturation state in contrast to the weak for 2D nucleation at a perfect surface. This explanation for growth
dependence that comes from Eq. 4. By substituting Eqs. 4 and 11
is consistent with our dissolution data. The surface morphology, as
into Eq. 10, we rewrite Eq. 10 into a form that is linear in 1兾
seen in image ③ in Fig. 2 at ⍀ ⫽ 0.65, shows the dominance of
ln 冉 兩R n兩
共⍀ ⫺ 1兲 2/3兩 兩 1/6
⫽ 冊
ln共h  C e 共 2
hn s a兲 1/3
兲 ⫺
␣ 2 h 1
3共kT兲 2
. 冏 冏 widely spaced, larger etch pits (⬇400 ⫻ 1,300 nm) surrounded by
smaller etch pits. The former are the pits that nucleate at defect
sites. The latter are the homogenously nucleating pits that grow in
[12a] number until they completely dominate at high undersaturation
(Fig. 2, ②). Fitting rates measured in CaCl2 and NaCl solutions for
To derive an equivalent expression for dissolution at dislocations conditions of region ③ with Eq. 12a indeed leads to a linear
we rewrite Eq. 7 dependence and lower step edge energies. Our estimates of step
冉 冊
edge energy for the CaCl2 and NaCl solutions give values of 32 ⫾
兩R d兩 10 and 18 ⫾ 8 mJ兾m2, respectively, for region ③.
ln
共⍀ ⫺ 1兲 2/3兩 兩 1/6 To extract the step edge energy for dislocation sources, Eq. 12b
冉 冊 冉 冊
is fitted to the rate measurements obtained for solutions with ⍀ ⬍
⫽ ln
 C emh
P
⫹ ln 共⍀ ⫺ 1兲 1/3 冏 1 冏 1/6 0.85 in solutions without electrolytes (region ① of Fig. 1a). The fit
to the data (Fig. 3a) yields  values of ⬇1 ⫻ 10⫺6 cm兾s and ␣ ⫽
冉 冉 冊冏 冏冊
16.2 ⫾ 5 mJ䡠m⫺2. These estimates are specific to quartz at 200°C
Downloaded by guest on November 9, 2021
␣ 1 without electrolytes where the chemical potential conditions favor
⫺ ln 1 ⫹ 8 . [12b]
PkT dissolution at dislocation defects. As one expects from the theory,
15360 兩 www.pnas.org兾cgi兾doi兾10.1073兾pnas.0507777102 Dove et al.Fig. 3. Mechanistic models describe the dependence of dissolution rate on the driving force of undersaturation for measured rates of quartz and previously
reported rates of aluminosilicate dissolution. (a) Dislocation model (Eq. 12b) predicts the behavior of quartz dissolution rate in the absence of electrolytes. (b)
In contrast, dependence of quartz dissolution rate on undersaturation in 0.0167 M CaCl2 solutions is predicted by the nucleation model (Eq. 12a). (c) Again,
nucleation model fits quartz dissolution behavior in 0.05 M NaCl. (d) The lower temperature measurements of kaolinite dissolution rate at 80°C show a
dependence on driving force that is predicted by the dislocation model. (e) In contrast, the markedly different dependence of kaolinite dissolution rate on driving
force at 150°C is predicted by the nucleation model. The nucleation model describes data reported at acidic and circumneutral pH. ( f ) Reported rates of K-feldspar
dissolution measured at 150°C and pH 9 also exhibit a dependence on undersaturation that is predicted by the nucleation model.
this direct estimate of quartz step edge energy is quite low com- 3f ) through the same processes that govern quartz dissolution in salt
pared with the macroscopic interfacial free energy estimated as 120 solutions (compare Fig. 3 b and c). The evidence suggests that, for
mJ䡠m⫺2 for 25°C (21) and 280 mJ䡠m⫺2 at 300°C (15). More decreasing driving force, the dominant dissolution process for this
significantly, it is also substantially lower than that for nucleation of aluminosilicate also undergoes a transition from the homogeneous
vacancy islands either at homogenous or impurity sites. However, nucleation of vacancy islands to nucleation at impurity sites with
once these latter barriers are overcome, the measured rates are step edge energies of 30 ⫾ 4 and 8 ⫾ 4, respectively, for the
faster because the total number of pits, and therefore the total conditions of the experiments.
amount of step edge, or roughness, is far greater. We also find that nucleation theory reconciles the origin of
different dependencies of kaolinite dissolution rates on driving
Nucleation Theory also Explains Silicate Dissolution Kinetics. Our force. To conduct this analysis, we use published experimental
success in applying nucleation rate theory to quartz dissolution dissolution rates for kaolinite dissolution and growth measured at
leads us to test dissolution-rate data for silicate minerals. The 80°C and 150°C (6, 23). By fitting these two data sets to the
complex rate data reported for the major rock-forming silicate, nucleation rate model, we show that the 150°C data fit the rate
K-feldspar (22), appears to also obey nucleation rate theory (Fig. model for dissolution by 2D nucleation homogeneously and at
GEOLOGY
Fig. 4. Published kinetic data for kaolinite dissolution and growth give a test of the mechanistic models for both growth and dissolution. The theories predict
the distinct differences in the dependence of dissolution and growth rates on undersaturation and supersaturation, respectively, that are reported. (a) The
Downloaded by guest on November 9, 2021
dislocation model, Eq. 12b, describes the dependence of reaction rates of growth and dissolution on positive and negative driving force, respectively, at 80°C.
(b) Because of the exponential dependence of nucleation rate, J, on temperature, Eq. 11, a transition to dissolution and growth rates by surface nucleation
processes occurs to give rate behavior described by the 2D nucleation model, Eq. 12a.
Dove et al. PNAS 兩 October 25, 2005 兩 vol. 102 兩 no. 43 兩 15361impurity defects to give surface energies of 23 ⫾ 2 and 4 ⫾ 2 mJ兾m2 Broad Implications for Other Families of Crystalline Materials. Recent
at high and low driving force, respectively (Fig. 3e). In contrast, the observations reported in the literature suggest that the nucleation
rates measured at 80°C exhibit behavior predicted by the dislocation model presented in this work also may predict the dissolution rates
defect model (Fig. 3d). For this lower-temperature condition, we of the sparingly soluble salts. This finding hints at the possibility that
estimate ␣ ⫽ 2.6 ⫾ 0.4 mJ兾m2 and  ⫽ ⬇2 ⫻ 10⫺8 cm兾s. the mechanistic model also will predict the rapid dissolution or
Comparisons of these values show that the lower interfacial energy ‘‘demineralization’’ of biological materials under some conditions.
measured for the dislocation-driven dissolution is consistent with For example, brushite (CaHPO4䡠2H2O) demineralization results in
the theoretical model, but these differences alone do not account ‘‘polypit’’ formation on the surface (24, 25). Similarly, a study of
for the dramatic difference in behavior at these two temperatures. barite (BaSO4) dissolution at high ionic strength showed 2D
The true source of this difference is easy to understand from Eqs. nucleation features (26). More recently, nanoscale observations of
7 and 12a. Rd is weaker than linear in T, whereas Rn has an calcite (CaCO3) dissolution across driving force found that surfaces
exponential dependence. At low T, Rd dominates, but as T in- undergo the same transitions in ‘‘dissolution modes’’ that change
creases, Rn quickly becomes greater. We conclude, therefore, that from retreat of steps, to opening and dissolution on dislocation etch
these kaolinite data sets are not at all inconsistent; rather, they pits, to the formation of 2D and defect-assisted nuclei (27). Al-
exhibit a predictable thermally activated transition in the dominant though qualitative, the observations in these studies suggest that, as
dissolution mechanism. would be explained by the model, dissolution of sparingly soluble
Several insights to kinetic controls on mineral dissolution arise salts can be controlled by nucleation processes. This result is
from our analyses of these aluminosilicates. First, the silicate predicted with the mechanistic model because the relatively lower
minerals we tested are able to undergo dissolution by 2D nucleation energy barriers to dissolution of these salts would allow a transition
by 2D nucleation without the thermal activation required by the
at hydrothermal temperatures in pure solutions at moderate values
covalently bonded quartz and silicates.
of ⍀, whereas quartz requires the presence of salts and far-from-
The successes of classical growth theory in explaining the disso-
equilibrium conditions to induce dissolution by this process. This
lution kinetics of minerals with properties spanning the covalent to
difference can be understood from the lower value of ␣ for silicate
ionic chemistries suggest it may become possible to predict the
minerals, which allows dissolution by 2D nucleation without salts: dependence of dissolution and corrosion on undersaturation and
no further change in mechanism occurs when salts are added. This temperature for a large variety of minerals and crystalline materials.
finding explains why rates of silicate dissolution are not enhanced However, a number of questions are still unanswered. First, during
(4) when electrolytes are introduced. Second, the three mineral dissolution, step splitting and retreat from crystal edges leads to the
systems that we tested indicate that 2D nucleation dominates rates rounding of facet edges, but it is unclear what the contribution of
measured at higher temperatures of 150–200°C. In contrast, the this process is to the overall dissolution rate. Given sufficient time,
80°C data for kaolinite is predicted by the dislocation defect model. it seems that these steps must retreat across the full diameter of a
This sharp temperature-dependent change in mechanism suggests crystallite, but no evidence for these steps is seen in Fig. 2. Second,
that the practice of extrapolating high temperature data to the the step density and step speed will always determine the dissolu-
ambient temperatures of earth surface environments may greatly tion rate. Yet comparison of step densities for dislocation pits and
overpredict rates of dissolution under circumstances where the etch pits in images ① and ② of Fig. 2, respectively, does not show
extrapolation comes from rates driven by 2D nucleation. The lesson an increase of the magnitude expected from the rate measurements.
from this analysis is that one needs to know the boundaries between Moreover, the flat areas between dissolution pits in both cases show
the various dissolution regimes before extrapolating measured that, even at steady state, step retreat near the top of the pits must
kinetics to different temperatures. Third, we show that pH, which exceed that within the pits (28). Finally, although the model can be
has a strong control on silicate dissolution rate, does not alter this used to predict the dependence of rates on saturation state and
behavior. Data reported for kaolinite at both pH 2 and 7.8 show that temperature, without independent knowledge of materials param-
temperature drives the dependence of rate on saturation state. eters such as ␣, it cannot predict absolute dissolution rates. More-
Finally, we test the ability of the general forms of this theory given over these parameters are likely to be largely unknown in natural
by Eqs. 12a and 12b to predict the dependence of kaolinite systems. Consequently, despite the unifying and intuitive view of
dissolution and growth on saturation state and temperature. By growth and dissolution provided by this model, there is much to be
using reported rates for kaolinite at 80°C (6), Fig. 4a shows that done to develop and test its concepts.
dissolution and growth obey Eq. 12b. However, rates of growth and
dissolution at 150°C (23) appear to be dominated by 2D and We thank Alex Chernov, Frank Richter, and Bruce Watson for insightful
impurity-assisted nucleation processes at large and small excursions comments and reviews of this manuscript. The study was supported by
Department of Energy Grant EMSP-FG07-01ER05123, and also gained
from equilibrium, respectively (Fig. 4b), according to Eq. 12a.
important insights from projects supported by National Science Foundation
Application of these relations again shows that, although the values Grants NSF-EAR-9903349 and OCE-0083173 and Department of Energy
of the material-dependent parameters ␣, , and Eb will differ, the Grant FG02-00ER15112 (to P.M.D.). This work was performed under the
surface processes that hold for growth are directly analogous to auspices of U.S. Department of Energy by the University of California,
those active during dissolution. Lawrence Livermore National Laboratory, under Contract W-7405-Eng-48.
1. Diénert, F. & Wandenbulcke, F. (1923) Comptes Renus Séances de l’Academic des Sciences 176, 14. Cabrera, N. & Levine, M. M. (1956) Philos. Mag. 1, 450–458.
1478–1480. 15. Brantley, S. L., Crane, S. R., Crerar, D. A., Hellmann, R. & Stallard, R. (1986) in Geochemical
2. Van Lier, J. A., de Bruyn, P. L. & Overbeek, G. T. G. (1960) J. Phys. Chem. 64, 1675–1682. Process at Mineral Surfaces, ACS Symposium Series, eds. Davis, J. A. & Hayes, K. F. (American
3. Dove, P. M. & Crerar, D. A. (1990) Geochim. Cosmochim. Acta 54, 955–969. Chemical Society, Washington, DC), Vol. 323, pp. 635–649.
4. Stillings, L. L. & Brantley, S. L. (1995) Geochim. Cosmochim. Acta 59, 1483–1496. 16. Lasaga, A. C. & Blum, A. E. (1986) Geochim. Cosmochim. Acta 50, 2363–2379.
5. Lasaga, A. C. (1998) in Kinetic Theory in the Earth Sciences, ed. Holland, H. D. (Princeton Univ. 17. Vekilov, P. G., Kuznetsov, Y. G. & Chernov, A. A. (1992) J. Crystal Growth 121, 643–655.
Press, Princeton). 18. Sangwal, K. (1987) in Etching of Crystals, Theory, Experiment, and Application, eds. Amelinckx,
6. Nagy, K. L., Blum, A. E. & Lasaga, A. C. (1991) Am. J. Sci. 291, 649–686. S. & Nihoul, J. (North–Holland, New York), pp. 43–86, 302–342.
7. Rimstidt, J. D. & Barnes, H. L. (1980) Geochim. Cosmochim. Acta 44, 1683–1699. 19. Malkin, A. I., Kuznetsov, Y. G., Glantz, W. & McPherson, A. (1996) J. Phys. Chem. 100, 11736–11743.
8. Chernov, A. A. (1984) in Modern Crystallography III, Springer Series in Solid-State Sciences, eds. 20. Malkin, A. I., Kuznetsov, Y. G. & McPherson, A. (1999) J. Crystal Growth 196, 471–488.
Cardona, M., Fulde, P. & Queisser, H. J. (Springer, New York), Vol. 36, pp. 48–158. 21. Rimstidt, J. D. & Cole, D. R. (1983) Am, J. Sci. 283, 861–875.
9. Malkin, A. I., Chernov, A. A. & Alexeev, I. V. (1989) J. Crystal Growth 97, 765–769. 22. Gautier, J. M., Oelkers, E. H. & Schott, J. (1994) Geochim. Cosmochim. Acta 58, 4549–4960.
10. Nagy, K. L. & Lasaga, A. C. (1992) Geochim. Cosmochim. Acta 56, 3093–3111. 23. Devidal, J. L., Schott, J. & Dandurand, J. L. (1997) Geochim. Cosmochim. Acta 61, 5165–5186.
11. Smol’skii, I. L., Malkin, A. I. & Chernov, A. A. (1986) Sov. Phys. Crystallogr. 31, 454–457. 24. Tang, R. & Nancollas, G. H. (2002) Pure Appl. Chem. 74, 1851–1857.
Downloaded by guest on November 9, 2021
12. De Yoreo J. J. & Vekilov P. G. (2003) in Biomineralization: Reviews in Mineralogy and 25. Tang, R., Orme, C. A. & Nancollas, G. H. (2003) J. Phys. Chem. B 107, 10653–10657.
Geochemistry, eds. Dove, P. M., De Yore, J. J. & Weiner, S. (Mineralogical Society of America 26. Risthaus, P., Bosbach, D., Becker, U. & Putnis, A. (2001) Colloids Surf. 191, 201–214.
Geochemical Society, Chantilly, VA), Vol. 54, pp. 57–93. 27. Teng, H. H. (2004) Geochim. Cosmochim. Acta 68, 253–262.
13. Cabrera, N., Levine, M. M. & Plaskett, J. S. (1954) Phys. Rev. 96, 1153. 28. Lasaga, A. C. & Lüttge, A. (2001) Science 291, 2400–2404.
15362 兩 www.pnas.org兾cgi兾doi兾10.1073兾pnas.0507777102 Dove et al.You can also read