Probabilistic risk assessment of solar particle events considering the cost of countermeasures to reduce the aviation radiation dose - Nature
←
→
Page content transcription
If your browser does not render page correctly, please read the page content below
www.nature.com/scientificreports
OPEN Probabilistic risk assessment
of solar particle events considering
the cost of countermeasures
to reduce the aviation radiation
dose
Moe Fujita1,4, Tatsuhiko Sato2, Susumu Saito3 & Yosuke Yamashiki4*
Cosmic-ray exposure to flight crews and passengers, which is called aviation radiation exposure,
is an important topic in radiological protection, particularly for solar energetic particles (SEP). We
therefore assessed the risks associated with the countermeasure costs to reduce SEP doses and dose
rates for eight flight routes during five ground level enhancements (GLE). A four-dimensional dose-
rate database developed by the Warning System for Aviation Exposure to Solar Energetic Particles,
WASAVIES, was employed in the SEP dose evaluation. As for the cost estimation, we considered two
countermeasures; one is the cancellation of the flight, and the other is the reduction of flight altitudes.
Then, we estimated the annual occurrence frequency of significant GLE events that would bring the
maximum flight route dose and dose rate over 1.0 mSv and 80 μSv/h, respectively, based on past
records of GLE as well as historically large events observed by the cosmogenic nuclide concentrations
in tree rings and ice cores. Our calculations suggest that GLE events of a magnitude sufficient to
exceed the above dose and dose rate thresholds, requiring a change in flight conditions, occur once
every 47 and 17 years, respectively, and their conservatively-estimated annual risks associated with
the countermeasure costs are up to around 1.5 thousand USD in the cases of daily-operated long-
distance flights.
Cosmic-ray exposure is an important topic for aviation workers, such as cabin attendants and pilots in most
flight companies. In principle, the higher the altitude and latitude of the plane, the higher the dose rate of radia-
tion when flying. Therefore, the International Committee on Radiological Protection (ICRP) recognizes the
cosmic-ray exposure to aircrews as an occupational hazard1. In addition, ICRP provided an updated guidance on
radiological protection from aircrew exposure, considering the current ICRP system of radiological p rotection2.
In response to these publications, the International Civil Aviation Organization (ICAO) has recently decided to
use radiation dose as mandatory information requested from space weather information p roviders3.
Two primary cosmic-ray sources can contribute to aviation radiation exposure: galactic cosmic rays (GCR)
and solar energetic particles (SEP). The GCR fluxes are relatively stable and predictable compared to of SEP,
and their dose rates are always low—below 10 μSv/h at the conventional flight altitude of 12 km4. By contrast,
SEP fluxes suddenly increase when a large solar particle event (SPE) occurs, and their dose rates occasionally
become very high—more than 2 mSv/h5, though the duration of such high dose rate events are generally short.
Considering that ICRP recommends suppressing the dose to an embryo/fetus below that of about 1 mSv2, it is
desirable to take adequate actions such as reduction of the flight altitude during such large SPEs.
There are two major methods for detecting a SPE: one is based on high-energy proton detectors mounted
on Geostationary Operational Environmental Satellites (GOES), and the other is based on neutron monitors
on the Earth’s surface. The former can detect SEPs directly by measuring proton fluxes above 1 MeV, while the
latter detects SEPs indirectly by measuring secondary neutrons generated through nuclear interactions induced
1
Data Solution Group, Aioi Nissay Dowa Insurance Co., Ltd, Shibuya‑ku, Tokyo, Japan. 2Nuclear Science and
Engineering Center, Japan Atomic Energy Agency, Tokai, Japan. 3Electronic Navigation Research Institute,
National Institute of Maritime, Port and Aviation Technology, Tokyo, Japan. 4SIC Human Spaceology Center,
Graduate School of Advanced Integrated Studies in Human Survivability, Kyoto University, Kyoto, Japan. *email:
yamashiki.yosuke.3u@kyoto-u.ac.jp
Scientific Reports | (2021) 11:17091 | https://doi.org/10.1038/s41598-021-95235-9 1
Vol.:(0123456789)www.nature.com/scientificreports/
Distance Cost (1000 USD)
Fuel increase
Flight ID Departure Arrival (Mile) (km) Time (h) Fuel@12 km Fuel@9 km (@9 km–@12 km) Cancellation
LAX_LHR Los Angeles London 5488 8832 10.6 51 63 12 97
SYD_EZE Sydney Buenos Aires 7368 11,858 13.9 68 84 16 67
SFO_LHR San Francisco London 5399 8689 10.4 50 62 12 98
NRT_LHR Tokyo London 6009 9671 12.9 62 77 15 78
SYD_GIG Sydney Rio de Janeiro 8463 13,620 15.9 77 95 18 52
SYD_LIM Sydney Lima 8006 12,884 15.1 73 90 17 59
SYD_CPT Sydney Cape Town 6882 11,075 14.6 71 87 16 62
NRT_JFK Tokyo New York 6784 10,918 12.9 63 77 13 76
Table 1. Information on 8 selected flight routes and their fuel and cancellation costs.
by SEPs in the atmosphere. SPEs with a significant increase in neutron monitor count rates are rarely observed
in comparison to those with an increase in the GOES proton fluxes, because most SPEs do not emit high-energy
protons (E > 450 MeV) that can create neutrons reaching the Earth’s surface. These events are called ground-level
enhancement (GLE), and only 72 of them have been recorded over eight decades of observation. Using the GOES
and/or neutron monitor data, several systems have been developed to issue an alert to SEP exposure or provide
the information on SEP doses at flight a ltitudes6–11.
If an airline company takes actions to reduce aviation doses in response to an alert issued by these systems, it
is necessary to estimate its costs. A potential mitigation procedure is a reduction of flight altitude, and Matthiä
et al. discussed its economic i mpact12. However, the discussion was based on calculated aviation dose for a certain
flight condition, which was a transatlantic flight on December 13th, 2006 from Seattle to Cologne, during which
GLE 70 occurred. Yamashiki et al.13, also made a cost estimation of aviation radiation exposure for a short flight
distance (US domestic flight) using X-ray flux (W/m2) based on GOES satellite measurements as the index of
the magnitude of an SPE, but the spatial variation of the SEP dose rates were not considered in their estimation.
In order to generalize the cost and develop insurance for aviation radiation exposure, estimations of aviation
doses for various flight conditions are indispensable. The frequency of the occurrence of SPEs that require a
mitigation procedure must also be evaluated.
With these situations in mind, we calculated the maximum doses and dose rates due to SEP exposure for eight
flight routes with two cruise altitudes during five GLE events, by integrating the four-dimensional aviation doses
calculated by WASAVIES9,10 Based on the results, the annual occurrence frequency that the total doses exceed
1 mSv or the dose rates exceed 80 μSv/h were estimated by scaling the magnitude of the GLE using the event-
integrated intensity (EII) proposed by Asvestari14 or peak-event intensity (PEI) proposed in this study. Note that
80 μSv/h is the threshold dose rate that is classified as “severe” exposure in the Space Weather D-index15,16 and the
ICAO space weather advisory i nformation3. Then, the cancellation and extra fuel costs were estimated in order
to help to design an insurance system for airline companies to protect against elevated aviation radiation dose.
Materials and method
Estimation of flight route doses during GLE events. Four-dimensional (Three spatial dimensions
and one temporal dimension) dose rate data for 5 different GLE events (GLE60, 69–72) were prepared using
WASAVIES: WArning System for AVIation Exposure to Solar energetic particles. This can determine the avia-
tion dose during a GLE anywhere in the atmosphere in 5-min intervals using databases based on SEP transport
simulations from the Sun to the ground level of the Earth. In WASAVIES, it is assumed that the SEP fluence and
its temporal variation generated around the Sun can be simply expressed by a power function of energy and the
inverse Gaussian distribution of time, respectively. Then, the database of the SEP fluences at 1 astronomical unit
(AU) was prepared by solving the one-dimensional focused transport equation for 6 power indexes and 3 shape
parameters17. In addition to the power index and shape parameter, the total fluence and tilt angle of the SEP
incident to the Earth must be determined in order to characterize GLE, and their numerical values are evaluated
in real time using the GOES proton fluxes and the count rates of several neutron monitors on the ground. Note
that the evaluated parameters vary with time, and thus, the temporal variations of the GLE characteristics such
as hard and soft spectra of SEP at the increasing and decreasing phases of GLE, respectively, can be considered
in WASAVIES. For spatial resolution, the atmosphere was divided into 28 altitude layers, and the data for each
altitude was an average value at intervals of 15 degrees for longitude and 10 degrees for latitude. The intricated
latitude, longitude, and altitude dependences of the dose rates were reproduced by developing the databases of
SEP trajectories in the magnetosphere using the empirical geomagnetic field model T8918 and the airshower
simulation performed by the PHITS code19. The aviation doses due to GCR exposure can also be calculated in
the system, using the PARMA model4.
Eight long-distance and high-latitude flight routes were selected in this study for investigating aviation doses,
and they are summarized in Table 1. The information on each flight route and time are taken from the Japanese
Internet System for Calculation of Aviation Route Doses, J ISCARD20, which assumes that the aircraft flies on the
great circle routes at a constant cruise altitude (9 km or 12 km). The average speeds for each route are between 531
miles/h (855 km/h) and 467 miles/h (752 km/h), which was calculated considering the drag force during ascent
and descent as well as cruising with a stable speed at the altitude of 12 km. For the alternative cruise altitude of
Scientific Reports | (2021) 11:17091 | https://doi.org/10.1038/s41598-021-95235-9 2
Vol:.(1234567890)www.nature.com/scientificreports/
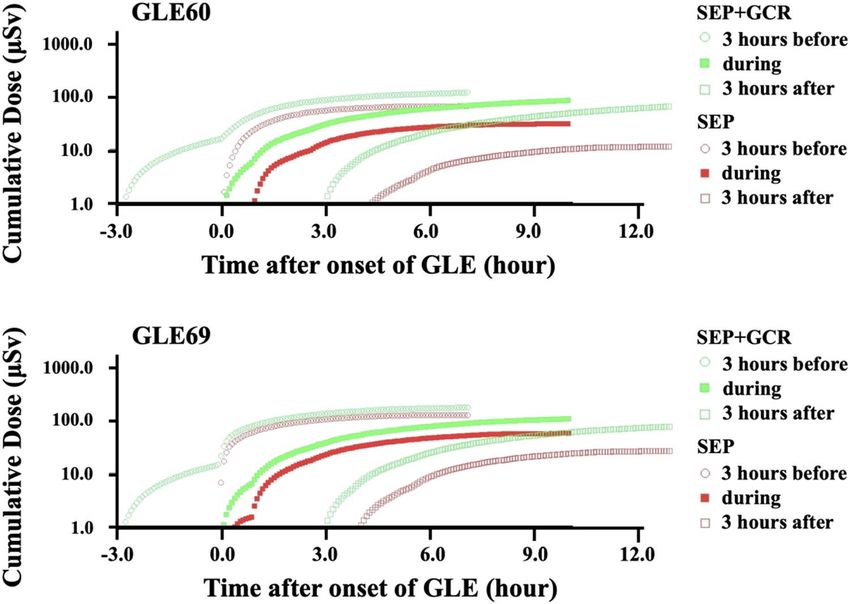
Figure 1. Calculated cumulative dose for flights from Los Angeles to London departing 3 h before, during, and
3 h after the onset of GLE 60 and 69, respectively. The cruise altitude was set to 12 km in this calculation.
9 km, we simply applied the same flight path and speed with 12 km in order to unify and simplify the discus-
sion along the flare time. This should be improved in further studies. Then, we calculated the dose rates on each
flight path at 5-min intervals based on the four-dimensional (latitude, longitude, altitude, and time) dose rate
data evaluated by WASAVIES. The total doses obtained for each flight were estimated by simply integrating the
calculated dose rates with respect to the entire flight duration. In this estimation, we made a series of hypothetical
timelines for the departure of each flight, setting before, during, and after the onset of each GLE event in order
to find the flight schedule to give the maximum total dose.
The fuel costs were estimated for a B747-400 with weight of 500,000 lbs (226,796 kg) at the altitudes of 9 and
12 km with the respective fuel consumption rate of 21,000 lbs (9525 kg)/h and 17,000 lbs (7711 kg)/h, respec-
tively found in literature21. They are shown in Table 1. Note that the price of fuel was set to 0.284 USD/lb (0.626
USD/kg) in this estimation. Cancellation costs were estimated based on the methodology and cost parameter
introduced by M arks22 based on statistics of airlines in the USA. The cancellation costs consist of three major
components. One is the base incremental cost which includes costs for crew, maintenance, and airport related
costs. Second is the net offset cost which become unnecessary, such as fuel that would have been burnt, landing
fees, and overflight fees. These are negative costs. Third is the commercial cost which is caused by ticket refunds
and displacement of revenue associated with rebooking of passengers. Accommodation cost for passengers were
not considered, because the SPE can be considered as an uncontrollable event for which airlines are not respon-
sible. The total cancellation costs are the sum of the cancellation costs of the particular flight and its subsequent
flight which will also be cancelled. We used the parameters shown by M arks22 for a long-haul international flight
with two-cabin-class configuration. The ticket prices are assumed to be on average the same for all the routes.
The fuel related parameters were replaced by those used for the fuel costs calculation at 9 and 12 km. The results
are shown in Table 1. It should be noted that the cost may be different for airlines operating in different regions.
Figure 1 shows the temporal changes in cumulative dose for the flight route of Los Angeles to London (LAX-
LHR) departing 3 h before, during, and 3 h after the onset of GLE 60 and 69, respectively. For the numerical
simulation, we evaluated in 5 min sequences for the duration of 24 h. Note that all doses calculated in this study
are the effective dose based on the definition of the 2007 recommendations of I CRP23. The green and red dots
represent the cumulative dose in μSv for a single flight path with different departure times, including and exclud-
ing the GCR dose component, respectively. In this case, a flight departing approximately 3 h before the onset of
GLE gives the maximum dose for both GLEs. This calculation has been accomplished for all flight routes, with
different GLEs under different flight altitudes.
Calculation of the annual frequency of GLE. For representing GLE magnitude, Asvestari et al.14 pro-
posed using EII, which is defined as the integral of the excess above the GCR background over the entire dura-
tion of the event. It corresponds to the total fluence of SEPs with energy sufficient to cause an atmospheric
cascade (several hundred MeV). The EII in the unit of %*h for 48 GLEs in the past 70 years were evaluated by
Asvestari et al.14, using GLE records of polar sea-level neutron monitors. Although the count rates of the neutron
monitors located only at the polar region were used in the determination of EII, it can be used as an index for
Scientific Reports | (2021) 11:17091 | https://doi.org/10.1038/s41598-021-95235-9 3
Vol.:(0123456789)www.nature.com/scientificreports/
0 0
10 10
(A) EII (B) PEI
Neutron monitor Neutron monitor
Fitting Fitting
−1 −1
10 10
FPEI(s)
FEII(s)
−2 −2
10 10
Miyake event
−3 AD 993/4 −3
10 AD 774/5
10
1 2 3 4 5 1 2 3 4 5
10 10 10 10 10 10 10 10 10 10
Threshold EII %*h Threshold PEI %
Figure 2. Annual frequency of the occurrence of GLE √ with (A) EII or (B)√PEI above certain threshold value
s. The error bars were simply estimated from FEII (s)/ NGLE and FPEI (s)/ NGLE , where NGLE is the overall
number of GLE contributing to the data.
representing the global increase of aviation dose level for the entire GLE period because the SEP doses hardly
increase at lower latitude regions.
On the other hand, the index for representing the highest SEP dose rate at a certain location in the world can
also be useful in considering insurance for aviation radiation exposure. We therefore introduced PEI, which is
the highest count rate (counts per minute) increase above GCR background count rate seen among all neutron
monitors except for the South Pole station. The reason for excluding the data from the South Pole is that the
altitude and latitude of the station are so high that the count rates cannot be directly compared with the data
for other stations. The numerical values of PEI for each GLE were obtained from the count rates of all available
neutron monitors provided on the Oulu station website (http://cosmicrays.oulu.fi/).
Then, we calculated the annual frequencies of the occurrence of GLE with EII or PEI above a certain thresh-
old value s, FEII(s) or FPEI(s), by counting the number of corresponding GLEs divided by 70. For example, 10
GLEs with EII above 92% × h were observed in the past 70 years, FEII(92) can be determined to be 0.143, i.e.
10/70. The calculated frequencies are shown in Fig. 2 as a function of the threshold EII or PEI. In the plots, we
excluded GLEs with EII or PEI values less than 10%*h or 10% because SPEs with such low EII or PEI might not
be detected as a GLE.
In addition, recent investigations on the cosmogenic nuclide concentrations in tree rings and ice cores have
revealed that extremely large SPEs with hard SEP spectra occurred in AD 774/5 and AD 993/424,25. The total
SEP fluences during these events were estimated to be 119–141 and 51–68 times higher than those during GLE
6926. We therefore assumed that the SPE having EII 59.5 and 130 times higher than that of GLE 69, 385%*h,
could occur twice and once per 2000 years respectively, and added the frequencies of FEII(22,908) = 0.001 and
FEII(50,050) = 0.0005 in Fig. 2. On the other hand, PEI of those historical events has not been investigated, and
they are not included in Fig. 2. It should be mentioned that those historical events might consist of multiple
SPEs. However, this fact does not result in the large uncertainties of the fitting described below because the
magnitude and frequency of each SPE become smaller and higher, respectively. For example, if 10 SPEs with
an equal magnitude would have occurred during those historical events, the corresponding frequencies would
be FEII(2290.8) = 0.01 and FEII(5005) = 0.005, which are still consistent with the fitting results shown in Fig. 2.
In this study, FEII(sEII) is assumed to follow the power-law function of sEII, as written by:
FEII (sEII ) = 10{AEII log10 (sEII )+BEII } , (1)
where AEII and BEII are the fitting parameters obtained from the scatter plot shown in Fig. 2 and their numerical
values are − 0.706 and 0.591, respectively. In a similar manner, FPEI(sPEI) can be calculated by
FPEI (sPEI ) = 10{APEI log10 (sPEI )+BPEI } . (2)
The numerical values of APEI and BPEI are evaluated to be − 0.604 and 0.425, respectively.
Then, the annual frequency that the maximum flight route dose exceeds the threshold dose, Dthre, for a cer-
tain flight route i estimated from
the jth GLE event can be calculated from Eq. (1) by substituting sEII,j Dthre /Di,j
into sEII, i.e. FEII sEII,j Dthre /Di,j , where sEII,j is the EII value for the jth GLE event and Di,j is the maximum
SEP dose for a flight route i during the jth GLE event. For example, if the maximum SEP dose for a certain
flight route i during the jth GLE event with EII = 1000%*h is 0.1 mSv, FEII for Dthre = 1.0 mSv is estimated to be
10(−0.706×log10(1000(1.0/0.1))+0.591) = 0.00584. In a similar manner, the annual frequency that the maximum flight route
dose rate exceeds the threshold
dose rate, Ḋthre can be calculated from Eq. (2) by substituting sPEI,j Ḋthre /Ḋi,j into
sPEI, i.e. FPEI sPEI,j Ḋthre /Ḋi,j , where Ḋi,j is the maximum SEP dose rate for flight route i during the jth GLE event.
Note that these threshold dose and dose rate do not include the contribution from GCR.
Scientific Reports | (2021) 11:17091 | https://doi.org/10.1038/s41598-021-95235-9 4
Vol:.(1234567890)www.nature.com/scientificreports/
Probabilistic risk estimation. In the risk estimation associated with aviation exposure due to SEPs, we
assumed two simple and fundamental solutions as countermeasures to reduce the SEP dose; one is the cancella-
tion of the flight when the maximum dose or dose rate exceeds Dthre or Ḋthre at the flight altitude of 9 km, and the
other is to lower the cruise altitudes from 12 to 9 km when the maximum dose or dose rate exceeds the threshold
level at 12 km but does not at 9 km. Here, we simply assume that cruising at altitudes lower than 9 km would
not be practical, because the aircraft may suffer from turbulence induced by upwelling flow more frequently
and from increased air drag due to exponentially increasing air density than flying at a higher altitude. A more
practical solution should be addressed in a future study, together with the potential countermeasures for en route
flights, such as routing to lower latitudes, temporarily lowering flight altitude, and emergency landing, which
should be assessed with a more realistic aircraft performance model and considerations from the viewpoint of
air traffic management27,28.
Based on this strategy, the annual risk associated with avoiding the maximum dose of Dthre for flight routes i
estimated from the jth GLE event, Ri,j(Dthre), was calculated as follows:
Ri,j (Dthre ) = FEII sEII,j Dthre /Di@12km,j − FEII sEII,j Dthre /Di@9km,j Ci@9km − Ci@12km
(3)
+ FEII sEII,j Dthre /Di@9km,j CiCancel ,
where Di@9km,j and Di@12km,j are the maximum SEP doses for flight route i at the cruise altitudes of 9 km and
12 km, respectively, Ci@9 km and Ci@12 km are the fuel costs of flight route i at the cruise altitudes of 9 km and 12 km,
respectively, and CiCancel is the cancellation cost given in Table 1. The first term represents the risk associated with
the extra fuel cost when a flight can be operated at an altitude of 9 km but not at 12 km, and the second term
represents the risk associated with the cancellation cost when a flight cannot be operated even at an altitude of
9 km. In the same manner, the annual risk associated
with avoiding the maximum dose rate of Ḋthre for flight
routes i estimated from the jth GLE event, Ri,j Ḋthre , was calculated as follows:
Ri,j Ḋthre = FPEI sPEI,j Ḋthre /Ḋi@12km,j − FPEI sPEI,j Ḋthre /Ḋi@9km,j Ci@9km − Ci@12km
(4)
+ FPEI sPEI,j Ḋthre /Ḋi@9km,j CiCancel,
where Ḋi@9km,j and Ḋi@12km,j are the maximum SEP dose rates for flight route i at the cruise altitudes of 9 km
and 12 km, respectively. We calculated the risk for Dthre = 1 mSv and Ḋthre = 80 μSv/h, which are the annual dose
limitation of public exposure in planned exposure situations recommended by ICRP and the threshold dose rate
that is classified as “severe” exposure in the Space Weather D-index, respectively.
It should be noted that Eqs. (3) and (4) give conservative estimates of the risks based on the maximum dose
or dose rates for each flight route, i.e., they intrinsically assume that the worst-case-scenario flight is always
scheduled when a GLE occurs. To reduce the conservativeness, we introduced the scaling factor for considering
the probability of scheduling the worst (or equivalent) scenario flight, which should complicatedly depend on
the flight route and frequency, as well as the temporal and spatial variations of the SEP dose rates. For simplicity,
we presume that the worst scenario always occurs when the GLE onset is during the cruise time of a flight in this
study, and approximate the scaling factor by the product of the number of annual scheduled flights per route
and cruise time per flight divided by the total time per year. For example, the scaling factor is determined from
the cruise time in hours divided by 24 in the case of daily-operated flight. Further analysis for more precisely
evaluating the scaling factor must be performed in the future.
Results and discussion
Table 2 shows the maximum doses and dose rates due to SEP exposure for eight selected flight routes at a 12 km
altitude during five GLE events, Di@12km,j and Ḋi@12km,j, respectively, estimated from the four-dimensional dose
rate data, which are characterized by the spectral power index, temporal shape parameter, total fluence, and tilt
angle of SEP incident to the Earth evaluated by WASAVIES. In general, the SEP dose and dose rates during GLE
69 are the largest among the five selected GLE events, particularly for the dose rate. This is because GLE 69 was
one of the largest and the most impulsive events that have occurred since they have been reliably recorded by
neutron monitors.
Table 3 shows the annual occurrence frequencies of the
maximum
SEP dose exceeding
1 mSv at the cruise
altitudes of 12 km and 9 km, i.e. FEII sEII,j Dthre /Di@12km,j and FEII sEII,j Dthre /Di@9km,j for Dthre = 1 mSv, esti-
mated from the calculated SEP doses given in Table 2 in combination with the regression line obtained from
EII as shown in Fig. 1. For example, the calculated maximum SEP dose for LAX_LHR at 12 km during GLE
60 (EII = 170%*h) is 0.0677 mSv, indicating that GLE with EII = 170/0.0677 = 2511%*h can give the SEP dose
of 1 mSv for the flight route. Then, the frequency of the occurrence of a GLE event with EII above 2511%*h is
estimated to be 10(−0.706*log10(2511)+0.591) = 0.0155 per year. The annual occurrence frequencies of the maximum
SEP dose rate exceeding
80 μSv/h at the cruise altitudes of 12 and 9 km, i.e. FPEI sPEI,j Ḋthre /Ḋi@12km,j and
FPEI sPEI,j Ḋthre /Ḋi@12km,j for Ḋthre = 80 μSv, are given in Table 4.
The tables showed that the frequencies deduced from the analysis of GLE69 are generally smaller than the
others because SPE with hard spectra such as GLE69 tend to give lower aviation radiation doses compared to
those with soft spectra at the same EII. However, the standard deviations of the frequencies are less than half
of the corresponding mean values, indicating that the GLE dependences of the calculated frequencies are not
too significant. This tendency suggests that the maximum SEP doses and dose rates for certain flight conditions
can be roughly represented by EII and PEI, respectively, instead of the large uncertainties between the count
Scientific Reports | (2021) 11:17091 | https://doi.org/10.1038/s41598-021-95235-9 5
Vol.:(0123456789)www.nature.com/scientificreports/
Flight ID LAX_LHR SYD_EZE SFO_LHR NRT_LHR SYD_GIG SYD_LIM SYD_CPT JFK_NRT
GLE60 EII = 170 (%*h), PEI = 149%, *Duration = 34 h
Dose @ 12 km (μSv) 67.7 42.2 68.3 48.6 56.1 12.5 43.2 45.6
Dose @ 9 km (μSv) 25.5 16.1 25.6 18.4 21.1 4.81 16.4 17.6
Dose rate @ 12 km (μSv/h) 36.7 21.2 36.7 33.1 31.7 8.22 24.7 27.6
Dose rate @ 9 km (μSv/h) 14.2 7.91 14.2 12.7 11.9 3.12 9.34 10.9
GLE69 EII = 385 (%*h), PEI = 2650%, *Duration = 36 h
Dose @ 12 km (μSv) 117 96.3 104 121 125 41.5 124 120
Dose @ 9 km (μSv) 41.9 35.4 37.6 44.6 45.8 16.0 45.3 43.9
Dose Rate @ 12 km (μSv/h) 200 241 200 273 241 54.6 127 148
Dose rate @ 9 km (μSv/h) 73.5 91.4 73.5 101 91.4 20.0 49.8 54.1
GLE70 EII = 62 (%*h), PEI = 92%, *Duration = 31 h
Dose @ 12 km (μSv) 21.2 33.6 21.8 31.1 35.3 10.6 39.0 32.6
Dose @ 9 km (μSv) 7.64 12.8 7.86 11.9 13.0 4.58 14.6 11.9
Dose rate @ 12 km (μSv/h) 8.40 26.1 7.51 18.1 26.1 9.65 27.2 21.1
Dose rate @ 9 km (μSv/h) 3.29 10.8 3.10 7.79 10.8 4.43 11.2 8.46
GLE71 EII = 10 (%*h), PEI = 16%, *Duration = 14 h
Dose @ 12 km (μSv) 3.75 5.77 4.41 5.00 5.63 2.04 6.76 5.74
Dose @ 9 km (μSv) 1.34 2.11 1.56 1.85 2.07 0.84 2.46 2.10
Dose rate @ 12 km (μSv/h) 1.90 5.03 3.67 4.24 5.03 2.08 5.03 4.78
Dose rate @ 9 km (μSv/h) 0.78 1.90 1.38 1.62 1.90 0.87 1.90 1.81
GLE72 EII = 9.5 (%*h), PEI = 16%, *Duration = 54 h
Dose @ 12 km (μSv) 10.9 9.60 12.1 10.7 13.0 1.54 12.9 12.5
Dose @ 9 km (μSv) 3.62 3.17 3.96 3.28 4.12 0.57 3.98 3.92
Dose rate @ 12 km (μSv/h) 3.27 2.80 3.43 2.42 2.94 1.06 2.40 3.46
Dose rate @ 9 km (μSv/h) 1.18 0.96 1.20 0.65 1.01 0.39 0.69 1.20
Table 2. Maximum doses (μSv) and dose rates (μSv/h) due to SEP exposure for eight selected flight routes at
12 km and 9 km altitude during five GLE events estimated from the four-dimensional dose rate data calculated
by WASAVIES. *Approximate duration with GOES proton (E > 100 MeV) flux over 1 (/cm2/sr/s).
12 km LAX_LHR SYD_EZE SFO_LHR NRT_LHR SYD_GIG SYD_LIM SYD_CPT JFK_NRT
GLE60 0.0155 0.0111 0.0156 0.0123 0.0136 0.0047 0.0113 0.0117
GLE69 0.0128 0.0112 0.0118 0.0131 0.0134 0.0062 0.0134 0.0130
GLE70 0.0139 0.0193 0.0142 0.0183 0.0200 0.0085 0.0214 0.0189
GLE71 0.0149 0.0202 0.0167 0.0182 0.0198 0.0097 0.0225 0.0201
GLE72 0.0327 0.0299 0.0353 0.0323 0.0371 0.0082 0.0369 0.0361
Mean 0.0180 0.0183 0.0187 0.0188 0.0208 0.0075 0.0211 0.0200
Std 0.0083 0.0078 0.0094 0.0080 0.0097 0.0020 0.0101 0.0097
9 km LAX_LHR SYD_EZE SFO_LHR NRT_LHR SYD_GIG SYD_LIM SYD_CPT JFK_NRT
GLE60 0.0078 0.0056 0.0078 0.0062 0.0068 0.0024 0.0057 0.0060
GLE69 0.0062 0.0055 0.0058 0.0065 0.0066 0.0031 0.0066 0.0064
GLE70 0.0068 0.0098 0.0069 0.0093 0.0099 0.0047 0.0107 0.0093
GLE71 0.0072 0.0099 0.0080 0.0090 0.0098 0.0052 0.0110 0.0099
GLE72 0.0150 0.0137 0.0160 0.0140 0.0165 0.0041 0.0161 0.0159
Mean 0.0086 0.0089 0.0089 0.0090 0.0099 0.0039 0.0100 0.0095
Std 0.0036 0.0034 0.0041 0.0031 0.0040 0.0011 0.0041 0.0040
Table 3. Annual occurrence frequencies of the maximum SEP dose exceeding 1 mSv at the cruise altitudes
of 12 km and 9 km for eight selected flight routes. The mean values and the standard deviation (Std) of the
frequencies obtained from the five selected GLE events are also summarized.
rates of the polar neutron monitors and the spectral index of SEP as discussed in Asvestari et al.14. Among the
eight selected flight routes, the largest mean frequencies are observed in the cases of SYD-CPT and SYD-GIG,
which are 0.0211 and 0.0575 at 12 km for the dose and dose rate regulations, respectively. These results suggest
that a GLE event that is strong enough to request a change in flight conditions occurs once per 47 and 17 years,
respectively.
Scientific Reports | (2021) 11:17091 | https://doi.org/10.1038/s41598-021-95235-9 6
Vol:.(1234567890)www.nature.com/scientificreports/
12 km LAX_LHR SYD_EZE SFO_LHR NRT_LHR SYD_GIG SYD_LIM SYD_CPT JFK_NRT
GLE60 0.0408 0.0293 0.0408 0.0384 0.0374 0.0165 0.0322 0.0344
GLE69 0.0440 0.0493 0.0440 0.0531 0.0493 0.0201 0.0335 0.0367
GLE70 0.0403 0.0800 0.0377 0.0641 0.0800 0.0439 0.0820 0.0703
GLE71 0.0521 0.0938 0.0775 0.0846 0.0938 0.0550 0.0938 0.0909
GLE72 0.0289 0.0263 0.0297 0.0241 0.0271 0.0146 0.0240 0.0299
Mean 0.0412 0.0557 0.0460 0.0529 0.0575 0.0300 0.0531 0.0524
Std 0.0083 0.0302 0.0184 0.0233 0.0284 0.0182 0.0323 0.0268
9 km LAX_LHR SYD_EZE SFO_LHR NRT_LHR SYD_GIG SYD_LIM SYD_CPT JFK_NRT
GLE60 0.0230 0.0162 0.0230 0.0215 0.0207 0.0092 0.0179 0.0196
GLE69 0.0240 0.0274 0.0240 0.0291 0.0274 0.0110 0.0190 0.0200
GLE70 0.0229 0.0469 0.0221 0.0385 0.0469 0.0274 0.0480 0.0405
GLE71 0.0304 0.0521 0.0429 0.0473 0.0521 0.0325 0.0521 0.0506
GLE72 0.0156 0.0138 0.0158 0.0109 0.0142 0.0080 0.0113 0.0158
Mean 0.0232 0.0313 0.0256 0.0295 0.0323 0.0176 0.0296 0.0293
Std 0.0053 0.0175 0.0102 0.0142 0.0165 0.0114 0.0189 0.0153
Table 4. Annual occurrence frequencies of the maximum SEP dose rate exceeding 80 μSv/h at the cruise
altitudes of 12 km and 9 km for eight selected flight routes. The mean values and the standard deviation of the
frequencies obtained from the five selected GLE events are also summarized.
LAX_LHR SYD_EZE SFO_LHR NRT_LHR SYD_GIG SYD_LIM SYD_CPT JFK_NRT
GLE60 0.37 0.25 0.36 0.29 0.29 0.11 0.25 0.27
GLE69 0.30 0.25 0.27 0.31 0.28 0.14 0.29 0.30
GLE70 0.33 0.44 0.32 0.44 0.42 0.20 0.47 0.43
GLE71 0.35 0.45 0.37 0.43 0.41 0.22 0.49 0.46
GLE72 0.74 0.63 0.75 0.69 0.73 0.18 0.74 0.75
Mean 0.42 0.40 0.41 0.43 0.43 0.17 0.45 0.44
Std 0.18 0.16 0.19 0.16 0.18 0.05 0.20 0.19
Table 5. Annual risks in the units of 1000 USD/year to avoid the maximum SEP dose exceeding 1 mSv for
eight selected flight routes calculated from Eq. (3) multiplied with the worst-case-scenario scaling factor for
daily-operated flight. The mean values and the standard deviation of the frequencies obtained from the five
selected GLE cases are also summarized.
LAX_LHR SYD_EZE SFO_LHR NRT_LHR SYD_GIG SYD_LIM SYD_CPT JFK_NRT
GLE60 1.08 0.75 1.07 1.04 0.91 0.42 0.81 0.91
GLE69 1.14 1.27 1.12 1.41 1.21 0.50 0.86 0.94
GLE70 1.07 2.13 1.02 1.82 2.01 1.19 2.14 1.88
GLE71 1.42 2.41 2.00 2.28 2.29 1.45 2.37 2.37
GLE72 0.74 0.65 0.74 0.56 0.64 0.37 0.55 0.75
Mean 1.09 1.44 1.19 1.42 1.41 0.79 1.35 1.37
Std 0.24 0.80 0.48 0.67 0.71 0.50 0.84 0.71
Table 6. Annual risks in the units of 1000 USD/year to avoid the maximum SEP dose rate exceeding 80 μSv/h
for eight selected flight routes calculated from Eq. (4) multiplied with the worst-case-scenario scaling factor
for daily-operated flight. The mean values and the standard deviation of the frequencies obtained from the five
selected GLE cases are also summarized.
Evaluating all individual results shown in Tables 3 and 4, the frequency of exceeding the threshold value
becomes higher when applied to the dose-rate criteria rather than the total dose criteria in most cases. Dose-rate
regulation limits the maximum dose rate even for a short duration aviation route, which increases the sensitivity
for risk, accordingly. Considering the fact that it is almost impractical to predict the total SEP dose during a GLE
event, regulation based on dose-rate may give us a chance of avoiding significant exposure, as no aviation path
reaches the threshold dose (1 mSv) among the five selected GLE cases and eight selected flight-routes.
Scientific Reports | (2021) 11:17091 | https://doi.org/10.1038/s41598-021-95235-9 7
Vol.:(0123456789)www.nature.com/scientificreports/
Tables 5 and 6 show the annual risks calculated from Eqs. (3) and (4) multiplied with the worst-case-scenario
scaling factor for daily-operated flight. The costs given in Table 1 and the frequencies shown in Tables 3 and 4
were used in the calculation. The mean values and the standard deviation of the risks obtained from the five
selected GLE cases are also summarized in the tables. It is found from these tables that the mean annual risks
estimated based on the dose and dose-rate regulations are less than 0.5 and 1.5 thousand USD, respectively, for
all flight routes. These risks are not significantly large in comparison to the other aviation risks such as a volcanic
eruption29. For example, many flights were cancelled when Eyjafjallajökull in Iceland erupted in 2010. During
this eruption, the economic impact on aviation was estimated to be 1.7 billion U SD30. Since the frequency of
31
Icelandic volcanic eruptions was estimated to be 44 ± 7 years , the annual risk of the Icelandic volcano eruption
on aviation was calculated to be 38.6 million USD. This value is 10,000 times higher than the annual GLE risk
for daily-operated long-distance flight obtained from this study.
Conclusions
The risk assessment for the cost of countermeasures to reduce the radiation doses and dose rates due to SEP
aviation exposure was performed in order to design an insurance product. In the assessment, the maximum
SEP doses and dose rates for eight flight routes with two cruise altitudes during five GLE cases were evaluated
by integrating the four-dimensional aviation dose rate data calculated by WASAVIES. Based on the results, the
frequency that the total doses exceed 1 mSv or the dose rates exceed 80 μSv/h were estimated by scaling the
magnitude of the GLE event using EII or PEI, respectively. Our calculations suggest that a GLE event of sufficient
magnitude to request a change in flight conditions occurs once per 47 and 17 years in the case of following the
dose and dose-rate regulations, respectively, and their conservatively-estimated annual risks associated with
countermeasure costs are up to around 1.5 thousand USD for daily-operated long-distance flights. However, these
results were derived from many simplifications such as constant flight speed and altitude during the cruise flight.
Thus, more comprehensive risk assessments considering realistic flight schedules and detailed cost estimations
must be conducted before an insurance system for aviation SEP exposure can be created.
Received: 12 March 2020; Accepted: 16 July 2021
References
1. International Commission on Radiological Protection. 1990 Recommendations of the International Commission on radiological
protection. Ann. ICRP 21, 1–3 (1991).
2. International Commission on Radiological Protection. Radiological protection from cosmic radiation in aviation. Ann. ICRP
45(1), 1–48. https://doi.org/10.1177/0146645316645449 (2016).
3. International Civil Aviation Organization. Manual on Space Weather Information in Support of International Air Navigation 1st
edn. (International Civil Aviation Organization, 2018).
4. Sato, T. Analytical model for estimating terrestrial cosmic ray fluxes nearly anytime and anywhere in the world: Extension of
PARMA/EXPACS. PLoS ONE 10, 0144679. https://doi.org/10.1371/journal.pone.0144679 (2015).
5. Matthiä, D. et al. Temporal and spatial evolution of the solar energetic particle event on 20 January 2005 and resulting radiation
doses in aviation. J. Geophys. Res. (Space Phys.) 114, A08104. https://doi.org/10.1029/2009JA014125 (2009).
6. Latocha, M., Beck, P. & Rollet, S. AVIDOS—A software package for European accredited aviation dosimetry. Radiat. Prot. Dosim.
136, 286–290. https://doi.org/10.1093/rpd/ncp126 (2009).
7. Mertens, C. J. et al. Geomagnetic influence on aircraft radiation exposure during a solar energetic particle event in October 2003.
Space Weather 8, S03006. https://doi.org/10.1029/2009SW000487 (2010).
8. Lantos, P., Fuller, N. & Bottollier, D. J. F. Methods for estimating radiation doses received by commercial aircrew. Aviat. Space
Environ. Med. 74, 746–752 (2003).
9. Kataoka, R. et al. Radiation dose nowcast for the ground level enhancement on 10–11 September 2017. Space Weather 16, 917–923.
https://doi.org/10.1029/2018SW001874 (2018).
10. Sato, T. et al. Real time and automatic analysis program for WASAVIES: Warning system for aviation exposure to solar energetic
particles. Space Weather 16, 924–936. https://doi.org/10.1029/2018SW001873 (2018).
11. Copeland, K. An Enhanced Solar Radiation Alert System, DOT/FAA/AM-16/5 (Office of Aerospace Medicine, 2016).
12. Matthiä, D., Schaefer, M. & Meier, M. M. Economic impact and effectiveness of radiation protection measures in aviation during
a ground level enhancement. J. Space Weather Space Clim. 5, A17. https://doi.org/10.1051/swsc/2015014 (2015).
13. Yamashiki, Y. A. et al. Cost estimation for alternative aviation plans against potential radiation exposure associated with solar
proton events for the Airline Industry. Evol. Inst. Econ. Rev. 17, 487–499. https://doi.org/10.1007/s40844-020-00163-4 (2020).
14. Asvestari, E. et al. Analysis of ground level enhancements (GLE): Extreme solar energetic particle events have hard spectra. Adv.
Space Res. 60, 781–787. https://doi.org/10.1016/j.asr.2016.08.043 (2017).
15. Meier, M. M. & Matthiä, D. Classification and communication of aviation related space weather radiation events. J. Aviat. Aeronaut.
Sci. 1(1), 1002 (2018).
16. Matthiä, D. & Meier, M. M. A space weather index for the radiation field at aviation altitudes. J. Space Weather Space Clim. 4, A13.
https://doi.org/10.1051/swsc/2014010 (2014).
17. Kubo, Y., Kataoka, R. & Sato, T. Interplanetary particle transport simulation for warning system for aviation exposure to solar
energetic particles. Earth Planets Space. https://doi.org/10.1186/S40623-015-0260-9 (2015).
18. Tsyganenko, N. A. A magnetospheric magnetic field model with a warped tail current sheet. Planet. Space Sci. 37(1), 5–20. https://
doi.org/10.1016/0032-0633(89)90066-4 (1989).
19. Sato, T. et al. Features of particle and heavy ion transport code system (PHITS) version 3.02. J. Nucl. Sci. Technol. 55(6), 684–690.
https://doi.org/10.1080/00223131.2017.1419890 (2018).
20. Yasuda, H. et al. Management of cosmic radiation exposure for aircraft crew in Japan. Radiat. Prot. Dosim. 146, 123–125. https://
doi.org/10.1093/rpd/ncr133 (2011).
21. Hagiwara, H., Suzuki, R. & Ikuta, Y. A study on the optimization of aircraft route. J. Jpn. Inst. Navigat. 91, 141–152. https://doi.
org/10.9749/jin.91.141 (1994).
22. Marks, J. Updating Airline Cancellation Costs and Customer Disruption, AGIFORS Annual Symposium (2014). https://airinsight.
com/wp-content/uploads/2014/10/Updating-airline-cancellation-costs-and-customer-disruption.pdf. Accessed on March 10,
2020.
Scientific Reports | (2021) 11:17091 | https://doi.org/10.1038/s41598-021-95235-9 8
Vol:.(1234567890)www.nature.com/scientificreports/
23. International Commission on Radiological Protection. The 2007 Recommendations of the International Commission on radiologi-
cal protection. Ann. ICRP 37, 2–4 (2007).
24. Miyake, F., Nagaya, K., Masuda, K. & Nakamura, T. A signature of cosmic-ray increase in AD 774–775 from tree rings in Japan.
Nature 486, 240–242. https://doi.org/10.1038/nature11123 (2012).
25. Miyake, F. et al. Cosmic ray event of A.D. 774–775 shown in quasi-annual 10Be data from the Antarctic Dome Fuji ice core. Geophys.
Res. Lett. 42, 84–89. https://doi.org/10.1002/2014GL062218 (2014).
26. Mekhaldi, F. et al. Multiradionuclide evidence for the solar origin of the cosmic-ray events of AD 774/5 and 993/4. Nat. Commun.
6, 8611. https://doi.org/10.1038/ncomms9611 (2015).
27. Mattiä, D. et al. Economic impact and effectiveness of radiation protection measures in aviation during a ground. J. Space Weather
Space Clim. 5, A17. https://doi.org/10.1051/swsc/2015014 (2015).
28. Saito, S. et al. Estimate of economic impact of atmospheric radiation storm associated with solar energetic particle events on aircraft
operations. Earth Planets Space 73, 57. https://doi.org/10.1186/s40623-021-01377-5 (2021).
29. Mazzocchi, M., Hansstein, F. & Ragona, M. The 2010 volcanic ash cloud and its financial impact on the European Airline Industry.
CESifo Forum 11, 92–100 (2010).
30. International Air Transport Association. The Impact of Eyjafjallajokull’s Volcanic Ash Plume, IATA Economic Briefing (2010). https://
www.iata.org/en/iata-repository/publications/economic-reports/impact-of-ash-plume/. Accessed on March 10, 2020.
31. Watson, E. J. et al. Estimating the frequency of volcanic ash clouds over northern Europe. Earth Planet. Sci. Lett. 460, 41–49. https://
doi.org/10.1016/j.epsl.2016.11.054 (2017).
Acknowledgements
The authors thank the Sodankyla Geophysical Observatory of the University of Oulu for providing neutron
monitor data. The authors would like to thank Dr. Kazuaki Yajima for providing the flight route data calculated
by JISCARD. The authors are also grateful to Ms. Cassandra Ling for her contribution in grammar correction.
The authors are also grateful to Ms. Emika Fujii for her contribution in the revision.
Author contributions
M.F., T.S. and Y.A.Y. wrote the main components of the article. Y.A.Y. design the analytical evaluation model
for all aviation doses, T.S. provided the results of WASAVIES for detailed estimation of the aviation doses. S.S
provided estimated aircraft operation costs and provided discussion on it, and M.F. analyzed the results and
evaluated the frequency of the GLE events and estimated the cost.
Funding
JSPS Grant KAKENHI (15H05813), Japan Manned Space Systems Corporation.
Competing interests
The authors declare no competing interests.
Additional information
Correspondence and requests for materials should be addressed to Y.Y.
Reprints and permissions information is available at www.nature.com/reprints.
Publisher’s note Springer Nature remains neutral with regard to jurisdictional claims in published maps and
institutional affiliations.
Open Access This article is licensed under a Creative Commons Attribution 4.0 International
License, which permits use, sharing, adaptation, distribution and reproduction in any medium or
format, as long as you give appropriate credit to the original author(s) and the source, provide a link to the
Creative Commons licence, and indicate if changes were made. The images or other third party material in this
article are included in the article’s Creative Commons licence, unless indicated otherwise in a credit line to the
material. If material is not included in the article’s Creative Commons licence and your intended use is not
permitted by statutory regulation or exceeds the permitted use, you will need to obtain permission directly from
the copyright holder. To view a copy of this licence, visit http://creativecommons.org/licenses/by/4.0/.
© The Author(s) 2021
Scientific Reports | (2021) 11:17091 | https://doi.org/10.1038/s41598-021-95235-9 9
Vol.:(0123456789)You can also read