Biased monitoring data and an info-gap model for regulating the offtake of greylag geese in Europe
←
→
Page content transcription
If your browser does not render page correctly, please read the page content below
Wildlife Biology 2021: wlb.00803
                                                                                                             doi: 10.2981/wlb.00803
                                                                                 © 2021 The Authors. This is an Open Access article
                                         Subject Editor: Matthieu Guillemain. Editor-in-Chief: Ilse Storch. Accepted 3 February 2021

Biased monitoring data and an info-gap model for regulating the
offtake of greylag geese in Europe

Fred A. Johnson and Kees Koffijberg
F. A. Johnson (https://orcid.org/0000-0002-5854-3695) ✉ (fred.johnson@bios.au.dk), Aarhus Univ., Dept of Bioscience – Kalø, Rønde,
Denmark. – K. Koffijberg (https://orcid.org/0000-0003-0146-2269), Savon, Dutch Centre for Field Ornithology, Nijmegen, the Netherlands.

       The problem we address is motivated by the desire to regulate the size of the NW/SW European population of greylag
       geese Anser anser to meet a number of management objectives, including providing sustainable harvests and minimizing
       agricultural impacts and conflicts. Using simple models of population dynamics along with observed allometric relation-
       ships in birds, we have concluded that reported estimates of greylag goose population size and/or offtake at the flyway level
       are likely biased, perhaps severely so. Recognizing that resources are limited, we suggest that the most pressing need may be
       to investigate and strengthen monitoring protocols for offtake. We also describe a simple information-gap (‘info-gap’) deci-
       sion model that could allow decision makers to make informed choices about changes in offtake until such time that more
       reliable monitoring information is available for greylag geese. With the info-gap decision model we were compelled to use a
       management criterion based on the growth rate of the flyway-wide population because true levels of abundance and offtake
       are unknown. Moreover, we emphasize that in the face of deep uncertainty about greylag goose abundance and offtake,
       decisions concerning management of the population carry a high risk of failing to meet conservation objectives, whatever
       they may be. While the info-gap analysis suggests an increase of offtake beyond the nominal level of 450 000 reported in
       the International Single Species Management Plan may be necessary to stabilize the population, we do not know the cur-
       rent level of offtake (i.e. whether it has recently changed from that last reported). Moreover, recent counts conducted by the
       range states and the International Waterbird Census suggest that the winter flyway population may no longer be increasing.
       For these reasons, management implications of the info-gap analysis must be viewed with caution.

       Keywords: allometric methods, bias, greylag goose, info-gap decision model, monitoring, offtake, population growth,
       reproduction, survival

Like many arctic and subarctic breeding geese, the NW/                  other human activities (Buij et al. 2017). In 2018, the Euro-
SW European population of greylag geese Anser anser grew                pean Goose Management Platform (EGMP; ) developed a flyway management plan, which
ing almost eight-fold from about 125 000 individuals in                 was approved by the meeting of the parties of the African–
the 1980s to 960 000 in the late 2000s (Madsen 1991, Fox                Eurasian Waterbird Agreement (AEWA) in 2019. The plan’s
and Leafloor 2018). The principal range of this population              goal is to regulate the size of the flyway population to meet a
includes Norway, Sweden, Finland, Denmark, Germany,                     number of management objectives, including providing sus-
Netherlands, Belgium, France and Spain (hereafter collec-               tainable harvests and minimizing agricultural damage and
tively referred to as Range States) (Powolny et al. 2018).              conflicts, while maintaining the population in a favorable
Geese from this population are also thought to occur regu-              conservation status (Powolny et al. 2018). Our research was
larly in Poland, the Czech Republic, Hungary and Portu-                 thus motivated by the need to determine allowable levels of
gal but, as numbers there constitute less than 1% of overall            offtake of greylag geese, including both sport harvest and
numbers, they are not included here. Although greylag geese             culling. Culling is often referred to as ‘derogations’ under
provide important cultural and provisioning services, their             Article 9 of the EU Birds Directive, which applies to coun-
numbers have increasingly brought them into conflict with               tries that do not have an open hunting season or to coun-
                                                                        tries where culling occurs outside the regular hunting season
This work is licensed under the terms of a Creative Commons
                                                                        (. The license permits                  Science-based population management requires at a min-
use, distribution and reproduction in any medium, provided the          imum reliable estimates of population size and offtake. The
original work is properly cited.                                        International Single Species Management Plan (ISSMP) for

                                                                                                                                        1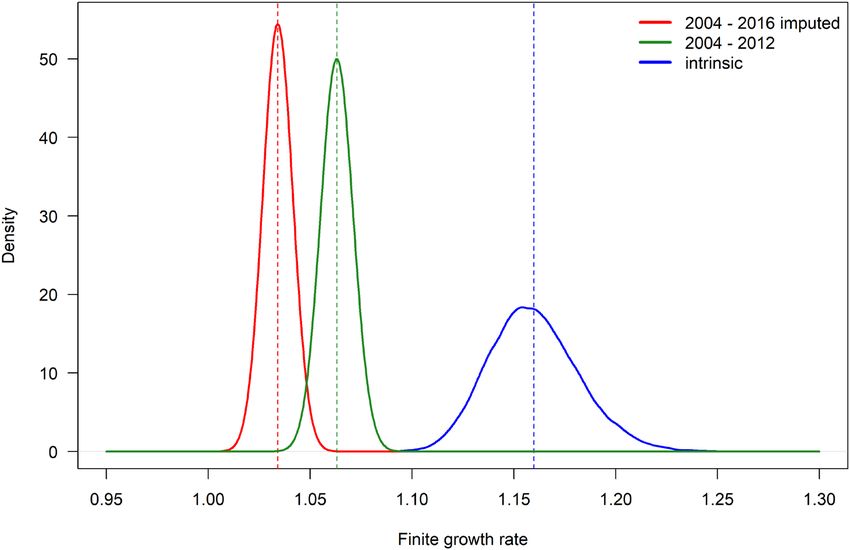
the NW/SW population of greylag geese provides estimates where p is the observed proportion of the population alive at
of abundance of 900 000–1 200 000 individuals in mid- the observed maximum lifespan with p ~ beta(3.34,101.24),
winter and an annual offtake of about 450 000 individuals M is body mass in kg, α is age at first breeding and e is the
during the mid-2010s (Powolny et al. 2018). One or both error in the model relating body mass to longevity with e ~
estimates appear to be biased, given that such a high rate of Normal(0,σ2 = 0.087). The distribution of p is constant, and
take is unlikely to be compatible with observed increases is unrelated to body mass (Johnson et al. 2012).
in abundance. The potential presence of bias in estimates Using both female and male mean body masses of 3.108
of abundance and/or offtake make informed decisions con- kg (SD = 0.274) and 3.509 (SD = 0.321), respectively
cerning the attainment of management objectives in the (Dunning Jr. 2008), and an age at first breeding of α = 3
ISSMP of this goose population challenging at best. (Nilsson et al. 1997, Kampp and Preuss 2005), the median
Recognizing that decision makers often cannot delay (intrinsic) survival is θ = 0.889 and the 95% confidence
decisions until better data are available, we describe a sim- interval is 0.785–0.943. This represents a maximum longev-
ple information-gap decision model (Ben-Haim 2001) that ity of about 30 years, which agrees well with that of birds in
could allow decision makers to make informed choices about captivity (Nigrelli 1954). We note that the use of an age at
changes in the level of offtake until such time that more reli- first breeding of 2 < α ≤ 3 (i.e. some portion of 2-year-olds
able monitoring information is available for greylag geese. breed; Nilsson and Kampe-Persson 2018) causes only minor
Information gap decision theory (‘info-gap’) is designed differences in the value of θ.
for cases of ‘deep’ uncertainty – those in which a stochastic Next, we used the values of θ = 0.889(0.785–0.943) and
(probabilistic) structure for uncertain consequences is either α = 3 along with Eq. 15 from Niel and Lebreton (2005) to
unreliable or unavailable (Ben-Haim 2001, Regan et al. estimate the intrinsic population growth rate as:
2005, van der Burg and Tyre 2011). It is similar to the con-
cept of maxi–min (Polasky et al. 2011), in which a preferred
management action is the one which maximizes the mini- ( qa - q + a + 1) + ( q - qa - a - 1)2 - 4qa2 (2)
l» » 1.159 (1.120 - 1.206 )
2a
mum level of management performance over all uncertain
outcomes. Info-gap decision analyses poses a slightly differ- The median is similar to empirical values for snow geese Chen
ent question: ‘which action is most likely to satisfy a specified caerulescens and barnacle geese Branta leucopsis provided by
management criterion for the largest range of uncertainty?’ Niel and Lebreton (2005).
In the following sections, we first provide evidence for We next estimated the realized mean growth rate, l ,
bias in reported estimates of abundance and/or offtake of using a log-linear regression model of a temporal sequence
greylag geese. We then describe a simple info-gap decision of greylag goose counts in midwinter, Nw:
model that could allow decision makers to make informed
choices about levels of offtake based on monitoring data
currently available. We also provide a quantitative measure N tw = N 0w lt (3)
of the risk of not meeting a management criterion so that
decision makers can account for their risk attitude. Finally,
we discuss improvements to monitoring that are needed
to manage greylag geese in accordance with the objectives ( ) ( )
log N tw = log N 0w + log ( l ) ´ t
expressed in the ISSMP.
log ( N ) = b + b t + e
t
w
0 1 t
Material and methods
et Normal ( 0, s )
A paucity of demographic data for greylag geese makes it
difficult to test the veracity of reported estimates of abun- The expectation of the intrinsic population growth
dance and offtake. Here we describe the use of established rate arising from the log-normal distribution is thus:
allometric relationships in birds, along with simple models æ s2 ö
of population dynamics, to help determine whether reported l = exp ç b1 + ÷ . For the period (2004–2012) in which
estimates of abundance and offtake in the ISSMP are reliable. è 2 ø
national midwinter counts are available from all Range
Intrinsic and realized growth rates of the greylag States (Heldbjerg et al. 2020), the estimated mean growth
goose population rate was l = 1.063 (1.048 - 1.079 ) (Fig. 1). Note that this
analysis assumes that whatever the bias in national counts
We used the allometric methods of Niel and Lebreton may be, it is relatively constant over the period 2004–2012.
(2005) and Johnson et al. (2012) to estimate the intrinsic We note, however, that the rate of population growth
population growth rate (i.e. no density dependence and may have decreased since 2012. National counts are avail-
no anthropogenic mortality) of greylag geese. From John- able from all Range States from 2004 to 2016 (i.e. four addi-
son et al. (2012), adult survival under ideal conditions for tional years) except Spain (outside Doñana) and Germany.
birds ranging in mass from 12 g to 8.66 kg is estimated as: If we use the observed growth rates in those two countries
during 2004–2012 to extrapolate their respective counts
1 through 2016, the growth rate of the flyway population was
( exp(3.22 + 0.24 log ( M )+ e )- a ) l = 1.038 (1.026 - 1.051) during 2004–2016. Counts of
q= p (1)
2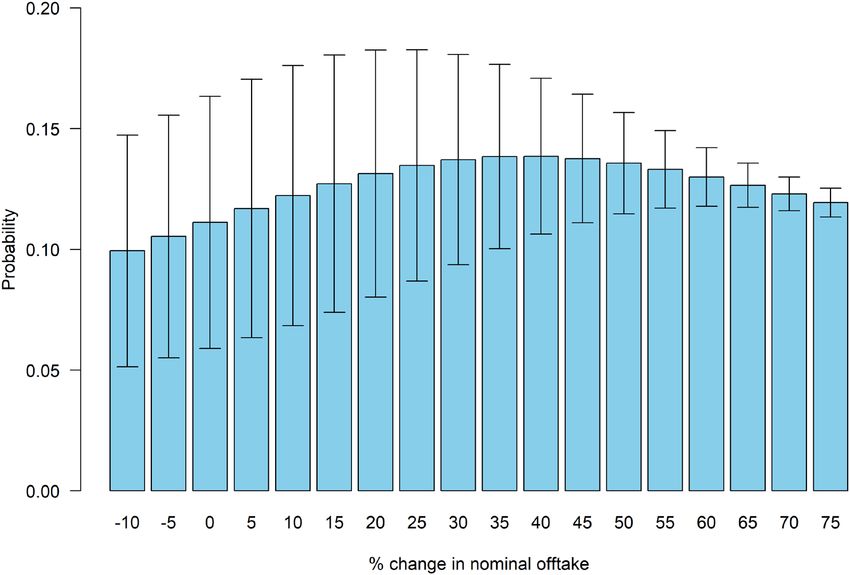
Figure 1. The intrinsic population growth rate of greylag geese as estimated using the methods of Niel and Lebreton (2005) and John-
son et al. (2012), and the realized growth rates based on national counts in the Range States of the NW/SW European population of
greylag geese. Note that counts for Spain and Germany were imputed for 2013–2016. Dashed, vertical lines represent the means.

geese in the Netherlands and in Spain appear to be most             We can also use Eq. 4 to infer the maximum kill rate that
responsible for the lower growth rate when compared to              would not cause the population to decline as:
the 2004–2012 period. We use this estimate of population
growth rate as it best conforms to the time period of reported                 1
                                                                    k¢ = 1 -
abundance and offtake in the ISSMP.                                            l
                                                                    The second approach relies on Eq. 4, but uses intrinsic and real-
Evidence of bias in abundance and/or offtake                        ized survival rates, again under our four model assumptions:

We first assessed the potential for bias in reported estimates
of abundance and/or offtake by examining expected kill and                (
                                                                    q = q 1- k     )                                             (5)
survival rates. Kill rate is defined here as the annual rate of
mortality due to all anthropogenic sources, whether hunt-           such that:
ing/culling related or not. We assumed that: 1) the popula-
tion is not subject to any significant density dependence;                     q
                                                                    k = 1-
2) all anthropogenic mortality is due to sport hunting or                      q
to take under derogations; 3) winter mortality is primarily
                                                                    We used Eq. 5, along with published values of realized sur-
due to hunting/culling; and 4) offtake is additive to other
                                                                    vival, q , from the literature (Frederiksen et al. 2004, Pow-
sources of mortality. While all of these assumptions are
                                                                    olny et al. 2018) to estimate the realized kill rate of greylag
unlikely to be true, we believe they represent a reasonable
                                                                    geese. We then compared estimates from both methods to
starting point.
                                                                    the kill rate implied by reported estimates of midwinter
   There are at least two ways to estimate the realized kill
                                                                    abundance and offtake in the ISSMP:
rate, k , independently of estimates of abundance and off-
take. In the first, we use estimates of the intrinsic and real-
ized growth rates. Under the assumptions listed above, the                    900 000 + 1 200 000
                                                                    Nw =                          = 1 050 000
realized kill rate is a function of the intrinsic and realized                         2
growth rates:

                                                                    H = 450 000
      (
l = l 1- k    )                                             (4)
                                                                    such that:
such that:

                                                                            H     450 000
          l                                                         k=          =          = 0.3
k = 1-                                                                   N w + H 1 500 000
          l

                                                                                                                                   3
As described in Results, an examination of survival and kill understands (s)he is unlikely to meet the criterion of a real-
rates suggested that estimates of abundance and/or offtake ized growth rate l = 0.98 precisely, but would like to get as
reported in the ISSMP are biased. Therefore, we used the close as possible. The info-gap decision problem then is: ‘what
estimated intrinsic and realized population growth rates to nominal level of offtake will meet a performance criterion of
investigate the potential magnitude of that bias by using a l - 1 £ C , where C is some critical threshold, for as large a
modification of Eq. 4: range in α and β as possible?’ For example, (s)he might con-
sider C = 0.02, such that 0.96 ≤ λ ≤ 1 was acceptable (i.e.
population size decreasing by 4% or less per year). Accord-
æ bH ö
l » l ç1 - ÷ (6) ingly, an increasing population, or a population declining
è aN ø more than 4% per year, would be considered unacceptable.
where l is the realized growth rate, λ is the intrinsic growth The lower limit of 0.96 could be anything, and here we simply
rate, H and N are the reported size of the offtake and the note that an annual λ = 0.96, if realized, would reduce popula-
post-breeding population, respectively, and α and β are bias tion size by 34% in 10 years. In June 2020, the International
coefficients. If the (approximate) equality in Eq. 6 is satisfied Working Group of the EGMP decided that a reduction of at
for α = β = 1, then there is no apparent bias in estimates of least 20% in abundance of greylag geese was in line with the
abundance or offtake. We found combinations of α and β management objectives of the ISSMP. We note that the criti-
that satisfy the equality in Eq. 6 for reported values of H and cal limit is symmetric, as expressed by l - 1 £ C . However, it
N, using 5000 independent draws from the distributions for need not be symmetric; for example, in the case where nega-
l and λ (Fig. 1). tive growth rates are more or less desirable than positive ones.
We first established a range of uncertainty in α and β to
examine. Based on the results of our bias investigation, it
Info-gap decision analysis is likely that estimated offtake is biased high as long as true
abundance exceeds nominal abundance by a factor < 3.5.
The existence of bias of unknown magnitude in greylag goose Thus, we set α ~ uniform(0.5,3.5) and β ~ uniform(0.2,1.0).
monitoring renders traditional approaches to modeling pop- We then examined a range of nominal values of offtake and,
ulation dynamics and decision analysis unsuitable. However, for each combination of α and β, predicted l -1 using Eq. 4.
in an effort to guide decision making, we explored an info- While the info-gap analysis relies only on the estimated
gap approach, which poses the question: ‘what level of offtake intrinsic growth rate (and not on an observed growth rate), it
will most likely satisfy a management criterion for the largest is nonetheless sensitive to nominal values of abundance and
range of uncertainty?’ In our case, the deep uncertainty con- offtake. As with the investigation of bias, we used imputed,
cerns the true values of α and β, expressing the degree of bias total winter counts, but used an average of the three most
in estimates of abundance and offtake, respectively. Thus, we recent years available (2016–2018) from the International
would like to choose a management action, in this case a level Waterbird Counts coordinated by Wetlands International
of proportional change in offtake, H, that would meet some (Heldbjerg et al. 2020). We used the most up-to-date infor-
management criteria for a larger range of uncertainty in α and mation on abundance as we were interested in identifying a
β than any other potential change in level of offtake. prospective level of take. Unfortunately, more contemporary
Ultimately, the management criterion will be repre- estimates of offtake than those reported in the ISSMP are
sented by target population sizes for one or more manage- not available, so we continued to assume that the nominal
ment units defined for greylag geese, which are derived from level of offtake is 450 000. Thus, nominal offtake and post-
the different migratory behavior of geese within the flyway breeding abundance was assumed to be:
(Bacon et al. 2019). However, population targets are not use-
ful as criteria in this case because it is abundance itself that is
uncertain. As an alternative, we can establish a management H = 450 000
criterion based on the predicted growth rate of the NW/SW
European flyway population using Eq. 4. In other words, we
can determine the nominal level of offtake that would meet
a growth-rate criterion for the largest possible range in values W 709 000 + 775 000 + 751 000
N IWC =
of α and β. This approach must assume that, whatever the 3
bias in estimates of abundance and/or offtake, it is relatively
constant over time.
Population growth based on national counts during N = 745 000 + 450 000 = 1195 000
2004–2016 was l = 1.038 (1.026 - 1.051) amid growing
concern about the adverse impacts of population size. In the
face of deep uncertainty about current levels of offtake and
abundance, we suggest that decision makers might adopt a Results
precautionary approach, for example, of seeking to reduce
population size by 15% over the 10-year span of the ISSMP. Evidence of bias
Thus, the management goal would be an annual growth
æ log ( 0.85 ) ö Using our estimates of the intrinsic growth rate, λ ≈
rate of l = exp ç ÷ = 0.98 . The decision maker 1.159(1.120–1.206) and realized growth rate during 2004–
è 10 ø 2016, l = 1.038 (1.026 - 1.051) , the estimate of realized
4kill rate was k » 0.10 ( 0.07 - 0.14 ) . The maximum kill rate θ = 1, then γ ≥ 0.48 (i.e. ≥ 32% young in fall) is needed to
that could be tolerated without inducing a decline in grey- prevent the population from declining. While this high level
lag goose abundance was k ≈ 0.14(0.11–0.17). Because the of productivity has been observed in the Netherlands (Horn-
estimated growth rate of the flyway population was positive man et al. 2020), it has not been observed in the past decade.
during 2004–2016, we would therefore expect the realized Age-ratio data from mainly non-migratory populations in
kill rate to be k < 0.14 . both the Netherlands and parts of western Germany show
Using survival rates of adults reported by Powolny et al. averages of 14% and 16% young in fall, respectively (Kof-
(2018) of q Î {0.81, 0.92, 0.74, 0.95, 0.85} and our median fijberg and Kowallik 2018, Hornman et al. 2020). And we
value of θ = 0.89 in Eq. 5, estimates of realized kill rates are emphasize that γ ≥ 0.48 is the minimum productivity assum-
k Î {0.09, -0.03, 0.17, -0.07, 0.04} (where ∊ means ‘is an ing no natural mortality (θ = 1), which is clearly unrealistic
element of ’ the set denoted by {…}). Using estimates of grey- given the assessments mentioned before. For comparison, the
lag goose survival given in Frederiksen et al. (2004, Table 4) of allometric estimate of intrinsic productivity is γ = 0.32(0.19–
q Î {0.84, 0.80, 0.82, 0.85, 0.80, 0.68, 0.73} , estimates of real- 0.54), or about 24% young in the fall. Moreover, if we
ized kill rates are k Î {0.06, 0.10, 0.08, 0.04, 0.10, 0.24, 0.18} assume k = 0.3 and the values of q reported in the litera-
. For values of q > q we get values of k < 0 , which are inad- ture, then survival under ideal conditions is θ > 1 for every q
missible, meaning that q is biased high or θ is biased low. except q = 0.68 , which is impossible (again, assuming addi-
We also note that if we assume θ = 0.89 is approximately tive anthropogenic mortality). Thus, it seems unlikely that
correct, values of k ³ 0.17 would cause the population to k = 0.3 . We therefore conclude that reported abundance is
decline (recall that for k > 0.14, λ < 1). If we ignore these biased low and/or reported offtake is biased high.
irregularities and the fact that the annual survival rates from Using 5000 samples from the distributions for l and λ,
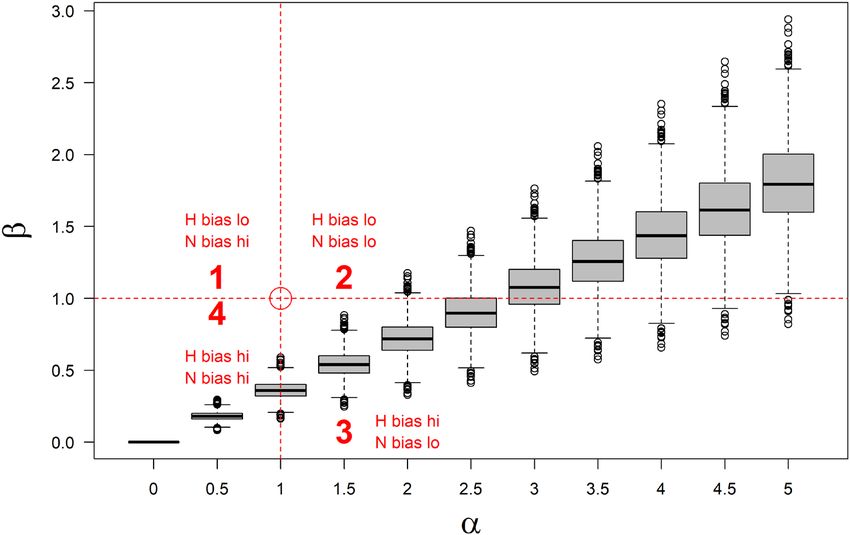
the literature are not independent, then the estimated mean we solved Eq. 6 for β for a range of values of α. A plot of
kill rate is k = 0.08 ( -0.05 - 0.22 ) , which is similar to that the resulting values of β against α can be divided into four
based on population growth rates. quadrants, representing cases where: 1) H is biased low
Therefore, a kill rate of k = 0.3 implied by estimates of (β > 1) and N is biased high (α < 1); 2) H is biased low (β >
abundance and offtake in the ISSMP seems doubtful at best. 1) and N is biased low (α > 1); 3) H is biased high (β < 1) and
We can go one step further using a slight modification to Eq. 4, N is biased low (α > 1); and 4) H is biased high (β < 1) and N
such that: is biased high (α < 1) (Fig. 2). If we were to assume that the
nominal estimate of offtake is unbiased (horizontal dashed
l = l (1 - k ) line in Fig. 2), abundance would be underestimated by a fac-
tor of about 2.5–3. On the other hand, if we assume that the
nominal estimate of abundance is unbiased (vertical dashed
line in Fig. 2), offtake would be overestimated by a factor of
l = q (1 + g ) (1 - k ) almost three. If one were to assume that actual goose abun-
dance is unlikely to be more than about three times the nomi-
where γ = post-breeding age ratio of young to older birds. nal abundance, then inevitable conclusion is that the nominal
If k = 0.3 and we allow for no natural mortality such that estimate of offtake is biased high, perhaps severely so.
Figure 2. Combinations of α and β that satisfy the equality in Eq. (6) for nominal values of abundance and offtake of the NW/SW Euro-
pean population of greylag geese that were reported in the ISSMP. The horizontal dashed line represents an unbiased reported estimate of
offtake, and the vertical dashed line represents an unbiased reported estimate of goose abundance.
5The conclusion that reported offtake is biased high is abilities of meeting the management criterion, and indeed are
further supported if we consider the possibility that the not statistically distinguishable from each other.
intrinsic growth rate is a maximum that may not be real-
ized in a variable environment, or that density-dependent
mechanisms are acting to reduce it. Consider the following Discussion
modification to Eq. 6:
Evidence for bias in monitoring instruments has also been
reported for greylag geese breeding in Iceland (Frederik-
æ bH ö sen et al. 2004) and has been identified at a regional level
l » pl ç 1 - ÷ (7)
è aN ø in Europe (Utrecht and Noord-Holland in the Netherlands;
Stahl et al. 2013, Schekkerman et al. 2018). The source of
where p < 1 represents a potential reduction in the intrinsic the bias in greylag goose monitoring protocols is not easily
growth rate. For any values p < 1, the combinations of α and identified, as other sources of corroborating information are
β that satisfy the equality in Eq. (7) even more strongly sug- lacking. However, IWC counts and estimates of the num-
gest a positive bias in reported offtake. ber of breeding pairs (which may have their own problems)
in the ISSMP seem to suggest that national counts may be
Info-gap results roughly of the correct magnitude or at least not severely
underestimated. Corroborating estimates of sport and der-
Based on 5000 samples from the distributions for l , the ogation harvest are lacking, but we note that Padding and
probabilities of meeting the management criterion of 0.96 ≤ Royle (2012) found that hunter-reported goose harvests in
λ ≤ 1.96 for a range of potential levels of offtake are shown the U.S. were 49–64% higher than the actual harvests (e.g.
in Fig. 3. Notice that all probabilities are low (< 20%), hunters potentially exaggerated their harvest). This is a pos-
reflecting the challenge of meeting the restrictive criterion of sible cause of a positive bias in offtake in the case of greylag
0.96 £ l £ 1.00 in the face of deep uncertainty concerning geese, but bias could also arise from other factors. For exam-
the true extent of bias, α and β. A nominal level of offtake of ple, there may be reporting errors or incentives to inflate the
40% higher than that reported in the ISSMP is expected to reported derogations, which may arise from local manage-
achieve the management criterion for a wider range in α and β ment practices designed to minimize agricultural damage.
than any other alternative. But we emphasize that this decision It is also possible that reported population sizes and offtake
would be accompanied by an 86% chance that the criterion for greylag geese are approximately correct, but this would
would not be met (assuming all examined values of α and β demand higher survival and fecundity than is typical in arc-
are considered equally plausible). In other words, there would tic and subarctic breeding geese. Indeed, the proportion of
be an 86% chance that abundance could either increase or young in the flyway population prior to hunting would have
decline by more the 4% annually. Finally, we note a very broad to be ≥ 32% (the minimum value of 32% would only be
range of changes in offtake had nearly identical (mean) prob- possible if there was no mortality other than harvest). Based
Figure 3. Probabilities of achieving a population growth rate of 0.96 ≤ λ ≤ 1.00 for varying levels of change in reported offtake (relative to
the value of 450 000 reported in the ISSMP) for NW/SW European population of greylag geese in the face of deep uncertainty about bias
in estimates of abundance and offtake. Error bars represent 95% confidence limits, which account for uncertainty in the intrinsic growth
rate of greylag geese.
6on allometric relationships (Niel and Lebreton 2005, John- ment in greylag goose monitoring would be to document
son et al. 2012), we would expect about 23% young under the protocols used for generating estimates of offtake in each
ideal conditions. Recent assessments from the Netherlands of the Range States, including identification of responsible
and Germany suggest 14–16% young in mainly non-migra- parties and methods for data collection and reporting. The
tory populations in the southern portion of the population’s resulting compendium could provide useful insights into
range (Koffijberg and Kowallik 2018, Hornman et al. 2020). potential sources of bias. Also, if resources allow, a cap-
However, greylag geese breeding in temperate latitudes do ture–mark–resight program could be useful for investigat-
so under exceedingly favourable environmental conditions ing potential bias in abundance (Clausen et al. 2019), and
and such high values of reproductive success cannot be com- would have the additional benefit of providing independent
pletely dismissed as they were observed in the Netherlands in estimates of survival (and potentially, harvest) rates. If grey-
the late 1990s (Hornman et al. 2020). lag geese in Europe are to be managed as a shared resource,
Although an increase in nominal offtake may be needed it seems clear that more international coordination will be
to reduce population size, the info-gap analysis suggests that essential for establishing rigorous and standardized protocols
an increase in offtake may even be needed to stabilize popu- for data collection and archiving.
lation size. Yet recent IWC counts and the national counts
suggest that the flyway population is no longer increasing Acknowledgements – We thank Sergey Dereliev and Eva Myers
(Heldbjerg et al. 2020). Assuming this recent population (EGMP Secretariat), Szabolcs Nagy (Wetlands International)
trend is real, there are at least three possible reasons for the and Jesper Madsen (Aarhus University) for helpful discussions
contradictory conclusions arising from the info-gap analysis: regarding the results of this research. We also thank Anthony Fox
1) the current, reported winter abundance is lower than the (Aarhus University) for helpful suggestions on an earlier draft of
value we used; 2) the current offtake is higher than the value the manuscript.
Funding – Financial support for this study was provided by the
we used (i.e. it has increased in recent years); or 3) there EGMP Data Centre ().
are factors beyond offtake (e.g. density dependence) acting
to lower the growth rate. Indeed, all three reasons might be
operative. References
In the face of deep uncertainty about estimates of greylag
goose abundance and offtake, decisions concerning man- Bacon, L. et al. 2019. Spatio–temporal distribution of greylag
agement of this population carry a high risk of failing to goose Anser anser resightings on the north–west/south–west
meet conservation objectives, whatever they may be. If such European flyway: guidance for the delineation of transbound-
decisions must be made, however, information-gap decision ary management units. – Wildl. Biol. 2019: wlb.00533.
analysis offers perhaps the most robust choice of decision- Ben-Haim, Y. 2001. Information gap decision theory: decisions
under severe uncertainty. – Academic Press.
analytic tools. Info-gap analysis seeks a decision among
Buij, R. et al. 2017. Balancing ecosystem function, services and
all possible choices that has the best chance of meeting a disservices resulting from expanding goose populations. –
management criterion for the largest range of uncertainty. Ambio 46: 301–318.
In the case of greylag geese, however, simplifying assump- Clausen, K. K. et al. 2019. Using re-sighting data to estimate pop-
tions about population dynamics must be made, and only ulation size of pink-footed geese Anser brachyrhynchus. – Ornis
a management criterion based on the rate of flyway popu- Fenn. 96: 112–123.
lation growth is plausible, as almost any other objectives Dunning Jr., J. B. 2008. CRC handbook of avian body masses. –
would likely be related in some way to population size or CRC Press.
Fox, A. D. and Leafloor, J. O. 2018. A global audit of the status and
offtake, both of which are unknown. Even a management
trends of Arctic and Northern Hemisphere goose populations.
criterion based on a population growth rate is feasible only if – Conservation of Arctic Flora and Fauna International Secretariat.
we assume that the bias in abundance and offtake, whatever Frederiksen, M. et al. 2004. The dynamics of hunted Icelandic
their magnitude, are relatively constant over time. goose populations: a reassessment of the evidence. – J. Appl.
Using simple models of population dynamics along with Ecol. 41: 315–334.
observed allometric relationships in birds, we have inferred Heldbjerg, H. et al. 2020. Greylag goose northwest/southwest
that reported estimates of greylag goose population size and/ European population status report 2016–2019. – .
so. Our analysis also provides greater evidence that offtake is
Hornman, M. et al. 2020. Watervogels in Nederland in 2014/2015.
biased high than abundance is biased low, although bias in – Sovon Rapp 2020/01.
both cannot be discounted. Recognizing that resources are Johnson, F. A. et al. 2012. Allowable levels of take for the trade in
limited, we suggest that the most pressing need may be to Nearctic songbirds. – Ecol. Appl. 22: 1114–1130.
investigate and strengthen monitoring protocols for greylag Kampp, K. and Preuss, N. O. 2005. The greylag geese of Utterslev
goose offtake. While population counts have been largely Mose: a long-term population study of wild geese in an urban
coordinated among countries using standardized methods setting. – Dansk Ornitol. Foren. Tidsskr. 99: 1–78.
(Heldbjerg et al. 2020), offtake reporting has been rather Koffijberg, K. and Kowallik, C. 2018. Sommerbestände von
Gänsen in Nordrhein-Westfalen 2011–2017. – Charadrius 54:
haphazard. For example, reporting is sometimes not required
151–166.
nor solicited, reported offtake is occasionally an unknown Madsen, J. 1991. Status and trends of goose populations in the
mix of sport harvest and derogations, data are sometimes not western Palearctic in the 1980s. – Ardea 79: 113–122.
routinely compiled on a national basis, and monitoring pro- Niel, C. and Lebreton, J. 2005. Using demographic invariants to
tocols are sometimes changed without maintaining adequate detect overharvested bird populations from incomplete data.
documentation of the changes. A first step toward improve- – Conserv. Biol. 19: 826–835.
7Nigrelli, R. F. 1954. Some longevity records of vertebrates. – Trans. Powolny, T. et al. 2018. AEWA International Single Species
N. Y. Acad. Sci. 16: 296–299. Management Plan for the greylag goose Anser anser – northwest/
Nilsson, L. and Kampe-Persson, H. 2018. Lifetime reproductive southwest European population. – AEWA Tech. Ser. No. 71.
success of greylag geese Anser anser breeding in south Sweden. Regan, H. M. et al. 2005. Robust decision-making under severe
– Ornis Svecica 28: 39–47. uncertainty for conservation management. – Ecol. Appl. 15:
Nilsson, L. et al. 1997. Factors affecting survival of young greylag 1471–1477.
geese Anser anser and their recruitment into the breeding pop- Schekkerman, H. et al. 2018. Evaluatie van het Ganzenbeheerplan
ulation. – Wildfowl 48: 72–87. 2015–2020 Noord-Holland. – Sovon-rapport 2018/65.
Padding, P. I. and Royle, J. A. 2012. Assessment of bias in US Stahl, J. et al. 2013. Beheer van zomerganzen in de Provincie
waterfowl harvest estimates. – Wildl. Res. 39: 336–342. Utrecht. – Savon-rapport 2013/28.
Polasky, S. et al. 2011. Decision-making under great uncertainty: van der Burg, M. P. and Tyre, A. J. 2011. Integrating info-gap
environmental management in an era of global change. – decision theory with robust population management: a case
Trends Ecol. Evol. 26: 398–404. study using the Mountain Plover. – Ecol. Appl. 21: 303–312.
8You can also read