Genetic Structure Analysis of the Pura Raza Español Horse Population through Partial Inbreeding Coefficient Estimation - MDPI
←
→
Page content transcription
If your browser does not render page correctly, please read the page content below
animals
Article
Genetic Structure Analysis of the Pura Raza Español
Horse Population through Partial Inbreeding
Coefficient Estimation
Davinia I. Perdomo-González 1, * , María J. Sánchez-Guerrero 1 , Antonio Molina 2
and Mercedes Valera 1
 1   Departamento de Ciencias Agro-forestales, ETSIA, Universidad de Sevilla, Carretera de Utrera Km 1,
     41013 Sevilla, Spain; v32sagum1@gmail.com (M.J.S.-G.); mvalera@us.es (M.V.)
 2   Departamento de Genética, Universidad de Córdoba, Campus Universitario de Rabanales, Edificio Gregor J.
     Mendel, Planta baja, Carretera Madrid-Cádiz km 396ª, 14071 Córdoba, Spain; ge1moala@uco.es
 *   Correspondence: davpergon1@alum.us.es; Tel.: +34-954-486-461

 Received: 14 July 2020; Accepted: 4 August 2020; Published: 6 August 2020

 Simple Summary: The Pura Raza Español horse (PRE) is an autochthonous Spanish horse recognized
 as an official breed since the 15th century. In 1912, with the creation of its studbook, it became a closed
 population (only animals belonging to the breed acts as breeders: 23,530 stallions and 75,870 mares), in
 which relatedness between individuals and inbreeding has tended to increase. Inbreeding estimation
 measures the probability in an individual of possessing, in one gene, two identical alleles derived
 from a common ancestor. Each common ancestor provides part of the descendant’s total inbreeding
 (partial inbreeding coefficient, Fij ). This work analyzes the Fij , calculated using a recently developed
 approach (based on founders and Mendelian sampling of the non-founders) in the whole PRE
 population. The identification of 10,244 common ancestors and their relationship with the seven
 most influential individuals of the breed allowed us to determine that a genetic bottleneck due to an
 unequal contribution over the generations occurred. Computing Fij has being an important tool to
 determine which are the breeding animals, with more or less massive use, whose are determining
 a loss of genetic variability in the population at each moment and has enabled us to expand our
 knowledge about PRE genetic demographic evolution.

 Abstract: The aim of this work was to analyze genetic parameters such as the inbreeding coefficient
 (F), relatedness coefficient (AR) and partial inbreeding coefficient (Fij ) of the whole PRE population,
 and the ancestors which account for 50% of the total genetic variability of the current population,
 from genealogical information. The average F of the whole PRE population (328,706 animals) has
 decreased from 8.45% to 7.51% in the least 20 years. The Fij was estimated for the whole PRE
 population, resulting in a database of 58,772,533 records containing one record for each Fij that each
 animal receives from a certain common ancestor (CA). A total of 10,244 CAs contributed to the Fij
 with an average of 5370 descendants, with each descendant having an average of 170 CAs. Over the
 generations, the number of CAs has increased, while the proportion of Fij by each one has decreased.
 In addition, the contributions of the more influential ancestors have changed. The increased census,
 the limited use of artificial insemination and our increased knowledge about inbreeding depression
 and the animals’ breeding values allow breeders to select horses more for their functionality and
 conformation than for their pedigree reputation, which is the cause of all these changes.

 Keywords: common ancestors; genetic variability; studbook; genealogical analysis

Animals 2020, 10, 1360; doi:10.3390/ani10081360                                www.mdpi.com/journal/animals
Animals 2020, 10, 1360 2 of 13
1. Introduction
The Pura Raza Español horse (PRE) is an autochthonous Spanish horse population and the most
important horse breed in Spain in terms of both history and census, with 252,852 active horses [1].
A single association, the National Association of Pure Spanish Horse Breeders (ANCCE), manages all
of them, despite the fact that 23.3% of PRE horses are distributed abroad, in over sixty countries [1].
PRE is a breed with ancestors dating back thousands of years in the Iberian Peninsula, and was
recognized as an official breed in the 15th century [2]. This breed has exceptional temperamental
and functional qualities, making it highly suitable for different equine competitions, above all, classic
dressage [3]. The foundation of the studbook was officially approved on January 1, 1912, and it was
being managed by the Spanish Armed Forces first and since 2007 by the ANCCE. Following the creation
of the studbook, the number of horses born each year increased (around 100 animals per year) until the
1970s, after which the growth surged to a maximum figure of 19,560 new horses in 2009. From that
year, growth has fallen and has now stabilized at about 10,000 births per year. Since the establishment
of the studbook, the inscription of new PRE horses has been restricted to those animals born from
horses registered in the official studbook, which has therefore created a completely closed studbook, in
which the mating of related individuals is inevitable in the long term. In closed populations with a
non-reduced census, the intensive use of selection also leads to an increase in the level of inbreeding [4].
Pedigree-based relationship coefficients are often used to manage the inbreeding in a population when
effects of the inbreeding depression begin to be manifested. Although, in recent decades, attempts have
been made to maintain genetic variability in the PRE population, in general, unbalanced contributions
of founders reflect the great loss of genetic diversity over the generations [2].
The inbreeding coefficient of an individual (F) is defined as the probability of an individual to
possesses two identical alleles by descent from a common ancestor at the same randomly chosen
locus [5]. Historically, F has been studied only as the sum of the founder’s partial coefficients [6], but this
does not provide detailed information about the contribution of each ancestor to the identity-by-descent
(IBD) probability. Alternatively, F can be broken down into the sources of the coancestry between the
parents of each individual [7,8] as the sum of the partial coefficient from founders and the Mendelian
sampling of the non-founders. These partial coefficients into which F can be partitioned are known as
partial inbreeding coefficients, Fij , which is the combined probability that an individual i is autozygous
for an allele and that this allele was derived from the allele in ancestor j [6,9,10].
The possibility of computing, for the first time in equines with a high census population, the partial
inbreeding coefficients (Fij ) attributed not only to founders but also to non-founders, presents a way of
analyzing the PRE population structure and evolution from a new point of view and gives us greater
insight into the genetic variability of PRE over the generations. Moreover, this approach provides
us with a methodology to identify the unequal common ancestor’s contribution and determine the
reasons why a certain ancestor becomes important.
2. Materials and Methods
Pedigree data were obtained from the ANCCE studbook, with a total of 328,706 animals
(160,640 males and 168,066 females) born from 1900 to 2018, of which 99,400 horses (30.24%) have been
used for breeding (23,530 stallions and 75,870 mares).
The parameters related to the quality of genealogical information were estimated, including
pedigree completeness level (the proportion of ancestors known in each ascending generation [11]),
complete generations (the number of generations separating the offspring of the furthest generation
where the 2g ancestors of the individual are known, where g is the number of generations since the last
known ancestor), maximum generations (the number of generations separating the individual from its
furthest ancestor) and equivalent generations (the sum of (1/2)n, where n is the number of generations
separating the individual to each known ancestor [12]). The parameters of genetic variability estimated
were inbreeding coefficient (F, defined as the probability that an individual has two genes identical by
descent [13]) and average relatedness coefficient (AR, defined as the probability that an allele randomlyAnimals 2020, 10, 1360 3 of 13
chosen from the whole population in the pedigree belongs to a given animal [14], i.e., the representation
of the animal in the whole pedigree; also, the AR of a founder indicates its genetic contribution to
the population). Finally, the number of founders (ancestors with unknown parents), the number of
ancestors (the ancestors, not necessarily founders, accounting for 100% of the genetic diversity in the
actual population), the effective number of founders (fe , the number of equally contributing founders
that would be expected to produce the same genetic diversity as in the population under study [15])
and the effective number of ancestors (fa , the minimum number of ancestors, not necessarily founders,
which account for the complete genetic diversity of a population [15]) were also calculated to evaluate
whether bottlenecks have affected the population.
The approach developed by Casellas [16] was used to estimate the Fij transmitted by each common
ancestor to each inbred descendant of the PRE pedigree file. This new approach allowed the inbreeding
to be broken down into the sources of the co-ancestry between the parents of each individual, which
include the founders of the population (the traditional approach) and the Mendelian sampling of the
non-founders [7,8]. Thus, the inbreeding load (ii ) for the i th individual can be decomposed as follows:
ii = is + id + εi (1)
where is and id are the inbreeding loads for its sire and dam, respectively, and εi is its Mendelian
sampling [16,17]. This approach provides a subset of partial inbreeding coefficients accounting for
the identity-by-descent contribution from each relevant ancestor. In addition, to evaluate whether
the most influential ancestors (those which provide the Fij for a greater number of descendants) also
explain most of the genetic variability of the total PRE population, ancestors accounting for 50% of
the genetic contribution in the total population (based on Boichard methodology [15]) were analyzed.
Demographic and genetic variability parameters were calculated using the ENDOG v4.8 software [18].
Finally, with the objective of identifying which factors have contributed to a certain animal having
a higher or lower inbreeding level, several factors historically related to F were analyzed using a general
linear model followed by a Tukey post hoc test of least square means. Reproductive status (4 levels;
male without offspring, female without offspring, stallion with offspring and mare with offspring) was
included to determine if linage implies a higher or lower use of an animal for reproduction. Coat color
(5 levels; grey, bay, black, chestnut and other minority coat colors) was included to analyze its pleiotropic
role. And factors as birth generational interval (10 levels; 1919–1928, 1929–1938, 1939–1948, 1949–1958,
1959–1968, 1969–1978, 1979–1988, 1989–1998, 1999–2008 and 2009–2018), birth stud size (7 levels;
1 animal, 2–4 animals, 5–9 animals, 10–14 animals, 15–19 animals, 20–24 animals and ≥25 animals)
and geographic zone (6 levels; Spain, Rest of Europe, South America, North America, Australia and
Africa) were included due to its relation to differences in horse management. Statistical analyses were
performed using SPSS software for windows [19].
3. Results
The pedigree completeness level of the PRE horses born in last generational interval (the last
10 years [20], 115,005 individuals) was 99.6%, remaining above 99% until the third generational interval
and above 90% until the seventh generational interval. The mean complete generations of the total
pedigree (328,706 horses) were 5.6, the mean maximum generations were 17.1 and the mean equivalent
generations were 9.4. The total PRE population showed an average F of 7.51% and a mean AR of
11.31%. Up to 98.7% of the registered individuals are inbred, and those born in the last four generations
are 99.9% inbred. Animals belonging to the last generational interval showed a mean F of 7.25% and a
mean AR of 11.20%, with the mean of complete generations 6.2, a maximum pedigree depth of 18.8
generations and the mean of equivalent generations of 10.4. The effective number of founders (fe = 33)
was only 3.13% of the total number of founders (1053) and the effective number of ancestors (fa = 19)
was 1.86% of the total number of ancestors (1023).Animals 2020, 10, 1360 4 of 13
The Fij was estimated for the whole PRE population, resulting in a database of 58,772,533 records
(one record for each Fij that each animal receives from a certain common ancestor). The Fij values
oscillated from 0% to 25% and the average Fij (±sd) was 0.042% (±0.19). A total of 10,244 common
ancestors (3676 stallions and 6568 mares) provided an Fij for an average of 5370 offspring (from 1 to
323,807 descendants). The number of common ancestors for each descendant ranged from 1 to 731
(an average of 170). Most of the 58,772,533 Fij records were very low; 92.0% were lower than 0.1%.
The remaining 8% were Fij values equal to or above 0.1% belonging to a total of 323,803 animals, which
received Fij from at least one common ancestor and a maximum of 49 (an average of 15 CAs). A total
of 9778 CAs (3569 stallions and 6209 mares) provided an Fij ≥ 0.1% for an average of 487 descendants
(from 1 to 317,790).
The total PRE population was divided according to different groups of F values showing the
average number of common ancestors (ACA) and the average Fij they transmit in each group (Table 1).
Almost half the PRE population (47.45%) have an F value between 3.12% and 6.25% and, at the same
time, this population group has the highest number of male common ancestors (an average of 84).
The F ≥ 25% population group has the same average number of male common ancestors (an average of
84) but the highest number of female ancestors (an average of 108). The least numerous groups are
the extremes: 0% < F < 3.125% and F > 25.0% with 5.03% and 1.29% of the population, respectively.
Besides, animals with a higher F value (≥25%) also have common ancestors which transmit a higher
average Fij , both in stallions and mares. In all cases, males transmitted a higher average Fij value (from
0.04% to 0.41%) than females (from 0.02% to 0.19%).
Table 1. Partial inbreeding coefficient (Fij ) transmitted by common ancestors classified by the total
inbreeding coefficient (F) level of the Pura Raza Español horse.
Average n◦ of Common Ancestors
Average Fij (%) ± SD
F Group (%) N N (%) [Min, Max]
Stallions Mares Stallions Mares
>0 to 3.12 16,518 5.03 51 [1, 142] 55 [1, 181] 0.04 ± 0.07 0.03 ± 0.07
3.12 to 6.25 155,984 47.45 84 [1, 209] 97 [1, 315] 0.04 ± 0.05 0.02 ± 0.04
6.25 to 12.5 109,641 33.36 76 [1, 233] 89 [1, 353] 0.09 ± 0.13 0.05 ± 0.08
12.5 to 25.0 38,008 11.56 72 [1, 283] 89 [1, 448] 0.21 ± 0.37 0.11 ± 0.24
≥25.0 4242 1.29 84 [1, 225] 108 [1, 355] 0.41 ± 1.2 0.19 ± 0.31
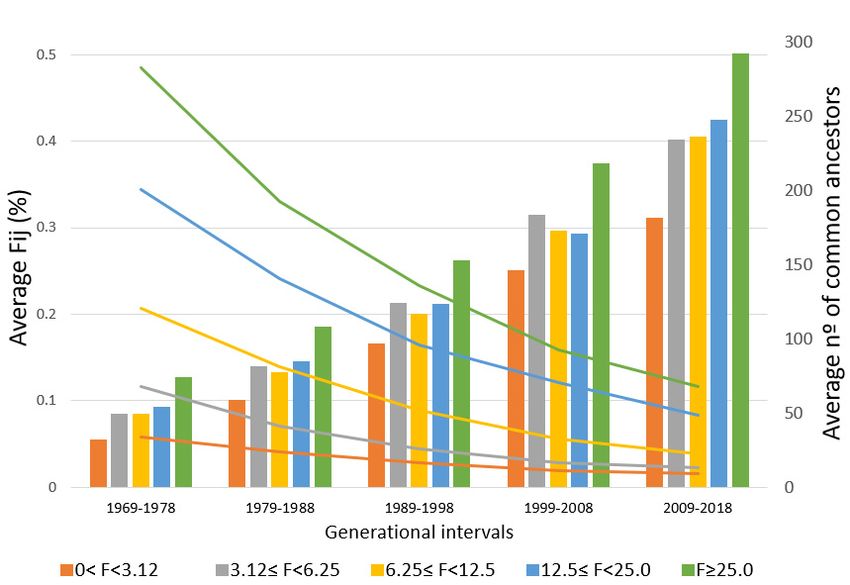
On the other hand, the average partial inbreeding coefficient transmitted by common ancestors
and the ACA in individuals (320,483 horses) born in the last five generational intervals are shown
for each F group (Figure 1). It can be seen that the ACA (bars), by a group of F values, is increasing
each generational interval, while, at the same time, the average Fij transmitted by common ancestors
(lines) decreases. In the 1969–1978 interval, horses with an F coefficient higher than 0% but lower than
3.12% have an ACA of 32, transmitting an average Fij of 0.06%, while horses with an F coefficient ≥25%
have an ACA of 74, transmitting an average Fij of 0.49%. On the other hand, in the 2009–2018 interval,
inbred horses with an F coefficient lower than 3.12% have an ACA of 182, with an average Fij of 0.02%,
while horses with an F coefficient ≥25% have an ACA of 293, with an average Fij of 0.12%.
The PRE population evolution (N) by generation (Figure 2), highlighting a major increase in
horses born over the last two generations (1999–2018), in which 253,525 horses were born, more than
the 77% of the whole PRE population. Over the generations, the average of common ancestors (n) by
generation of birth has also increased. The average F value for the PRE population (F_N) increases
from 0.36% in the first generation to 8.40% in the 1979–1988 interval and then decreases to 7.25%, while
the average F of their common ancestors (F_n) increases gradually from 0% to 6.96%. The average AR
behaved in a similar way, with each generation increasing from 0.38% to 11.91% until 1989–1998 for the
total population (AR_N) with a minor decrease over the last two generations to 11.19%. The average
AR of their common ancestors (AR_n) rose slowly from 0.40% to 2.21% in the first four generationalAnimals 2020, 10, 1360 5 of 13
intervals (from 1919 to 1958) and then increased more sharply to 10.25% in the last generation interval.
Animals 2020, 10,
Finally, thex average
FOR PEERFijREVIEW 5 of 13
that the common ancestors transmitted to their descendants has seen a gradual
decrease over the generations, from 4.48% to 0.03%.
Animals 2020, 10, x FOR PEER REVIEW 5 of 13
Figure 1. Average partial inbreeding coefficient (Fij) by common ancestor (lines) and average number
Figure 1. Average partial inbreeding coefficient (Fij ) by common ancestor (lines) and average number of
Figure
of 1. Average
common partial (bars)
ancestors inbreeding the5coefficient (Fij) by common ancestor (lines)
theand
totalaverage number
common ancestors (bars) in theinlast last 5 generational
generational intervals
intervals according
according to inbreeding
to the total inbreeding
coefficient
of common
coefficientancestors (bars) in the last 5 generational intervals according to the total inbreeding
(F) level of(F)
thelevel
PuraofRaza
the Pura
EspañolRaza Español horse.
horse.
coefficient (F) level of the Pura Raza Español horse.
Figure 2.
Figure Censusevolution
2. Census evolution of
of the
the Pura
Pura Raza
Raza Español
Español horse (N ==328,706)
horse (N 328,706)and
andtheir
theircommon
common ancestors
ancestors
(n = 10,244), average inbreeding coefficient (F_N and F_n), average relatedness coefficient (AR_N
(n = 10,244), average inbreeding coefficient (F_N and F_n), average relatedness coefficient (AR_N and and
AR_n) and average partial inbreeding value (F ) by generational intervals.
AR_n) and average partial inbreeding value (Fijij) by generational intervals.
Figure 2. Census evolution of the Pura Raza Español horse (N = 328,706) and their common ancestors
On the other
(n = 10,244), average hand, the total genetic variability
inbreeding of theaverage
PRE population can be explained by just
On the other hand, the totalcoefficient (F_N and of
genetic variability F_n), relatedness
the PRE population cancoefficient (AR_N
be explained by and
just
1023 ancestors (f , founders or not), with 50% of the total contribution due to only seven of them, five
AR_n)
1023 ancestors (faa, founders
and average partial inbreeding
or not), with value
50%(F ofij)the
by total
generational intervals.
contribution due to only seven of them, five
males and two females (Table 2). These seven most influential ancestors, born between 1900 and 1949,
males and two females (Table 2). These seven most influential ancestors, born between 1900 and 1949,
transmit an average
On the other hand,FFijijtheranging from 0.03%
total from
genetic to 0.54% to an
variability average of 288,644 descendants (between
transmit an average ranging 0.03% to 0.54% of to antheaverage
PRE population can be explained
of 288,644 descendants (between by just
182,731 and 319,917). Despite this large number of descendants, very few of them have received an Fij
1023182,731
ancestorsand(f319,917).
a, founders or not),
Despite this with
large 50%
number of the total contribution
of descendants, very fewdue ofto onlyhave
them seven of them,
received an five
equal or higher than 6.25% from these 7 ancestors, including only 33 descendants from Maluso, 31 from
F equal or higher than 6.25% from these 7 ancestors, including only
males and two females (Table 2). These seven most influential ancestors, born between 1900 and
ij 33 descendants from Maluso, 311949,
from an
transmit Americano,
average30Ffrom Celosofrom
ij ranging III, 24 0.03%
from Destinada,
to 0.54%5 to fromanOficial
averageI and
of0288,644
from Oficial III and Zurrona.
descendants (between
Between 30% and 40% of the descendants of these seven ancestors are
182,731 and 319,917). Despite this large number of descendants, very few of them have received an in the last generational interval
(except Maluso, with only 4.92%), transmitting them an average Fij slightly lower than that of their
Fij equal or higher than 6.25% from these 7 ancestors, including only 33 descendants from Maluso, 31
total descendants. The contributions of the two major ancestors, Americano and Destinada, are 13.9%
from Americano, 30 from Celoso III, 24 from Destinada, 5 from Oficial I and 0 from Oficial III and Zurrona.Animals 2020, 10, 1360 6 of 13
Americano, 30 from Celoso III, 24 from Destinada, 5 from Oficial I and 0 from Oficial III and Zurrona.
Between 30% and 40% of the descendants of these seven ancestors are in the last generational interval
(except Maluso, with only 4.92%), transmitting them an average Fij slightly lower than that of their
total descendants. The contributions of the two major ancestors, Americano and Destinada, are 13.9%
and 11.8%, respectively, which represents over 25% of the total genetic contribution. Both Americano
and Destinada have slowly increased their influence over the generations, with a maximum influence
in 1999–2008, when they had the highest number of descendants (43.7% and 43.3% of their total
descendants, respectively). After that, their number of descendants decreased to 36.34% and 35.94%,
respectively, in 2009–2018 (with around 80% of their descendants born in the last two generational
intervals). The Fij transmitted by Americano and Destinada have followed the same tendency as the
average, decreasing from 6.25% and 3.75% in the 1919–1928 interval to 0.45% and 0.67% in the 2009–2018
interval, respectively, so Americano at first transmitted a higher Fij and currently transmits a lower Fij
than Destinada. Moreover, these seven most influential ancestors (based on Boichard methodology [15])
are part of the 5% (520 common ancestors) of the total ancestors (based on Casellas methodology [16])
with the largest number of descendants, occupying positions 15, 16, 19, 38, 40, 45 and 153. These 520
ancestors transmit an average Fij of 0.03% to an average of 108,960 descendants.
Table 2. Ancestors accounting for 50% of the genetic variability of the total Pura Raza Español horse
(PRE) population. The table shows their contribution, the number of total descendants, those with
an Fij value over 6.25%, the number and percentage of descendants in last generational interval, total
average Fij and the average Fij they transmit to the last generational interval.
Ancestors Sex Year C(Ca) N(1) Fij (%) N(2) N(3) % N(3) Fij (%)N(3)
Americano M 1927 13.9 316,293 0.54 31 114,952 36.34 0.45
Destinada F 1923 11.8 (25.7) 319,917 0.74 24 114,981 35.94 0.67
Maluso M 1949 6.7 (32.4) 182,731 0.24 33 89,887 4.92 0.20
Celoso III M 1933 6.0 (38.4) 296,641 0.11 30 113,587 38.29 0.09
Oficial III M 1927 4.9 (43.3) 295,296 0.07 0 113,408 38.40 0.06
Oficial I M 1900 4.2 (47.5) 317,585 0.09 5 114,981 36.20 0.09
Zurrona F 1919 3.1 (50.6) 292,045 0.03 0 112,552 38.54 0.02
Year: ancestors birth’s year; C: contribution (%); Ca: accumulated contribution (%); N(1): ancestors’ total number
of descendants; Fij (%): average Fij transmitted; N(2): ancestors’ descendants with Fij ≥ 6.25%; N(3): number of
descendants born in last generation; %N(3): Percentage of descendants born in last generation; Fij (%)N(3) : average
Fij transmitted to descendants born in last generation.
Finally, to identify which factors, previously related to F, could have contributed to a horse having
a higher or lower inbreeding level, a general lineal model was used. All the factors studied were
significantly associated with the F level (Table 3). The results related with reproductive status showed
that breeding horses (both stallions and mares with offspring) have a higher mean F than those without
offspring; furthermore, stallions show an average F higher than mares. In addition, horses with grey
coats, the birth generational interval between 1979 and 1988, a birth stud with more than 25 horses and
horses from South America showed the highest mean F values.Animals 2020, 10, 1360 7 of 13
Table 3. Main factors affecting inbreeding coefficient (F, %) in the total population of Pura Raza Español horses. Means comparison with Tukey Least Square Means
post hoc test.
n/F(%) Effect/Levels p Value
Reproductive Status
Male Female Stallion Mare
n 137,110 92,196 23,530 75,870
F (%) 7.50 ab 7.45 a 7.74 c 7.55 bAnimals 2020, 10, 1360 8 of 13
4. Discussion
As the inscription of new PREs since 1912 has been restricted to the offspring of horses already
registered, the mean F of the population increased until the 1990s [21], followed by a decrease in the last
two decades. The mean F (7.51%) and AR (11.31%) values obtained in this work were lower than the
values reported in the same breed by Valera et al. [21], F = 8.48% and AR = 12.25%, Cervantes et al. [22]
F = 8.20% and Gomez et al. [23] F = 8.20%. This is mainly because these authors did not include data
from the two last decades, when over 70% of the PRE population was born and when management
by breeders and the breeding program have become a key part of conservation genetics, aimed at
avoiding matings with high levels of inbreeding [24].
Several studies have reported different average inbreeding values, which are positively correlated
to pedigree length and completeness [21]. The greater the depth of the pedigree, the greater the
possibility of have a greater number of common ancestors (in pedigrees with a high depth and high
completeness, the increase in its depth has little impact on his F). This can be observed in other closed
populations, such as the Spanish Arabian horse, with an F value of 7% and a mean equivalent generation
of 7.9 [25], or the Old Kladruber horse, with an F value of 13% and an equivalent generation number of
15.1 [26]. The Lusitano and Lipizzan horse breeds are historically and genetically related to the PRE
breed [27,28]. The Lusitano horse breed shows a mean F value of 9.92% and a number of equivalent
generations of 9.87 [27], while the Lipizzan horse, with 15.22 complete equivalent generations, shows a
mean F of 10.8% [28]. In addition, despite the fact that the Lusitano is a closed and inbred breed, the
care taken by breeders to maintain the genetic variability, as the case of the Lusitano horse in Brazil,
make their level of inbreeding lower than the total population, especially in the last generation with a
mean F of 4.46% and a number of equivalent generations of 6.4 [29].
In order to determine the main factors that define a greater or lower level of inbreeding in the
current PRE population, a number of factors, such as coat color, reproductive status, birth generational
interval, geographic zone and birth stud size have been evaluated. All the factors studied are associated
with the F level in our population with a statistically high significance. Coat color has been previously
determined as a highly significant factor in other analyses of the PRE breed, which studied reproductive
parameters [20], morphology [30] and defects such as vitiligo and melanoma [31] or cresty neck [32],
highlighting an association with the pleiotropic role of coat color genes, especially with the grey coat
color. The reason why the grey coat color is especially related to high levels of inbreeding could be
attributed to the influence of the Carthusian strain to PRE horses. This strain is highly inbreeding, and
its influence in the PRE population is very raised [21]. However, the mating of certain animals for
their coat color is more related to a trend of the moment than an inbreeding issue, because, throughout
history, certain coat colors have been more desirable than others [20]. Reproductive status seems to
be an important factor in this breed, where the individuals with important ancestors continue to be
used as breeder animals due to their desirable racial traits, established by breeders over the years
through inbreeding, meaning that the most inbred horses are used as breeding animals. In addition,
the reproductive status of the mare was used as a factor related to consanguinity in the fertility of Black
Forest Draught horses [33], where a major influence on the cycle foaling rate was found. Meanwhile,
the generational interval seems to be a factor that contributes significantly to our knowledge of mean
F tendencies. Inbreeding tendencies in a breed history tend to increase gradually, as occurs in the
Maremmano horse breed [34] with an increase from 1.29% (1981) to a maximum of 5.38% (2015), or
can remain constant, as in the Lusitano breed, which initially showed a stable average F value pattern
of around 10% until the 1980s and then increased slightly [27]; in other cases, it can decrease, as in
the PRE, whose F started to decrease in the 1990s. These differences in inbreeding tendencies depend
on both the effective population size and whether breeders have been working to stop the loss of
variability or not. Finally, the geographic zone has been marked as a factor of low relevance [31,32];
nevertheless, it has been studied due to its relation to differences in horse management, such as the
birth stud size factor, where the highest mean F values are produced in those countries and studs with
largest horse census. This can be attributed to, on the one hand, the scarce genetic exchange betweenAnimals 2020, 10, 1360 9 of 13
geographic zones and, on the other, the intensive or non-intensive use of certain breeders depending
on the stud size.
The fact that fe (33) is much lower than the real number of founders (1053) indicates a big loss
of genetic variability. In the same way, fa (19) is much lower than the number of ancestors which
account for 100% of the genetic variability (1023), which shows that this loss of genetic variability from
the parents to their progeny was the result of a genetic bottleneck. The results of the present study
show that fe was lower, whereas fa was higher than the values obtained by Valera et al. [21], 39 and
16, respectively, two generational intervals ago, demonstrating a lessening of the genetic erosion over
the last few years, when inbreeding has been actively avoided by breeders. Genetic variability lost
due to a bottleneck can be predicted using 1/(2fa ) and the current figure is 2.63%, a lower value than
two generational intervals ago (3.03%). The fe /fa ratio found in this study was 1.74, which indicates a
decrease in genetic variability caused by an unequal founder contribution, i.e., some breeding animals
become popular and produce more progeny than others. This has also been seen in other horse breeds,
such as the Campolina horse population [35] with an fe /fa ratio of 1.51, the Spanish Arab Horse [25]
with a ratio of 2.03% or in the Old Kladruber horse with a ratio of 5.40 [26].
Some studies revealed that closed populations, with multiple generations of intense directional
selection [36] and high reproductive success due to the use of advanced reproductive technologies [37,38],
tend to accumulate inbreeding and lose genetic variability. In our case, there is growing awareness about
the loss of genetic variability, therefore, breeders make a restrained use of reproductive technologies to
pair animals from different studs. This has led to a stabilization and a decrease in PRE inbreeding over
the last three decades. At the same time, having a ranking of all the animals with positive evaluations
for a variety of selection traits, such as dressage [3] or conformation [39], has allowed breeders to use
stallions and mares that stand out more for their genetic evaluation and less for their relationship with
their common ancestors. Even when all this is taken into account, some of the most important PRE
studs have serious problems due the high level of F and the consequent inbreeding depression, which
is clearly evidenced in reductions of body measurements in this breed [23].
Regarding the number of common ancestors by the group of F, it is notable that the F group with
the most individuals (F between 3.12% and 6.25%) has a similar ACA to the least numerous group,
F group ≥25.0%, both for stallions (84 and 84, respectively) and for mares (97 and 108, respectively).
The main difference is the proportion of Fij that the CA transmit to their descendants, which is much
higher in the second group (0.41% by stallions and 0.19% by mares) than in the first (0.04% by stallions
and 0.02% by mares). The main consequence of this is that knowing the amount of Fij that each CA
contributes to a descendant is more relevant than knowing its total number of ancestors. Moreover,
the fact that horses with F ≥ 25% have common ancestors that transmit the highest average Fij (both
stallions and mares) concurs with the idea that the mating of highly inbred common ancestors results
in offspring which also show high F values. In addition, despite the fact that stallions transmit the
highest Fij to their descendants, the number of mares that become common ancestors is higher.
The first researchers to work with the concept of Fij were James and McBride [40], who traced
the percentages of genes contributed by founders in a closed poultry flock from pedigree information.
Nowadays, although different publicly available programs exist for calculating Fij , none of them
was able to combine the partial inbreeding coefficient from founders and the Mendelian sampling
of non-founders until the appearance of the Casellas [16] approach. These authors worked with a
Maret rabbit population (2657 animals), in which a total of 43,635 Fij values were obtained, ranging
from 0.002% to 28.1%, and they described that each inbred rabbit had between 1 and 42 CAs. At a
later stage, Varona et al. [17] worked with beef cattle data, in the Pirenaica (308,836 animals) and
Rubia Gallega (384,434 animals) breeds. Ours is the first work to analyze equine breed data with this
methodology. Pirenaica and Rubia Gallega beef cattle data generated more than 16 and 5 million Fij
from 8721 and 3601 common ancestors and an average Fij of 0.15% and 0.057% with 5.9 and 3.9 average
generations, respectively. These results imply that the PRE population generates the biggest amount of
Fij values from a higher number of common ancestors (10,244), a lower average Fij value (0.042%) andAnimals 2020, 10, 1360 10 of 13
an intermediate census (328,706 animals) and complete generations (5.6). This means that the fact that
the PRE average F value is considerably higher than that of Pirenaica (3%) and Rubia Gallega (2%) is
due to the large number of ancestors that transmit a low Fij rather than to a low number of ancestors
transmitting a high Fij . This fact can be observed in Figure 1, too, where animals with the same F levels
have a greater number of common ancestors with a lower average Fij when the current generation is
compared with five generations ago.
As stated above, the last two generational intervals represent over 77% of the individuals registered
in the PRE studbook. From the studbook’s creation, in 1912, there has not been any change in horse or
foal registration policies, just the intensive efforts made by breeders to improve the breed and make it
more international have allowed this great increase, which shows that this breed is experiencing a period
of rapid growth. In addition, the efforts made in the breeding program to decrease inbreeding (with
selection and mating processes) have resulted in an increased number of animals becoming common
ancestors, which has already grown exponentially each generation. Inbreeding and average relatedness
values have shown similar behavior over generational intervals in both the total PRE population and
its common ancestors. It seems that, in the last generation, the increase in the average AR values was
less marked, which demonstrates that breeders are looking for less closely related individuals and
avoiding inbreeding, due to the fact that using animals with low AR values as breeders maintains the
genetic variability. On the other hand, over the generations, while the number of common ancestors
has increased, the average Fij that a common ancestor transmits to its descendants has decreased, the
opposite of which would be expected since the PRE breeding program started to be implemented
in 2003. The PRE breeding program is managed by ANCCE, and includes functional conformation,
dressage and riding abilities, in addition to morphology, as the main selection criteria [41,42]. The fact
the average Fij that a common ancestor transmits to its descendants has decreased is mainly due to
the increasing awareness among horse breeders about the inbreeding depression [2] and the better
information available about the animals’ breeding values, which enables them to choose the best
stallions and mares (also with the lowest AR) to obtain foals with the desired characteristics and less F,
thus reducing the average founder’s contribution to the population [34].
Nowadays, despite the large Pura Raza Español horse census, just 1023 ancestors account for
100% of the genetic variability, only seven of which are responsible for 50% of the population gene pool,
which is one more than reported by Valera et al. [21]. Americano and Destinada remain the two ancestors
with the highest contribution percentages, despite making a lower contribution to the total gene pool
than two generational intervals ago (Americano contribution has decreased from 15.7% to 13.9% and
that of Destinada from 12.6% to 11.8%). This coincides with the fact that both ancestors had a lower
percentage of descendants in the last generation than one generation before, which means that their
influence increased exponentially until the 1999–2008 interval but has decreased in the last generation.
On the other hand, Maluso now accounts for a bigger contribution percentage (from 5.37% to 6.7%) and
Celoso III (from 6.27% to 6.0%) and Zurrona (from 3.62% to 3.1%) for smaller percentages. As regards the
Fij they transmit, Americano and Destinada transmit to their descendants the highest average Fij values,
0.54% and 0.74%, respectively while Maluso, with an average transmitted Fij of 0.24%, transmits a large
proportion of partial inbreeding (≥6.25%) to the highest number of descendants, followed by Americano
and Celoso III. This fact could explain why Maluso has the lowest number of descendants in the last
generation (only 5% of his total descendants), while the other ancestors have around 40%, probably
because of the visible effects of inbreeding depression as reduction in reproductive parameters or
morphology measurements.
5. Conclusions
Breeders design horse’s matings in function of their breeding objectives, looking to fix certain
characteristics and the maximum influence of animals with great value, genetic or phenotypic.
The general idea in the past that mating related individuals establishes certain long-term traits isAnimals 2020, 10, 1360 11 of 13
demonstrated here with the use of certain animals from both the maternal and paternal lineages,
making them common ancestors.
To achieve this, apart from controlling inbreeding, the assessment of genetic contributions from
founders and ancestors of the current population has provided us with a better understanding of the
changes that take place in the genetic pool of this breed. The efforts made to reduce the average F
over the last generations have been mainly possible thanks to our increased knowledge about the
animals’ relatedness (offspring’s inbreeding) and to the effectiveness of the breeding program to
provide breeders with breeding values, which increases their options of successfully choosing new
animals regardless of their pedigree or the breeder’s prestige. Therefore, in addition to carrying
out a systematic control of the inbreeding level both in the total population and within studs, it is
important to determine the reasons that a certain ancestor is being used so intensely that it determines
an increase in the kinship between the breeding animals and therefore a loss of variability, both in the
total population and within certain studs.
Author Contributions: Conceptualization, M.V. and A.M.; Methodology, D.I.P.-G., M.J.S.-G. and A.M.; Formal
Analysis, D.I.P.-G. and M.V.; Data Curation, A.M. and M.J.S.-G.; writing—original draft preparation, D.I.P.-G.;
Investigation, Writing—Review and Editing, Visualization and Supervision, all authors. All authors have read
and agreed to the published version of the manuscript.
Funding: This research was funded by the AGL-2017-84217-P Research project from Ministerio de Economía,
Industria y Competitividad of the Spanish Government.
Acknowledgments: The authors wish to thank the Pura Raza Español Horse Breeders Association for the data
and Joaquim Casellas and Luis Varona for the approach used and their expert knowledge.
Conflicts of Interest: The authors declare no conflict of interest.
References
1. MAPA, Ministerio de Agricultura Pesca y Alimentación. Catálogo Oficial de Razas. Pura Raza Español. 2020.
Available online: https://www.mapa.gob.es/es/ganaderia/temas/zootecnia/razas-ganaderas/razas/catalogo/
autoctona-fomento/equino-caballar/espanola/iframe-ejemplo-arca.aspx (accessed on 3 April 2020).
2. Solé, M.; Valera, M.; Fernández, J. Genetic structure and connectivity analysis in a large domestic livestock
meta-population: The case of the Pura Raza Español horses. J. Anim. Breed. Genet. 2018, 135, 460–471.
[CrossRef]
3. Sánchez-Guerrero, M.J.; Cervantes, I.; Valera, M.; Gutiérrez, J.P. Modelling genetic evaluation for dressage in
pura raza español horses with focus on the rider effect. J. Anim. Breed. Genet. 2014, 131, 395–402. [CrossRef]
[PubMed]
4. Woolliams, J.A.; Berg, P.; Dagnachew, B.S.; Meuwissen, T.H.E. Genetic contributions and their optimization.
J. Anim. Breed. Genet. 2015, 132, 89–99. [CrossRef] [PubMed]
5. Málecot, G. Mathématiques de l’Hérédité; Masson: Paris, France, 1948.
6. Lacy, R.C.; Alaks, G.; Walsh, A. Hierarchical Analysis of Inbreeding Depression in Peromyscus polionotus.
Evolution 1996, 50, 2187–2200. [CrossRef] [PubMed]
7. Caballero, A.; Toro, M.A. Interrelations between effective population size and other pedigree tools for the
management of conserved populations. Genet. Res. 2000, 75, 331–343. [CrossRef] [PubMed]
8. García-Cortés, L.A.; Martínez-Ávila, J.C.; Toro, M.A. Fine decomposition of the inbreeding and the coancestry
coefficients by using the tabular method. Conserv. Genet. 2010, 11, 1945–1952. [CrossRef]
9. Lacy, R.C. Importance of Genetic Variation to the Viability of Mammalian Populations. J. Mammal. 1997, 78,
320–335. [CrossRef]
10. Rodrigáñez, J.; Toro, M.A.; Rodriguez, M.C.; Silió, L. Effect of founder allele survival and inbreeding
depression on litter size in a closed line of Large White pigs. Anim. Sci. 1998, 67, 573–582. [CrossRef]
11. Maccluer, J.W.; Boyce, A.J.; Dyke, B.; Weitkamp, L.R.; Pfenning, D.W.; Parsons, C.J. Inbreeding and pedigree
structure in standardbred horses. J. Hered. 1983, 74, 394–399. [CrossRef]
12. Maignel, L.; Boichard, D.; Verrier, E. Genetic variability of French dairy breeds estimated from pedigree
information. Interbull Bull 1996, 14, 49–54.
13. Wright, S. Evolution in Mendelian Populations. Genetics 1931, 16, 0097–0159.Animals 2020, 10, 1360 12 of 13
14. Gutiérrez, J.P.; Altarriba, J.; Díaz, C.; Quintanilla, R.; Cañón, J.; Piedrafita, J. Pedigree analysis of eight Spanish
beef cattle breeds. Genet. Sel. Evol. 2003, 35, 43–63. [CrossRef] [PubMed]
15. Boichard, D.; Maignel, L.; Verrier, É. The value of using probabilities of gene origin to measure genetic
variability in a population. Genet. Sel. Evol. 1997, 29, 5–23. [CrossRef]
16. Casellas, J. On individual-specific prediction of hidden inbreeding depression load. J. Anim. Breed. Genet.
2018, 135, 37–44. [CrossRef]
17. Varona, L.; Altarriba, J.; Moreno, C.; Martínez-Castillero, M.; Casellas, J. A multivariate analysis with direct
additive and inbreeding depression load effects. Genet. Sel. Evol. 2019, 51, 78. [CrossRef] [PubMed]
18. Gutiérrez, J.P.; Goyache, F. A note on ENDOG: A computer program for analysing pedigree information.
J. Anim. Breed. Genet. 2005, 122, 172–176. [CrossRef]
19. IBM Corp. IBM SPSS Statistics for Windows; Version 25.0.; IBM Corp: Armonk, NY, USA, 2017.
20. Poyato-Bonilla, J.; Sánchez-Guerrero, M.J.; Santos, R.D.; Valera, M. Population study of the Pura Raza Español
Horse regarding its coat colour. Ann. Anim. Sci. 2018, 18, 723–739. [CrossRef]
21. Valera, M.; Molina, A.; Gutiérrez, J.P.; Gómez, J.; Goyache, F. Pedigree analysis in the Andalusian horse:
Population structure, genetic variability and influence of the Carthusian strain. Livest. Prod. Sci. 2005, 95,
57–66. [CrossRef]
22. Cervantes, I.; Goyache, F.; Molina, A.; Valera, M.; Gutiérrez, J.P. Application of individual increase in
inbreeding to estimate realized effective sizes from real pedigrees. J. Anim. Breed. Genet. 2008, 125, 301–310.
[CrossRef]
23. Gómez, M.D.; Valera, M.; Molina, A.; Gutiérrez, J.P.; Goyache, F. Assessment of inbreeding depression for
body measurements in Spanish Purebred (Andalusian) horses. Livest. Sci. 2009, 122, 149–155. [CrossRef]
24. Gómez, M.D.; Sánchez, M.J.; Bartolomé, E.; Cervantes, I.; Poyato-Bonilla, J.; Demyda-Peyrás, S.; Valera, M.
Phenotypic and genetic analysis of reproductive traits in horse populations with different breeding purposes.
Animal 2020, 1–11. [CrossRef] [PubMed]
25. Cervantes, I.; Molina, A.; Goyache, F.; Gutiérrez, J.P.; Valera, M. Population history and genetic variability in
the Spanish Arab Horse assessed via pedigree analysis. Livest. Sci. 2008, 113, 24–33. [CrossRef]
26. Vostrá-Vydrová, H.; Vostrý, L.; Hofmanová, B.; Krupa, E.; Zavadilová, L. Pedigree analysis of the endangered
Old Kladruber horse population. Livest. Sci. 2016, 185, 17–23. [CrossRef]
27. Vicente, A.A.; Carolino, N.; Gama, L.T. Genetic diversity in the Lusitano horse breed assessed by pedigree
analysis. Livest. Sci. 2012, 148, 16–25. [CrossRef]
28. Zechner, P.; Sölkner, J.; Bodo, I.; Druml, T.; Baumung, R.; Achmann, R.; Marti, E.; Habe, F.; Brem, G.
Analysis of diversity and population structure in the Lipizzan horse breed based on pedigree information.
Livest. Prod. Sci. 2002, 77, 137–146. [CrossRef]
29. da Silva Faria, R.A.; Vicente, A.P.A.; dos Santos, R.I.D.G.; Maiorano, A.M.; Curi, R.A.; Chardulo, L.A.L.;
Vasconcelos Silva, J.A. Genetic Diversity of Lusitano Horse in Brazil Using Pedigree Information. J. Equine
Vet. Sci. 2018, 69, 149–158. [CrossRef]
30. Sánchez-Guerrero, M.J.; Negro-Rama, S.; Demyda-Peyras, S.; Solé-Berga, M.; Azor-Ortiz, P.J.;
Valera-Córdoba, M. Morphological and genetic diversity of Pura Raza Español horse with regard to
the coat colour. Anim. Sci. J. 2019, 90, 14–22. [CrossRef]
31. Sánchez-Guerrero, M.J.; Solé, M.; Azor, P.J.; Sölkner, J.; Valera, M. Genetic and environmental risk factors for
vitiligo and melanoma in Pura Raza Español horses. Equine Vet. J. 2019, 51, 1–6. [CrossRef]
32. Sánchez, M.J.; Azor, P.J.; Molina, A.; Parkin, T.; Rivero, J.L.L.; Valera, M. Prevalence, risk factors and genetic
parameters of cresty neck in Pura Raza Español horses. Equine Vet. J. 2017, 49, 196–200. [CrossRef]
33. Müller-Unterberg, M.; Wallmann, S.; Distl, O. Effects of inbreeding and other systematic effects on fertility of
Black Forest Draught horses in Germany. Acta Vet. Scand. 2017, 59, 70. [CrossRef]
34. Giontella, A.; Pieramati, C.; Silvestrelli, M.; Sarti, F.M. Analysis of founders and performance test effects on
an autochthonous horse population through pedigree analysis: Structure, genetic variability and inbreeding.
Animal 2019, 13, 15–24. [CrossRef] [PubMed]
35. Bussiman, F.O.; Perez, B.C.; Ventura, R.V.; Peixoto, M.G.C.D.; Curi, R.A.; Balieiro, J.C.C. Pedigree analysis
and inbreeding effects over morphological traits in Campolina horse population. Animal 2018, 12, 1–10.
[CrossRef] [PubMed]
36. Robertson, A. Inbreeding in artificial selection programmes. Genet. Res. 1961, 2, 189–194. [CrossRef]Animals 2020, 10, 1360 13 of 13
37. Nicholas, F.W.; Smith, C. Increased rates of genetic change in dairy cattle by embryo transfer and splitting.
Anim. Prod. 1983, 36, 341–353. [CrossRef]
38. Azcona, F.; Valera, M.; Molina, A.; Trigo, P.; Peral-García, P.; Solé, M.; Demyda-Peyrás, S. Impact of
reproductive biotechnologies on genetic variability of Argentine Polo horses. Livest. Sci. 2020, 231, 103848.
[CrossRef]
39. Sánchez, M.J.; Gómez, M.D.; Molina, A.; Valera, M. Genetic analyses for linear conformation traits in Pura
Raza Español horses. Livest. Sci. 2013, 157, 57–64. [CrossRef]
40. James, J.W.; McBride, G. The spread of genes by natural and artificial selection in closed poultry flock.
J. Genet. 1958, 56, 55–62. [CrossRef]
41. Sánchez-Guerrero, M.J.; Cervantes, I.; Molina, A.; Gutiérrez, J.P.; Valera, M. Designing an early selection
morphological linear traits index for dressage in the Pura Raza Español horse. Animal 2017, 11, 948–957.
[CrossRef]
42. Sánchez-Guerrero, M.J.; Gómez, M.D.; Molina, A.; Valera, M. Assessment scores in morphological
competitions of Pura Raza Español horse. Int. J. Agric. Biol. 2014, 16, 557–563.
© 2020 by the authors. Licensee MDPI, Basel, Switzerland. This article is an open access
article distributed under the terms and conditions of the Creative Commons Attribution
(CC BY) license (http://creativecommons.org/licenses/by/4.0/).You can also read