THE ARTISANAL AND SMALL SCALE MINING SECTOR IN EASTERN DRC SIX MONTHS AFTER THE COVID-19 OUTBREAK - IPIS insights
←
→
Page content transcription
If your browser does not render page correctly, please read the page content below
IPIS insights

THE ARTISANAL AND SMALL SCALE
MINING SECTOR IN EASTERN DRC
SIX MONTHS AFTER THE COVID-19
OUTBREAK
The artisanal and small scale mining sector in eastern DRC six months after the Covid-19 outbreak
Antwerp, March 2021
Authors: Ken Matthysen, Lotte Hoex, Thomas Muller, Guillaume de Brier
Researchers: Guillaume Ntangamyampi Alininyu, Lavoisier Lukindula Assumani, Anyasi Kitoko Beauvalot,
Augustin Djamugisa Bedidjo, Jibrown Nabyenda Bengehya, Zacharie Bulakali, Guillaume de Brier, Edgar
Kakule Kamaliro, Ken Matthysen, Bertin Nyamuhirwa Muganuza, Prosper Tumba Wangozi.
Data analysis: Thomas Muller
Cover picture: Mining site Lwate, Lubero territory, DRC
To quote this report, please use the following reference:
Matthysen, K, Hoex, L. Muller, T., de Brier, G. The artisanal and small scale mining sector in eastern DRC six
months after the Covid-19 outbreak, IPIS, March 2021.
D/2021/4320/04

This document has been produced with the financial assistance of the European Union.
The contents of this document are the sole responsibility of the authors and can under
no circumstances be regarded as reflecting the position of the European Union.

                                                      2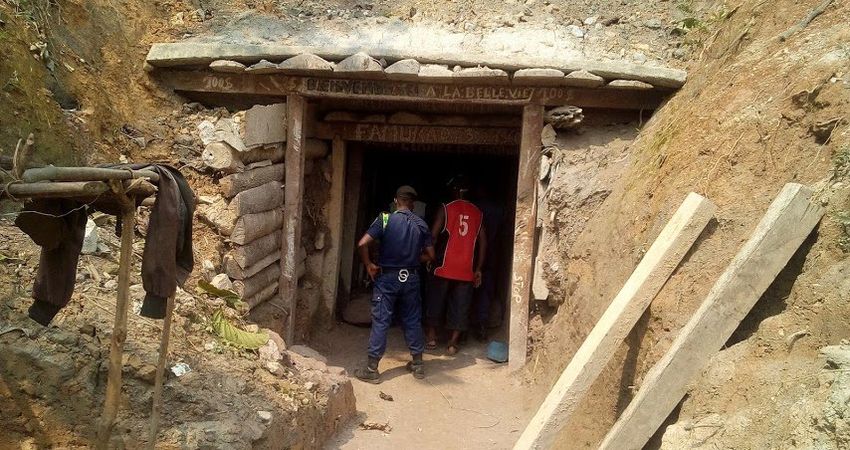
TABLE OF CONTENTS
1. Introduction...................................................................................................................................... 4

2. Covid-19 in eastern DRC................................................................................................................... 5
    2.1. The arrival of Covid-19 in DRC..............................................................................................................................5
    2.2. Sanitary measures.....................................................................................................................................................5
    2.3. Disruption of mineral trade...................................................................................................................................6

3. Methodology.................................................................................................................................... 7

4. Mineral trade.................................................................................................................................... 9
    4.1.      Number of mineral traders....................................................................................................................................9

5. Mineral prices..................................................................................................................................11
    5.1.      Gold.............................................................................................................................................................................11
    5.2. Cassiterite...................................................................................................................................................................14

6. Production...................................................................................................................................... 16
    6.1. Evolution of numbers of mine workers...........................................................................................................16
    6.2. Analysis of impact of Covid-19...........................................................................................................................17
    6.3. Other factors linked to Covid-19 impacting production...........................................................................17
    6.4. Factors unrelated to Covid-19 impacting production ...............................................................................18

7. Fall of the local economy............................................................................................................... 20

8. Security situation at mining sites................................................................................................. 22
    8.1. Mining Police........................................................................................................................................................... 22
    8.2. FARDC........................................................................................................................................................................ 22
    8.3. Armed groups......................................................................................................................................................... 23

9. Conclusion....................................................................................................................................... 24

10. Appendices.................................................................................................................................... 26

                                                                                              3
1. INTRODUCTION
In April 2020, when the Coronavirus spread around the world, IPIS took the initiative to monitor the
impact of the pandemic on the production and trade of the artisanal and small-scale mining (ASM) sector
in eastern Democratic Republic of the Congo (DRC).
IPIS published a report in October 2020 that discussed the results of several rounds of consultations with
ASM stakeholders at nearly 90 Tin, Tantalum, Tungsten and Gold (3TG) mining sites in eastern DRC,
conducted between May and June 2020.1
At that time, ASM stakeholders seemed to fear the economic collapse as much as the virus. When DRC
and neighbouring countries closed their borders, all mineral processing houses reported great difficulty
to export; all they could do was to stock their minerals until export would be feasible again. Due to
export difficulties, processing houses did not get any income. Therefore, many ceased to prefinance
traders. Consequently, traders ran low in cash and many of them stopped visiting mining sites. The lack of
liquidity among local traders forced miners to accept significant lower prices for their mineral production,
resulting into a socioeconomic crisis for local mining communities.
In October 2020, IPIS organized another round of consultations at the same 87 mining sites, in order
to evaluate the impact of Covid-19 on ASM on the medium term, six months after Covid-19 reached
eastern DRC.
Observations made in October 2020 showed that many people in mining communities believed that
Covid-19 was over. Restrictive measures were no longer respected, neither controlled by government
agents. Nevertheless, this report will discuss the extent to which the socioeconomic impact on the ASM
sector was still being felt.

1   IPIS, The impact of Covid-19 on the artisanal mining sector in eastern DRC, October 2020, https://ipisresearch.be/publication/the-impact-of-covid-19-on-the-
    artisanal-mining-sector-in-eastern-drc/

                                                                              4
2 METHODOLOGY
In order to enable comparative analysis, IPIS used the same methodology (including same questionnaires)
in October 2020 as it did in the first half of 2020.
Over the years, IPIS has built a network of contacts covering most of the 2,400 mining sites it visited over the
past decade, which represent virtually all relevant mining areas of eastern DRC. The data of these mining
sites can be consulted on the IPIS interactive webmap2, and open data dashboard3. For the purpose of this
research, IPIS researchers contacted this network to collect information on the impact of Covid-19 on a
range of selected mining sites located in Ituri, Maniema, North Kivu and South Kivu (Table 1).
Between May and June 2020, IPIS researchers conducted telephone interviews with representatives of
13 processing houses and 87 3TG mining sites, including mine managers, cooperative leaders, traders,
village chiefs, and mining state agents. For each mining site, respondents were consulted four times, i.e.
once every two weeks.
After these initial 4 rounds of consultation, and accompanying report,4 a new round of telephone surveys
(‘Round 5’) was organised in October 2020.
The mining sites were selected from IPIS’ database based on two criteria:
• Mining sites visited relatively recently by IPIS, i.e. between June 2018 and December 2019;
• Mining sites that employed a considerable number of miners – at least 200 for gold sites and at least
  100 for 3T sites.
Since all of the selected 3TG mining sites had been visited fairly recently, we considered the data from
2018 and 2019 as being the pre-Covid-19 ‘Baseline data’.
All the selected mining sites have been consulted five times, i.e. five rounds of data collection. For the
analysis of this report we will compare the baseline data with data from rounds 1, 4 and 5:
• Round 1 – refers to the period running from 7 May to 19 May 2020;
• Round 4 – 19 June to 4 July 2020;
• Round 5 – 10 October to 4 November 2020
A combination of multiple-choice and open-ended questions was asked to the mining stakeholders. The
open-ended questions allowed the respondents to detail their observations.

Table 1: Number of mining sites studied per province in October 2020 (Round 5)

    Data collection round                                                            Number of mining sites surveyed
    Ituri                                                                            12
    Maniema                                                                          35
    North Kivu                                                                       11
    South Kivu                                                                       28
    Total                                                                            86

It is noteworthy that the 86 mining sites selected for this study are those for which IPIS received answers
by key informants on sites during the different rounds of phone surveys. Therefore, the final selection
of the mines could not result from a sampling strategy that aimed to be representative of the artisanal
mining sector in eastern DRC. Rather than being generalisable to the whole study area, this study aims

2      Interactive webmap of artisanal mining areas and mineral supply chains in eastern DRC: https://ipisresearch.be/mapping/webmapping/drcongo/v6/#-3/28/5/4/1/
3      See IPIS Open Data Dashboard (https://ipisresearch-dashboard.shinyapps.io/open_data_app/)
4      IPIS (October 2020), op. cit.

                                                                                 5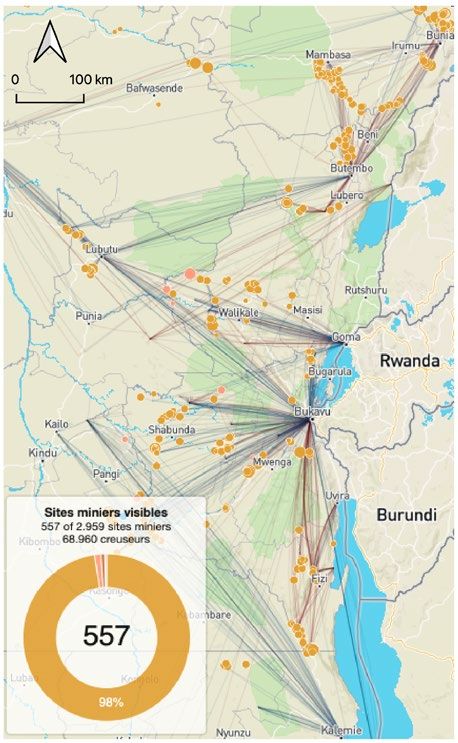
to be indicative in providing a unique insight into the short and medium-term impacts of the Covid-19
pandemic on the mining sector in eastern DRC.
All statistical and geospatial analyses were performed using R version 4.0.2.

 Figure 1: Map of the 86 selected 3TG mining sites in eastern DRC

                                                          6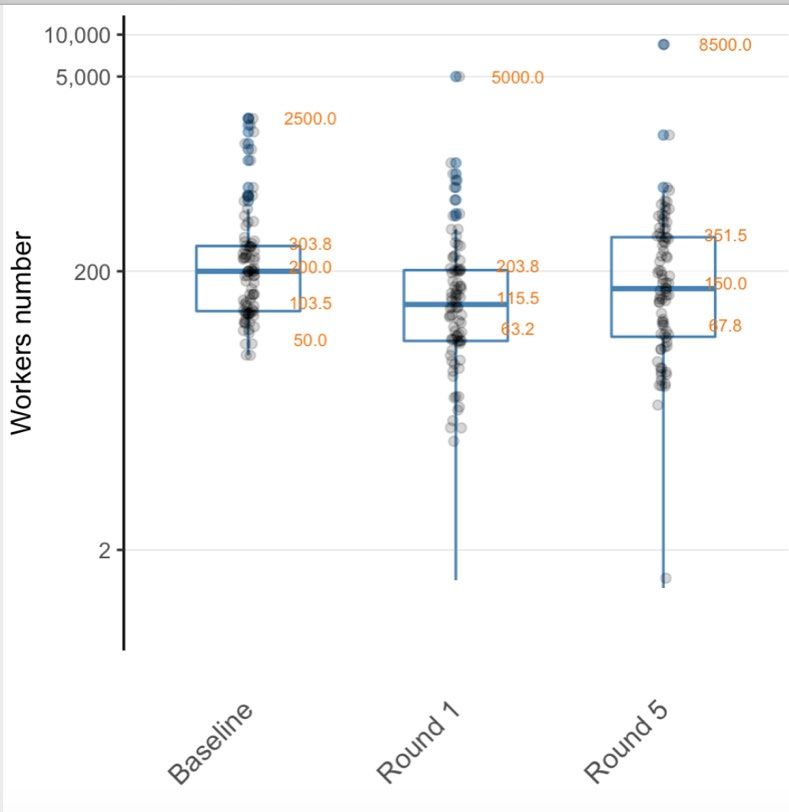
3. MINERAL TRADE
In October 2020, mineral trade seemed to have recovered to a certain extent, following the collapse in the
first half of 2020. The preceding report discussed how export difficulties and a lockdown in Bukavu disrupted
mineral trade. Mineral prices decreased, local traders ran low in cash, and pre-financing of mining operations
came to a standstill. Widespread cash flow problems even resulted in increasing levels of barter trade.5
The current report will discuss how mineral prices have since increased considerably (section 3.1), as well
as the number of traders (section 3.2). Cash flow problems however persisted and continued to affect
mineral trade.
It is important to note that there are key regional differences with regards to mining and mineral trade,
which are discussed in detail in the appendix of the report.

3.1. MINERAL PRICES

3.1.1.       Gold

By October 2020, gold prices had largely recovered at the level of the mining sites, after the collapse at the
start of the Covid-19 crisis (‘Round 1’). Table 2 shows that the average gold price per gram rose from 32.0
US$ in 2018-2019 (‘Baseline’), to 45.9 US$ in October 2020 (‘Round 5’), which represents a 43% increase.

Table 2: Gold price at the level of the mining site, US$/g6

    Data collection round                    Average              % world market price                   Median              % world market price
    Baseline (47 mines)                      32.0                 77%                                    32.9                80%
    Round 1 (48 mines)                       28.5                 51%                                    28.3                50%
    Round 4 (45 mines)                       38.9                 69%                                    40.6                72%
    Round 5 (48 mines)                       45.9                 75%                                    44.3                73%

                                                                                        The preceding report explained how the evolution
                                                                                        of the world market price for gold masked the
                                                                                        actual impact of the crisis on the local price levels.
                                                                                        Table 2 and Figure 2 clearly show that relative
                                                                                        prices have decreased much more drastically
                                                                                        during the height of the crisis. While the average
                                                                                        price at the level of the mining sites was 77% of
                                                                                        the world gold market price prior to Covid-19, it
                                                                                        plummeted to 51% early May 2020 before it
                                                                                        experienced a gradual rebound. By late June
                                                                                        (Round 4), relative gold prices already largely
                                                                                        recovered to 69%, but artisanal miners did not yet
                                                                                        get the same share of the gold market value
                                                                                        compared to the pre-Covid-19 era. In October
                                                                                        2020, gold prices reached an average of 75% of the
                                                                                        market prices approaching the level of the pre-
                                                                                        Covid-19 period.

    Figure 2: Price of gold at the level of the mining site compared to world market price (% of world market price)

5      IPIS (October 2020), op. cit., pp. 9-10.
6      The selling price of gold in the mining sites was calculated as a percentage of the gold market price using averaged monthly data from https://goldprice.org

                                                                                    7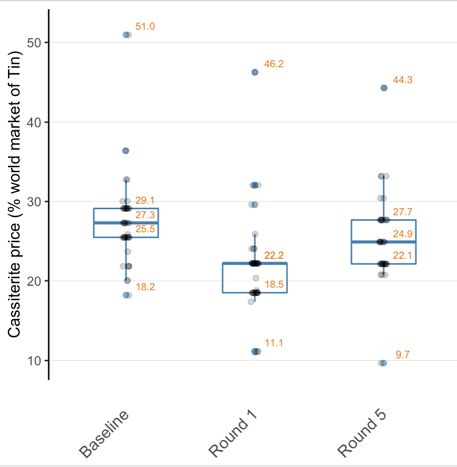
All of the figures and tables below express the weight of gold in (metric) gram. However,
         in eastern DRC, at the level of the mining sites and local trading hubs, the ‘Kitchele’ is
         more commonly used as the unit of weight for gold. One Kitchele equals about 1.28
         metric grams. In order to enable comparative analysis, all gold weights in the tables and
         figures have been converted into metric gram. Furthermore, all price levels have been
         converted from Congolese Francs (FC) into US$.

         Moreover, it is noteworthy that the price of gold per gram reported at the level of the
         site does not always perfectly reflect the actual selling price per gram. At several mines,
         traders buy gold through the system called ‘loterie’, meaning that they do not use a
         balance to weigh the gold but they assess the value just by looking at the production.

All the provinces experienced this general trend, even though the actual values are a bit lower in the
northern areas of our sample (see figure 3 and the appendix). After a price collapse in March-April 2020,
prices quickly recovered to a large extent in June-August 2020, but stagnated in September-October 2020.
Around Kamituga (South Kivu), for example, the price of gold had collapsed in March-April 2020 to 50,000
FC per Kitchele. By the end of June 2020, prices had increased again to 95,000 FC, while in July-August
2020, they even rose to 150,000-155,000 FC. Afterwards, in September-October, prices lowered a bit, varying
between 140,000 and 145,000 FC per Kitchele. In Lubutu territory (Maniema), prices rose to about 90,000
FC per Kitchele in October 2020, while in Beni territory (North Kivu) and Ituri, they were around 100,000 FC.
Near Kampene and Bikenge trading hubs (southern part of Maniema), prices varied around 130,000 FC.
Interviewees, however, claimed that the price was higher before the Covid-19 crisis, at 150,000 F,.

 Figure 3 – Map showing the temporal evolution of gold prices (% of world market price) at the mining sites between
 the baseline study and October 2020 (Round 5).

Figure 3 shows that the gold price is higher (yellow dots in ‘baseline’ and ‘round 5’ in figure 3) in Bikenge,
Kampene (Maniema province) and South Kivu, compared to the sites in Beni territory (North Kivu) and
Ituri, in our sample. This difference is not related to Covid-19, as the difference persists throughout the
different rounds. The reason is not clearly established but one hypothesis could be the quality of the
gold. Amalgamated gold (which has been treated with mercury to extract the gold) is less dense, hence

                                                         8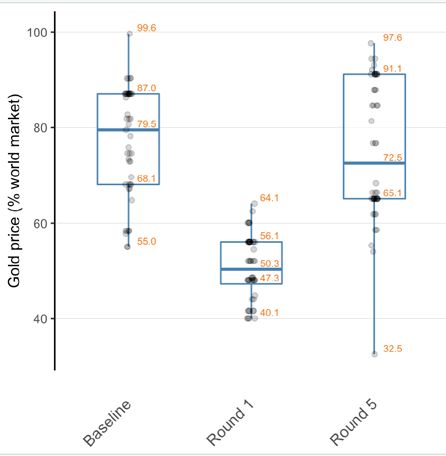
cheaper, than alluvial gold7. Mercury use actually
                                                                                         seems to be more common in Ituri, compared to
                                                                                         South Kivu. For the gold mining sites selected for
                                                                                         this study, mercury use has been observed during
                                                                                         the ‘baseline’ at 9 out of 12 sites in Ituri (75%),
                                                                                         compared to 4 out of 11 in South Kivu (36%). 8
                                                                                         Another possible explanation can be linked to the
                                                                                         trading routes. While gold from South Kivu, Bikenge
                                                                                         and Kampene passes by Bukavu, gold from Ituri and
                                                                                         Beni is traded via Butembo and Bunia (see figure 4).

                                                                                            Figure 4 – Screenshot of the IPIS interactive webmap9
                                                                                            showing the destination of mineral production per
                                                                                            mining site

                                                                                         In conclusion, gold prices relative to the world
                                                                                         market price collapsed around March-April 2020,
                                                                                         at the height of the crisis. The relative prices
                                                                                         quickly recovered after the international borders
                                                                                         re-opened and trade revived. In October 2020, the
                                                                                         relative gold prices (on average 75% of the world
                                                                                         market price) are close to the level of the relative
                                                                                         gold prices before the outbreak of Covid-19 (on
                                                                                         average 77% of the world market price).

3.1.2. Cassiterite

Table 3: Cassiterite price at the level of the mining site, US$/kg

    Data collection round                   Average             % world market tin price                    Median             % world market tin price
    Baseline (41 mines)                     4.5                 27%                                         4.5                27%
    Round 1 (38 mines)                      3.4                 22%                                         3.5                22%
    Round 4 (38 mines)                      4.0                 24%                                         4.0                24%
    Round 5 (38 mines)                      4.7                 25%                                         4.6                25%

The evolution of cassiterite prices is quite similar to the evolution of gold prices. Table 3 shows that average
cassiterite prices at the level of the mine were 24% lower early May (3.4 US$/kg), compared to our baseline
data from 2018/2019 (4.5 US$/kg). By the end of June 2020 (‘Round 4’), prices had partly recovered, up to
4.0 US$/kg, but they were still 11% below the pre-Covid-19 price levels (‘Baseline’ at 4.5 US$).

7      Alluvial gold deposits form over time where a river runs, or has previously run through ground which is rich in gold. The erosive power of the water removes the
       surrounding rock due to its comparative low density while the heavier gold resists being moved. Alluvial gold usually takes the form of dust, thin flakes or nuggets.
       In https://www.cdeglobal.com/applications/gold/alluvial-gold-mining
8      The difference in mercury use between Ituri and South Kivu can also be observed when consulting all of the gold mining sites in IPIS’ database. For the gold mining
       sites visited by IPIS since June 2018, mercury use has been observed at 52% of the sites in Ituri (66 out of 127 sites), compared to 23% in South Kivu (30 out of 129
       sites). (Source: Artisanal mining in DR Congo – IPIS Open Data Dashboard: https://ipisresearch-dashboard.shinyapps.io/open_data_app/ )
9      https://ipisresearch.be/mapping/webmapping/drcongo/v6/#-1.360750477318092/29.34577753644362/6.100961810003449/4/1,6/2.1nxkao

                                                                                     9
In October 2020, average prices had surpassed
the baseline level, which may however be partially
due to increasing tin prices on the world market
between May and October 2020 (from 16.0 to18.4
US$/kg).10 Consequently, miners still got a slightly
smaller part of the value of cassiterite compared
to period prior to Covid-19, relative to the world
market price. (See figure 5)
Figure 5: Price of cassiterite at the level of the mining
site compared to world market tin price (% of world
market tin price)
Figure 6 – Map showing the temporal evolution of Cassiterite prices (% of Tin world market price) at the mining sites
between the baseline study and October 2020 (Round 5).
Figure 6 reveals that, in general, cassiterite mines in both Maniema and South Kivu experienced the same
trend. Cassiterite prices relative to the world market tin prices decreased in March-April 2020 (‘Round1’)
compared to the pre-Covid-19 period (‘Baseline’). By October 2020 (‘Round 5’), relative cassiterite prices
had partly recovered.
3.2 NUMBER OF TRADERS
Besides the substantial recovery of mineral prices, table 4 suggests that the average number of traders
has also significantly increased between May and October 2020. These results should however be
interpreted with caution. Firstly, the artisanal mining context is very dynamic, meaning that many other
factors (besides the impact of Covid-19) influence trade dynamics. For example, gold traders (managers)
did not have the habit to go up to the mine of Golgotha (Kamituga area) in the past. However, since some
10 Source: https://www.lme.com/en-GB/Metals/Non-ferrous/Tin#tabIndex=2
10crushers (concasseurs) have been installed on site, traders started buying gold at the level of the mine in
October 2020. This example illustrates a growing number of traders on site that has no relationship with
the outbreak of Covid-19. Secondly, the differences observed between May and October 2020 are greatly
influenced by variations in just a few mining sites with a relatively high number of traders, which explains
why the median estimates remain stable over time.
Table 4: Number of traders visiting the mining site per week
Data collection round Average per mining site Median Min Max
round_1 (86 mines) 4.3 2 0 100
round_4 (84 mines) 4.4 2 0 50
round_5 (86 mines) 6.6 2 0 150
Furthermore, a closer look reveals that serious trade issues persist. In many areas, interviewees explained
how cash flow problems still exist, as several processing houses (‘comptoirs’) in Kindu and Bukavu still
have difficulty to export and acquire funds from their international partners.
Although mineral traders are circulating again in most places, they often do not have the same purchasing
power as prior to the Covid-19 crisis. Additionally, traders’ cash flow problems continue to disturb the
traditional pre-financing of mining activities. Some miners complained that buyers only bought gold
that was readily available, and no longer pre-finance operations to be reimbursed in gold afterwards.
“Actuellement, les boss n’ont plus d’argent pour pré-financer les travaux avant la production.
Normallement, on rembourse les boss avec cette production, mais aujourd’hui, ils ne parlent
qu’avec les creuseurs qui ont déjà de l’or”
A mine manager, so-called PDG, near Kamituga (South Kivu)
Mining sites around the major cassiterite hub Kalima, for example, started to produce minerals, but local
traders’ cash flow problems continued to affect mineral trade. In October 2020, two (out of three) Kindu-
based comptoirs, notably Metachem and AMUR, had not yet resumed purchasing from Kalima and Kailo.
While cassiterite prices had increased by October 2020, miners experienced difficulty to actually sell their
production, as traders struggled with a lack of cash.
114. PRODUCTION
Table 5: Number of miners estimated per reference period
Data collection round Total number of mine workers Average per site Median Min Max SD*
Baseline (86mines) 31,385 365 200 50 2,500 517.37
Round 1 (85 mines) 20,350 237 116 0 5,000 562.58
Round 4 (84 mines) 26,554 316 120 5 7,550 849.57
Round 5 (83 mines) 28,847 335 150 0 8,500 929.38
*SD = Standard Deviation
Figure 7: Number of miners per reference period
(logarithmic scale)
The evolution of the number of miners, as
presented in table 5 and figure 7, indicates that
artisanal mining has recovered gradually since the
height of the crisis (Round 1)11. Artisanal mining
increased, as mineral trade largely recovered, and
money is circulating.
At the level of the mining sites, mining activity (i.e.
the number of miners) is however not everywhere
back at the pre-Covid-19 levels. This difference
is linked to a variety of factors, related both to
Covid-19 and some other dynamics. These factors
include seasonality (rains), (non-)availability of
pre-financing, operational challenges at site level
and the security situation. A summary of some
of regional differences is described below, more
details on the evolution of number of miners per province can be found in the Appendix.
For instance, heavy rainfall in October 2020, combined with a lack of pre-financing following the
Covid-19 crisis, seriously impacted production in several areas. Around the cassiterite trading hubs of
Nzibira and nearby Luntukulu (Walungu territory, South Kivu), interviewees explained that flooding of
mine pits requires investments in motor pumps and fuel to enable production to continue. Low mineral
prices during the Covid-19 crisis, however, discouraged managers (or traders, providing pre-financing) to
make such investments as they were afraid to lose money in the end. This context explains the decreasing
number of miners between June and October 2020 (Round 4 to 5, see appendix 8.1). On the contrary, in
North Kivu, a strong decrease in number of miners could already be observed in June 2020 (round 4), as
heavy rains seriously hampered gold production around Beni in that period.
« il n’y a plus de Boss qui donne des prêts pour financer des travaux lourds »
PDG at Kazibe
11 A paired t-test shows a significant increase in number of workers between May and October 2020 with p < 0.001. A statistical comparison between Baseline and
October 2020 does not show any significant difference (p = 0.3). The calculation of Global Moran’s I index indicates that no spatial auto-correlation may affect the
validity of the statistical tests (Global Moran’s I ranging around 0 from -0.02 to 0.008).
12Additionally, in South Kivu, new promising discoveries appeared at the mining sites Chosho/Tchoncho
(cassiterite, groupement Kaniola in Walungu) and Luhihi (gold, Kabare territory). This presented an
additional incentive for miners around Nzibira to leave the area, for mines where minerals are still more
easily accessible.
In Kalima (Maniema province), interviewees explained how traders’ cash flow problems started to
disincentivise mineral production in October 2020. There have even been reports that these cash flow
problems resulted once again in barter trade: cassiterite was directly traded for consumer goods.
Moreover, very local factors might impact the mining activity. At some cassiterite mines in Mwenga
territory (Kashwa, Misela and Mayengo), interviewees complained that a local trade monopoly by the
cooperative negatively impacted trade and production. Furthermore, in Irumu territory, interviewees
referred to the arrival of some semi-industrial investors. At the three mining sites Manzanza, Cartusi
and Murondo (Irumu territory, Ituri), there were no miners left in October 2020. During the peak of the
Covid-19 crisis, when production, trade and prices plummeted, Chinese investors acquired access to
these three mines and reportedly depleted them.
The security situation and the interference of armed actors are also important factors to consider in
eastern DRC. The preceding report discussed how the surrender of Raïa Mutomboki chief Maheshe had
a positive impact on productivity in Walungu. A strong increase in the number of miners had for example
been observed at Mushangi D8, from around 150 early May to almost 600 miners by the end of June
2020.12 Nevertheless, some insecurity has been reported more to the north of Nzibira in Kabare territory,
as some of Maheshe’s men defected and shelter in the mountains in Nindja territory and regularly pass
by Muhinga mining site. (See text box)
The rebel leaders Shabadeux Mazi and Shagalu defected from Maheshe’s Raïa Mutomboki
early 2020, as they did not agree with the latter to surrender to MONUSCO in May 2020.
They have established themselves in the chefferie Nindja (Kabare territory), where they
have allegedly chased away the Raïa Mutomboki from Lukoba and Bralima.13
Since the arrival of Shabadeux, the security situation at the Muhinga cassiterite mine
deteriorated. In May 2020 some miners had been kidnapped. Ever since, the mine owner
has to send a monthly payment to the rebels via ‘mobile money transfers‘. The original
amount was 50,000 FC (about 25 US$) but shortly after it rose to 160,000 FC (about 80
US$) to reach up to 200,000 FC (100 US$) in August 2020.
By October 2020, most of the miners had already left to the new discoveries in Luhihi and
Chosho/Tchoncho, and only 22 stayed at the site. This small workforce was no longer able
to pay the 100$ demanded by the rebels.
The mines in Djugu territory (four in our survey) provide another illustration of the impact of (in)security
on production levels. These mines observed a strong increase in number of miners between May and
October 2020, from 1,730 to 2,735 miners. This is however well below the 5,590 miners reported when
IPIS teams visited the mines in September 2018 (‘baseline’). The fluctuations in this area are especially
due to the fragile security situation caused by CODECO (Coopérative pour le Développement du Congo), an
12 The positive vibe back then, due to the departure of Maheshe and increasing numbers of buyers, has partly been tempered by October 2020, when no more than 350
miners were working at the mine. This decrease is due to new discoveries in Luhihi and Chosho/Tchoncho (discussed above), rainfall and a lack of pre-financing.
13 Telephone interviews with mining stakeholders in Kabare and Nindja territories, October 2020.
13alliance of Lendu armed groups.14 The signing of a ceasefire in July 2020 by some of the CODECO factions
had a positive impact on the security situation.15 Consequently, the number of miners has increased
considerably as pillaging and extorsion are less frequent.
CODECO remains the most important armed group
in Djugu, and more generally in Ituri. Its militiamen
are for example involved in gold exploitation
at the mines Camp Trois and Magnida.16 Some
interviewees even claim that it is precisely because
some CODECO groups took control of gold mines,
and their men can work in the mines, that the level
of violence has decreased.
The preceding report discussed that children and
teachers were reported among the newcomers
at many mining sites, which contributed to an
increasing number of miners at some mines:
Child labour during the holiday
periods is a well-known phenomenon.
The emergence of children at mining sites
was most probably linked to school closures,
one of the government measures taken
against Covid-19.17
Magnida gold mine Djugu territory, Ituri, September 2018
Schools officially re-opened on 12 October 2020, which was confirmed by some respondents in October
2020. Nevertheless, the presence of children had still been reported at several mines. Some school had
actually not yet started, as teachers were on strike demanding better working conditions (including
payment) from the government, since the latter decided to abolish the direct payment of teachers by the
parents of the pupils.
The Kadumwa gold mining site (Mwenga territory), provides an interesting anecdote related to the re-
opening of schools. Its workforce rose from 5,000 to 8,500 miners between May and October 2020. Since
the school closure at the beginning of the Covid-19 crisis, many teachers and students started digging
for gold in Kadumwa. Additionally, in September 2020, a lot of parents started working in the mines to
prepare for the re-opening of schools - and school fees - in October. Finally, unemployed staff of the
industrial mining company Banro (“congé technique”) still worked in the mine.
14 IPIS, Persistent violence in gold-rich Ituri Province, DR Congo: root causes and impact on local population, IPIS Briefing August 2020, https://ipisresearch.be/weekly-
briefing/ipis-briefing-august-2020-persistent-violence-gold-rich-ituri-province-dr-congo-root-causes-impact-local-population/
15 UN Group of Experts on the DRC, Midterm report, S/2020/1283, 23 December 2020
16 In September 2020, IPIS teams have also observed CODECO at the gold mines around the ‘Iga Barrière’ trading hub. See interactive webmap: https://ipisresearch.be/
mapping/webmapping/drcongo/v6/#1.7139687933079841/30.33066720265765/11.257053385461706/4/1,2/4.eo
17 IPIS (October 2020), op. cit., p. 18.
145 LOCAL ECONOMY
The preceding report discussed how Covid-19 hit the local economy in mining areas, and beyond, in
eastern DRC. The closure of the international borders, internal restrictions of movement and limited
transportation of goods. On top of that there was the devaluation of the Congolese Franc. While mining
stakeholders’ revenues decreased, the prices of food and essential goods started to rise dramatically.
Diggers complained about the increase in food prices, sometimes up to two or three times the price of
the pre-Covid-19 period.
In October 2020, the local economy still dealt with some of the effects of Covid-19. The exchange rate had
not yet recovered. Before the announcement of the Covid-19 restrictions, 1 US$ was changed at 1,600-
1,700 FC. In May 2020 the exchange rate was 1 US$ for 1,900 FC, and it was still 1,960 FC in October 2020.
The price of imported products and production equipment was still relatively expensive allover. The
price of a shovel, for example, varied between 10,000 and 15,000 FC in October 2020 in some of the
Maniema mining sites of our survey, while it was within the range of 5,000 - 9,000 FC before Covid-19.
For food products, price levels and price evolutions vary from one area to another. In Kasese and Punia
(Maniema province), Beni (North Kivu) and Ituri, people reported price decreases due to the harvest
season. For example, a cup of rice cost 600 FC in October 2020 in Kasese and Punia, while it was sold
between 1,000 and 2,500 FC a few months earlier. However, in South Kivu and some other hubs in
Maniema (Kalima, Kampene and Bikenge), people complained that food prices were still well above pre-
Covid-19 price levels. In Kamituga and Mwenga (South Kivu), people referred to the bad state of the
National Road as an explanatory factor of the rising prices.18 The project ‘Commercially Viable Conflict-
Free Gold’ also explained that areas depending on subsistence agriculture, rather than food imports,
have been less affected by food insecurity.19
18 Radio Okapi, La dégradation de la route à la base la flambée des prix à Kamituga, 29 January 2021.
19 Levin Sources & Global Communities, The Impact of COVID-19 on Artisanal Gold Miners in Eastern DRC, USAID, 28 October 2020.
156 SECURITY SITUATION AT MINING SITES
Several armed groups interfered at the mining sites that have been surveyed, including:
• CODECO groups in Djugu territory (Ituri);
• The Allied Democratic Forces (ADF) that are pillaging mining sites in the north of Beni territory (North
Kivu);
• Mai Mai groups in the western part of Beni (North Kivu)20;
• Raïa Mutomboki groups in South Kivu.
Nevertheless, the research did not find a link between insecurity, violence or armed interference in
mining areas on the one hand, and Covid-19 on the other hand.
6.1 STATE SECURITY FORCES
Policeman at the Mavula gold mine near Kampene, Maniema province, July 2018
The role of the mining police is however noticeable. There seems to be an increasing presence of these
agents at mining sites since the Covid-19 crisis, as they have been verifying whether the preventive
measures against the Coronavirus were respected. In May-June 2020, the mining police fined miners
(between 5,000 to 25,000 FC) on several mining sites, for not wearing a mask and hence, not complying
with the Covid-19 protective measures. In Shabunda, an increase in harassment, including illegal taxation,
of mining police and other law enforcement officers was reported since the outbreak of Covid-19.
Table 6: Mining police presence at the mining sites
Data collection round Number (and %) of mines with Mining Police presence
Baseline 13 (15%)
Round 1 25 (29%)
Round 5 20 (23%)
20 IPIS, Armed groups challenging opportunities for responsible gold mining in Beni, IPIS Briefing January 2021, https://ipisresearch.be/weekly-briefing/ipis-briefing-
january-2021-armed-groups-challenging-opportunities-for-responsible-gold-mining-in-beni/
16In October 2020, the presence of mining police had decreased slightly (see table 6), and they were no
longer checking respect of Covid-19 protective measures. In some mines, people also reported that
harassments by the mining police had decreased after the height of the Covid-19 crisis. Nevertheless, in
general, illegal taxation by these agents is still regularly reported at various mining sites.
Moreover, the interference of FARDC units had been reported at many mining sites, as is the case in our
baseline data. For example, in Beni area an FARDC regiment was levying illegal taxes at 7 out of the 11
mines that had been surveyed. The gold mine Kaibomba (near Bikenge, Maniema province) offers another
deplorable example. People reported that mining and mineral trade had recovered in the wider area, but
not at Kaibomba. Two competing FARDC units interfered in a conflict over access to the mine between
two customary chiefs (each unit protected the interest of another chief), which has led to insecurity and
harassment of miners. Consequently, a lot of miners and traders were not yet willing to return to the site.
177 CONCLUSION
The economic impact of Covid-19 hit ASM communities immediately in March 2020. DRC’s borders with
neighbouring countries were closed, exporting facilities (‘comptoirs’) experienced great difficulty to
export and many ceased to pre-finance traders. Consequently, mineral traders ran low in cash and were
no longer able to buy significant volumes, which had a devastating impact on miners’ revenues.
The lack of liquidity among local traders pushed down mineral prices, which hit rock-bottom in March-
April 2020. Price levels for both cassiterite and gold slowly recovered from May 2020 onwards, and even
surpassed pre-Covid-19 levels in July and August 2020. However, when comparing cassiterite prices at
the level of the mine with world market prices in October 2020, miners still got a slightly smaller part of
the market value of tin compared to the period prior to Covid-19.
Besides the recovery of gold prices, and partial recovery of cassiterite prices, the number of traders had
also largely recovered in most areas in October 2020. However, serious trade issues persisted across the
study area. Cash flow problems prevailed, as several ‘comptoirs’ in Kindu (Maniema) and Bukavu (South
Kivu) still had difficulty to export and to acquire funds from their international partners. In most places
mineral traders were circulating again in October, but they often did not have the same purchasing
power as prior to the Covid-19 crisis.
As traders are traditionally key actors to prefinance mining activities in eastern DRC, their cash flow
problems have also created a lot of difficulties for artisanal miners, and mining activity since March 2020.
At the selected mining sites of our survey, the median number of miners per site decreased from 200 at
the time of the baseline, to 109 miners early May 2020. By October 2020, mining activity seems to have
recovered to a certain extent. Of course, locally there are variations and some sites have not recovered
while others exceeded the baseline levels in October 2020.
Alongside the impact of Covid-19, additional factors should be considered to explain fluctuations in
miners’ numbers. These factors include seasonality, levels of security, discovery of new mineral deposits,
local conflicts, and operational challenges.
To conclude, the ASM sector in eastern DRC was hit hard in the first months of the Covid-19 crisis. On the
medium term (in October 2020), six months after the first Covid-19 cases, the sector had recovered to
a great extent. It however still struggled with serious challenges. Covid-19 created cashflow problems,
which lingered on in October 2020, and hampered pre-financing and investments in mining activity. It is
precisely these investments that are needed to deal with challenges such as seasonality and operational
issues: e.g. draining a flooded mine pit, or treating the hard rock containing the gold deposits. The lack of
investment pushed several miners to migrate to other, more productive mining sites.
188 APPENDIX
8.1 SOUTH KIVU
Table 7: Number of miners estimated per reference period, Cassiterite
Data collection round Total number of mine workers Med Avg Min Max SD No workers*
Baseline (17 mines) 2,816 170 166 50 300 89 0
Round 1 (15 mines) 1,433 97 96 20 155 45 0
Round 4 (15 mines) 1,893 86 126 20 596 139 0
Round 5 (15 mines) 1,619 70 108 22 350 92 0
* No workers = number of mining sites with no workers during the survey
Cassiterite production decreased considerably, and did not yet recover by October 2020. Especially in
Walungu territory, around the cassiterite trading hubs of Nzibira and nearby Luntukulu, a slowdown
of trade has been observed. This seems to be mainly due to decreasing production levels, not always
directly linked to Covid-19. This includes new discoveries in other mines (especially Chosho/Tchoncho
and Luhihi), rainfall, and in some cases insecurity.
Section 4 discussed the impact of the surrender of Raïa Mutomboki chief Maheshe, and the defection of
rebel leaders Shabadeux Mazi and Shagalu in Walungu and Kbare territory.
Around the cassiterite mines in Mwenga territory (Kashwa, Misela and Mayengo in our survey), trade
recovered carefully and production had slowly increased by October 2020. However, interviewees
complained that a local trade monopoly by the cooperative retarded a full recovery of mineral trade.
At the cassiterite mines around the trading hubs in the north of Shabunda, notably Nzovu, Tchonka and
Nyambembe, the situation was mixed in October 2020. As elsewhere, in the province cash flow problems
and a lack of pre-financing still existed, hence no recovery had been observed at the mines covered near
Nyambembe and Tchonka. On the contrary, around Nzovu, mining activity increased progressively.
Table 8: Number of miners estimated per reference period, Gold
Data collection round Total number of mine workers Med Avg Min Max SD No workers
Baseline (12 mines) 9,262 300 772 50 2,238 772 0
Round 1 (13 mines) 9,093 200 699 17 5,000 1,338 0
Round 4 (12 mines) 12,820 420 1,068 42 7,550 2,085 0
Round 5 (13 mines) 12,375 405 952 30 8,500 2,282 0
Compared to cassiterite, the decrease in gold mining activity observed in round 1 (May 2020) was not as
strong, and it had already recovered by late June 2020 (round 4). It is noteworthy that the total number
of miners is heavily influenced by Kadumwa gold mine (more detail below), as it employed 2,238 workers
in the baseline, and respectively 5,000, 7,550 and 8,500 workers in early May, late June and October 2020.
In Mwenga territory mineral trade had largely recovered in October 2020, and money was circulating.
This was also the case around the gold trading hub of Kamituga. Gold traders were going around the
different mines in the area, and mainly bought small quantities through the ‘lottery’ system (see text box
in section 3.1.1). For important gold volumes, miners went to the trading hub of Kamituga themselves, to
sell their production.
19The number of gold miners, however, did not increase in the area in October 2020. For the 7 mines of our
survey located around Kamituga, the total number of miners even decreased between round 4 and 5,
from 4,840 to 3,595 miners. It seems the rainy seasons partly explains this decrease, as well as the lack of
pre-financing, that miners observed in some sites. The Kazibe gold mine for example saw a decrease in
number of miners from 1,500 in the baseline, to 900, 550 and 250 miners in rounds 1, 4 and 5, respectively.
A lack of electricity, flooding of the largest pits and a lack of pre-financing (e.g. to empty the flooded pits)
have pushed miners to other sites. The number of miners at the nearby gold mine Golgotha, on the other
hand, increased from 200 to 800 miners between May and October 2020.
The Kadumwa gold mining site in the north-east
of Mwenga, on the contrary, rose between May
and October 2020 from 5,000 to 8,500 miners. The
high number of miners is largely due to several
factors related to Covid-19. Section 4 already
discussed that following school closures teachers,
pupils and students started digging for gold in
Kadumwa. Additionally, parents started working in
the mines to prepare for the reopening of schools,
and unemployed staff of the industrial mining
company Banro (“congé technique”) worked in the
mine.
In the gold mines near Shabunda town (4 in our
survey), people still reported serious cash flow
problems, which continued to affect gold trade.
Number of miners increased slightly from 166 to
253 miners between May and October 2020 but it
Kyendekutu or Mapipi gold mine, Shabunda remains well below the 570 miners reported in the
baseline.
8.2 MANIEMA
Table 9: Number of miners estimated per reference period, Cassiterite
Data collection round Total number of mine workers Med Avg Min Max SD No workers*
Baseline (24 mines) 3,819 115 159 60 500 112 0
Round 1 (23 mines) 2,649 71 115 12 518 113 0
Round 4 (23 mines) 3,967 106 172 20 650 162 0
Round 5 (23 mines) 4,907 185 213 41 513 144 0
* No workers = number of mining sites with no workers during the survey
In Maniema, the number of workers and mineral production at cassiterite mines increased strongly,
and even exceeded pre-Covid-19 figures. Nevertheless, interviewees felt that cassiterite trade recovered
rather slowly.
Section 3 and 4illustrated this, explaining that mining sites around Kalima produced minerals in October
2020, but that local traders’ cash flow problems continued to affect mineral trade. Some Kindu-based
comptoirs, had not yet resumed purchasing from Kalima and Kailo in October 2020. While cassiterite
prices had increased, miners experienced difficulty to sell their production
Also in Punia, number of miners and cassiterite production had recovered, but trade was only slowly
restarting in October, as money was not yet circulating
20Table 10: Number of miners estimated per reference period, Gold
Data collection round Total number of mine workers Med Avg Min Max SD No workers*
Baseline (12 mines) 5,329 295 444 165 1,650 411 0
Round 1 (12 mines) 2,497 152 208 0 650 172 1
Round 4 (12 mines) 3,319 209 277 82 800 200 0
Round 5 (12 mines) 5,227 432 436 143 762 203 0
* No workers = number of mining sites with no workers during the survey
More southward, Maniema also holds some
important gold deposits, around Kampene
and Bikenge. Gold trade in Maniema reportedly
recovered a bit quicker compared to cassiterite.
Interviewees testified that the situation is seriously
improving, with increasing production levels and
numbers of buyers. Nevertheless, people also
explained that the number of traders was not yet
at the pre-Covid level. Many traders coming all the
way from Bukavu did not yet return.
Finally, in the north of Maniema, close to Lubutu,
gold mines (three in our survey) experienced
production increases.
Kangumbu cassiterite mine, Maniema province
8.3 NORTH KIVU
Table 11: Number of miners estimated per reference period, Gold
Data collection round Total number of mine workers Med Avg Min Max SD No workers*
Baseline (11 mines) 1,358 102 123 75 244 52 0
Round 1 (11 mines) 1,749 150 159 15 400 144 0
Round 4 (11 mines) 1,162 35 106 5 450 144 0
Round 5 (11 mines) 1,522 120 138 55 450 109 0
* No workers = number of mining sites with no workers during the survey
In Beni territory, interviewees claimed that Covid-19 never had a significant impact on production levels.
Miners live from day to day, and continued producing, despite lower prices and a slowdown in trade.
Increasing levels of insecurity were mentioned as a much bigger concern than Covid-19.21
A decrease in number of miners can be observed in June 2020 (round 4), which was however not related
to Covid-19. Heavy rains seriously hampered gold production around Beni, and consequently temporarily
stopped gold trade.
21 IPIS, Armed groups challenging opportunities for responsible gold mining in Beni, IPIS Briefing January 2021, https://ipisresearch.be/weekly-briefing/ipis-briefing-
january-2021-armed-groups-challenging-opportunities-for-responsible-gold-mining-in-beni/
21In October 2020, interviewees in Beni talk about a ‘net improvement’ of the situation, as mineral prices
have increased again, and food prices decreased (see section 5). Mineral trade has revived and minerals are
no longer stockpiled. Nevertheless, some minor cash flow issues persisted in October 2020. Traders were
not always immediately able to buy all gold production, while the gold sector is typically characterized
by money being readily available, which usually enables quick transactions.
8.4 ITURI
Table 12: Number of miners estimated per reference period, Gold
Data collection round Total number of mine workers Med Avg Min Max SD No workers*
Baseline (12 mines) 9,038 388 753 106 2,500 843 0
Round 1 (12 mines) 2,839 155 237 25 1200 316 0
Round 4 (11 mines) 3,305 100 300 15 1,650 484 0
Round 5 (12 mines) 3,189 51 266 0 1,900 531 3
* No workers = number of mining sites with no workers during the survey
The figures in table 12 need to be interpreted with caution. The different territories within Ituri have
followed different trends (see below). In general, interviewees explained that since the peak of the crisis,
in the first half of 2020, mineral trade had actually seriously improved. In October 2020, there was a lot of
activity and minerals were no longer being stockpiled. Some traders allegedly still struggled with cash
flow but very little problems had been reported for the mines studied in this survey. Traders were once
again buying large volumes of gold.
Section 4 discussed the positive impact of increasing levels of security on gold production in Djugu
territory. Nevertheless, the armed group CODECO still operates in the area.
The number of workers in the mines that have been surveyed in Irumu territory decreased between
May and October 2020. Despite this decrease, interviewees explained that the area had recovered from
Covid-19. This production decrease is due to some other factors, notably heavy rainfall and the arrival of
some semi-industrial investors. At the three mining sites Manzanza, Cartusi and Murondo, there were no
more miner in October 2020. During the peak of the Covid-19 crisis, when production, trade and prices
plummeted, Chinese investors acquired access to these three mines and reportedly depleted them.
At the trading hub Nia-Nia, in Mambassa territory, gold production and trade had already largely
recovered from the crisis by July 2020. However, in September 2020, due to the rains, Ituri river flooded
Mangodo and Mambo Bado mining sites, and in October 2020, almost all miners had left these sites.
22V.U. Filip Reyniers, Directeur, IPIS, Italiëlei 98A, 2000 Antwerpen I Layout: SAKADO I D/2021/4320/04
You can also read