Creating a leading African gold producer
←
→
Page content transcription
If your browser does not render page correctly, please read the page content below
Expanding   Production
     Creating              andgold
              a leading African Reducing
                                   producer Costs
Disclaimer
    SAFE HARBOUR: Some statements contained in this presentation are forward·-looking statements or forward-looking information (collectively, “forward-looking
    statements”) within the meaning of the United States Private Securities Litigation Reform Act of 1995 and applicable Canadian securities laws. Investors are
    cautioned that forward-looking statement s are inherently uncertain and involve risks and uncertainties that could cause actual results to differ materially. Such
    statements include comments regarding: production, cash operating cost, All-in Sustaining Cost and capital expenditure guidance for 2018; ability of long-term
    relationship with La Mancha to strengthen balance sheet, unlock organic growth pipeline, fast track exploration and expansion programs, focus on increasing
    production and cash margin per ounce, and participate in consolidation of African region through seizing external growth opportunities; expected use of funds from
    La Mancha strategic investment towards exploration and timing thereof;, and expected subsequent decrease in cash operating cost per ounce and annual operating
    costs; increased recovery rate for underground material following downsizing of processing plant and power consumption; increased Inferred Mineral Resources
    through drilling and timing of announcements regarding such increases; potential of Wassa South to significantly increase production; achievement of targeted
    mining rate at Wassa Underground and timing thereof; and achievement of milestones in H2 2018-2019 including accelerated exploration of Mineral Resource
    definition drilling at Wassa, accelerated Wassa Underground development. Factors that could cause actual results to differ materially include timing of and
    unexpected events at the Wassa processing plant; variations in ore grade, tonnes mined, crushed or milled; delay or failure to receive board or government
    approvals and permits; construction delays; the availability and cost of electrical power; timing and availability of external financing on acceptable terms or at all;
    technical, permitting, mining or processing issues, including difficulties in establishing the infrastructure for Wassa Underground, inconsistent power supplies, plant
    and/or equipment failures and an inability to obtain supplies and materials on reasonable terms (including pricing) or at all; changes in U.S. and Canadian securities
    markets; heavy rainfall and flooding of underground mines; and fluctuations in gold price and input costs and general economic conditions.

    Thee can be no assurance that future developments affecting the Company will be those anticipated by management. Please refer to the discussion of these and
    other factors in our Annual Information Form for the year ended December 31, 2017 filed and available at www.sedar.com. The forecasts contained in this
    presentation constitute management's current estimates, as of the date of this presentation, with respect to the matters covered therein. We expect that these
    estimates will change as new information is received and that actual results will vary from these estimates, possibly by material amounts. While we may elect to
    update these estimates at any time, we do not undertake to update any estimate at any particular time or in response to any particular event. Investors and others
    should not assume that any forecasts in this presentation represent management's estimate as of any date other than the date of this presentation.

    NON-GAAP FINANCIAL MEASURES: In this presentation, we use the terms "cash operating cost per ounce", "All-In Sustaining Cost per ounce" and "AISC per
    ounce". These terms should be considered as Non-GAAP Financial Measures as defined in applicable Canadian and United States securities laws and should not be
    considered in isolation or as a substitute for measures of performance prepared in accordance with International Financial Reporting Standards ("IFRS"). "Cash
    operating cost per ounce" for a period is equal to the cost of sales excluding depreciation and amortization for the period less royalties, the cash component of
    metals inventory net realizable value adjustments and severance charges divided by the number of ounces of gold sold (excluding pre-commercial production
    ounces) during the period. ,"All-In Sustaining Costs per ounce" commences with cash operating costs and then adds sustaining capital expenditures, corporate
    general and administrative costs, mine site exploratory drilling and greenfield evaluation costs and environmental rehabilitation costs, divided by the number of
    ounces of gold sold (excluding pre-commercial production ounces) during the period. This measure seeks to represent the total costs of producing gold from
    operations. These measures are not representative of all cash expenditures as they do not include income tax payments or interest costs. Changes in numerous
    factors including, but not limited to, mining rates, milling rates, gold grade, gold recovery, and the costs of labor, consumables and mine site general and
    administrative activities can cause these measures to increase or decrease. We believe that these measures are the same or similar to the measures of other gold
    mining companies, but may not be comparable to similarly tit led measures in every instance. Please see our "Management's Discussion and Analysis of Financial
    Condit ion and Results of Operations for the three and nine months ended September 30, 2018" for a reconciliation of these Non-GAAP measures to the nearest IFRS
    measure.

    INFORMATION: The information contained in this presentation has been obtained by Golden Star from its own records and from other sources deemed reliable,
    however no representation or warranty is made as to its accuracy or completeness. The technical information relating to Golden Star's material properties disclosed
    herein is based upon technical reports prepared and filed pursuant to National Instrument 43-101 - Standards of Disclosure for Mineral Projects ("NI 43-101") and
    other publicly available information regarding the Company, including the following: (i) "NI 43-101 Technical Report on a Feasibility Study of the Wassa Open Pit
    Mine and Underground Project in Ghana" effective December 31, 2014; and (ii) "NI 43- 101 Technical Report on Resources and Reserves, Golden Star Resources,
    Bogoso/ Prestea Gold Mine, Ghana" effective December 31, 2017. Additional information is included in Golden Star's Annual Information Form for the year ended
    December 31, 2017 which is filed and available on www.sedar.com. Mineral Reserves were prepared under the supervision of Dr. Martin Raffield, Senior Vice
    President Technical Services for the Company. Dr. Raffield is a "Qualified Person" as defined by NI 43- 101. The Qualified Person reviewing and validating the
    estimation of the Mineral Resources is Mitchel Wasel, Golden Star Resources Vice President of Exploration.

    CURRENCY: All monetary amounts refer to United States dollars unless otherwise indicated.

    NYSE: GSS
2
    TSX: GSC
OVERVIEW OF
WASSA COMPLEX

    NYSE: GSS
3
    TSX: GSC
Wassa Complex: Snapshot

    •   Underground gold                     mine        in     south-
        western Ghana

    •   Production commenced from open pit
        in 2005 (ceased in January 2018) and
        underground in 2016

    •   2018 targeted underground production
        rate increased to 3,000 tpd following
        outperformance in H1 2018 in terms of
        tonnes and grade

    •   Proceeds from La Mancha investment
        expected to be used to accelerate                                                           WASSA
        Wassa    exploration and    expand
        production further                                                                                  Unit    Rate

    •   Wassa      South      Inferred Mineral                                   2017 Production1           Koz     137
        Resources represent potential to
        significantly increase production, in                                    2018 Forecast
                                                                                                            Koz    150-155
        addition to satellite deposits                                           Production2

                                                                                 2018 Forecast Cash
                                                                                                            $/oz   600-650
    •   Under-utilized capacity in decline and                                   Operating Cost2
        processing plant

    NYSE: GSS   1.   Includes Wassa Main Pit and Wassa Underground
4
    TSX: GSC    2.   See note on slide 2 regarding Non-GAAP Financial Measures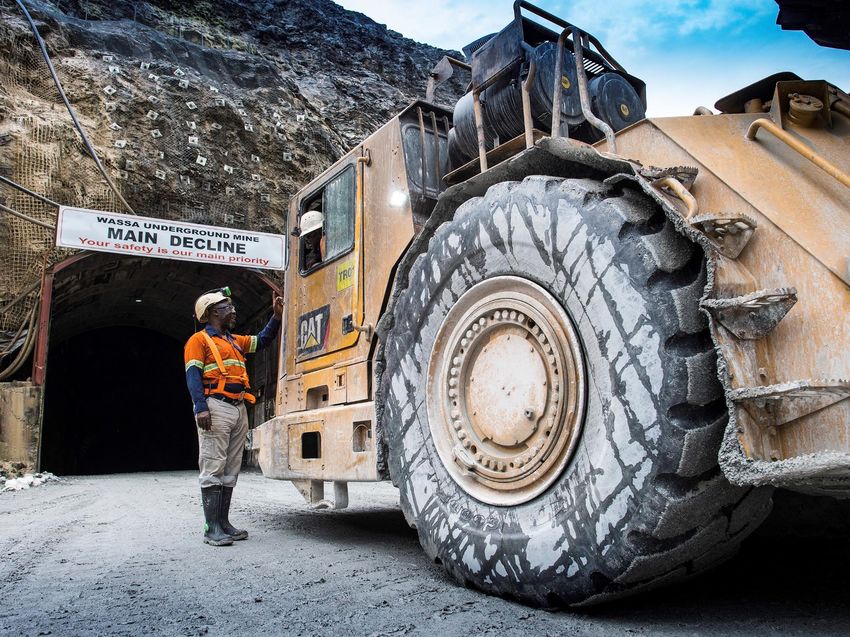
Wassa Complex: Mineral Reserves & Mineral Resources

                   Dec 31, 2017 Proven and Probable                      Apr 9, 2018 Measured and Indicated
      MINERAL                                               MINERAL                   Resource
                            Mineral Reserve
      RESERVES                                             RESOURCES
                                                                          Tonnes      Grade       Ounces
                   Tonnes       Grade       Ounces
                                                           Wassa Main
    Wassa Main                                                           26,652,000    1.32      1,134,000
                  12,254,000     1.30       512,000        Pit
    Pit

    Wassa                                                  Wassa
                   4,899,000     4.11       647,000                      13,003,000    4.10      1,713,000
    Underground                                            Underground

    Stockpiles     1,595,000     0.71        37,000        Wassa Other   4,251,000     3.49      476,000

    WASSA                                                  WASSA
                  18,748,000     1.98      1,196,000                     43,906,000    2.35     3,323,000
    TOTAL                                                  TOTAL

                      Apr 9, 2018 Inferred Mineral     •      Wassa Underground has a 5 year
      MINERAL                  Resource
     RESOURCES                                                mine life – expected to be extended
                   Tonnes       Grade       Ounces            significantly through exploration
    Wassa Main
                    91,000       1.16        3,000
    Pit                                                •      Wassa       Underground’s   Mineral
    Wassa
                                                              Reserves have an average head grade
                  44,909,000     3.57      5,153,000          of 4.11 g/t Au
    Underground

    Wassa Other   2,011,000      4.23       274,000    •      Significant potential for conversion of
                                                              Inferred    Mineral     Resources    to
    WASSA                                                     Indicated category in 2019
                  47,011,000     3.59      5,430,000
    TOTAL

    NYSE: GSS
5
    TSX: GSC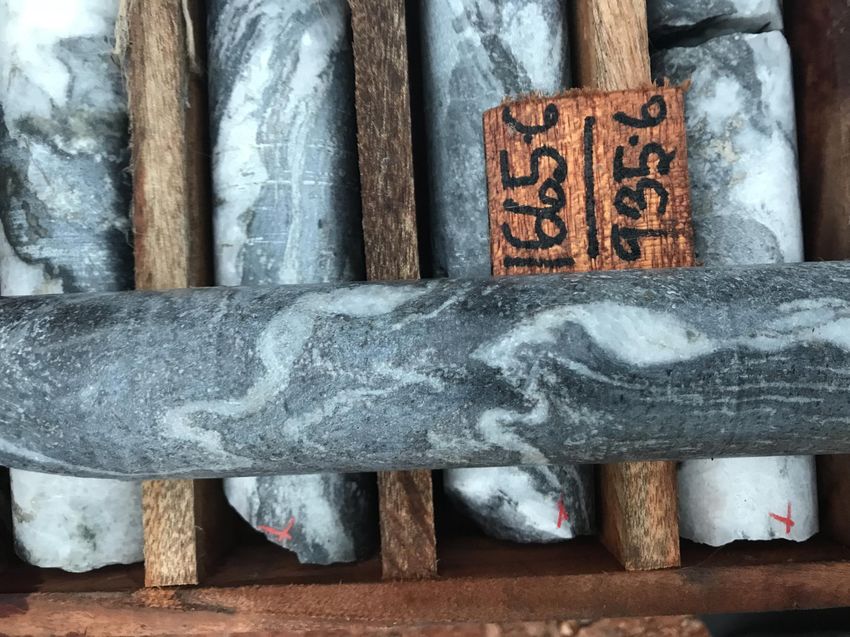
Wassa Complex: Q3 2018 Snapshot

                                     WASSA

                                                                                      •   96% of Wassa Complex’s gold
                                              Q3 2018              Q3 2017
                                                                                          production attributable to Wassa
                                                                                          Underground
     Ore Mined                     Kt                   313                   607
                                                                                      •   130%     increase       in    Wassa
                                                                                          Underground production compared to
     Waste Mined                   Kt                     73               1,493          Q3 2017 and in line with Q2 2018

     Ore Processed                 Kt
                                                                                      •   41% increase in Wassa Underground
                                                        394                   669
                                                                                          grade processed compared to Q3
                                                                                          2017    although     26%     decrease
     Grade Processed            g/t Au          Main Pit 0.65         Main Pit 1.20       compared to Q2 2018 due to
                                            Underground 3.69      Underground 2.61
                                                                                          expected variation within ore body

     Recovery                      %                   95.8                  93.1     •   Average mining rate achieved of
                                                                                          3,400 tpd – 28% increase compared
                                                                                          to Q2 2018
     Gold Production              oz               38,097                31,724
                                                                                      •   28% decrease in cash operating cost
     Gold Sales                   oz
                                                                                          per ounce1 compared to Q3 2017 due
                                                   38,295                31,999
                                                                                          to increase in gold sold and decrease
                                                                                          in mine operating expenses
     Cash Op. Cost1              $/oz                   613                   856

    NYSE: GSS   1.   See note on slide 2 regarding “Non-GAAP financial measures”.
6
    TSX: GSC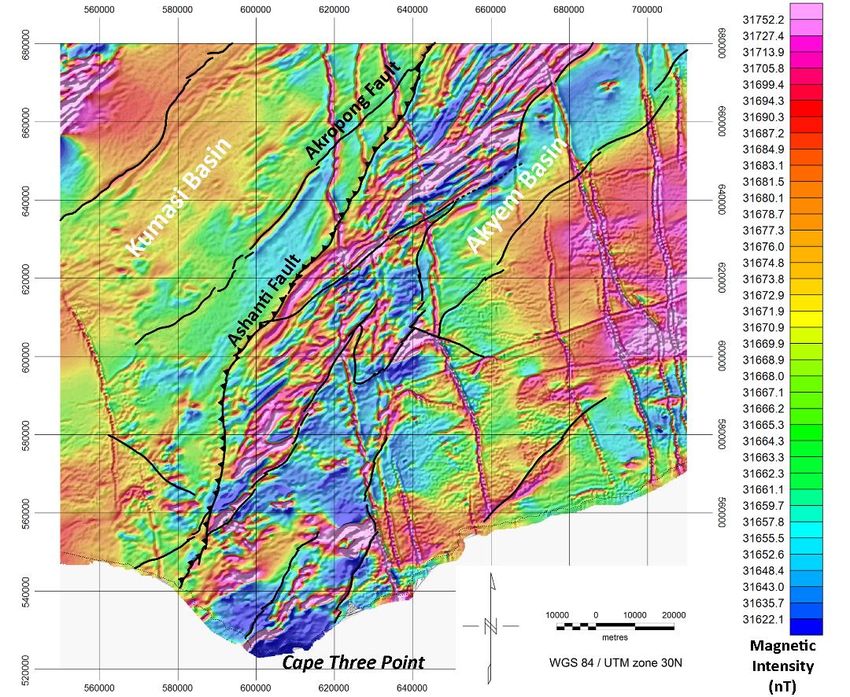
September 2018 YTD: Wassa Operating Results

                            Wassa Complex is on track to achieve FY 2018 gold production and cash
                                             operating cost per ounce1 guidance

                                       Wassa Gold Production                                                    Wassa Cash Operating Cost Per
                                                                                                                          Ounce1
                    45                                                                                  700
                    40                                 3                  2                             680
                                   6
                    35
    Ounces ('000)

                                                                                                        660
                    30
                                                                                                        640

                                                                                                 $/oz
                    25
                    20                                                                                  620      683
                                                      36                 37
                    15             30
                                                                                                        600
                    10
                                                                                                                            610        613
                      5                                                                                 580
                    -                                                                                   560
                                  Q1'18            Q2'18               Q3'18                                     Q1'18      Q2'18      Q3'18

                          Wassa Underground             Open Pit/Stockpile

                                              Production                                                        Cash Operating Cost1
                             First 9 months of 2018: 112koz                                               First 9 months of 2018: $634/oz
                                  2018 Guidance: 150-155koz                                                   2018 Guidance: $600-650/oz

    NYSE: GSS                1.   See note on slide 2 regarding “Non-GAAP financial measures”.
7
    TSX: GSC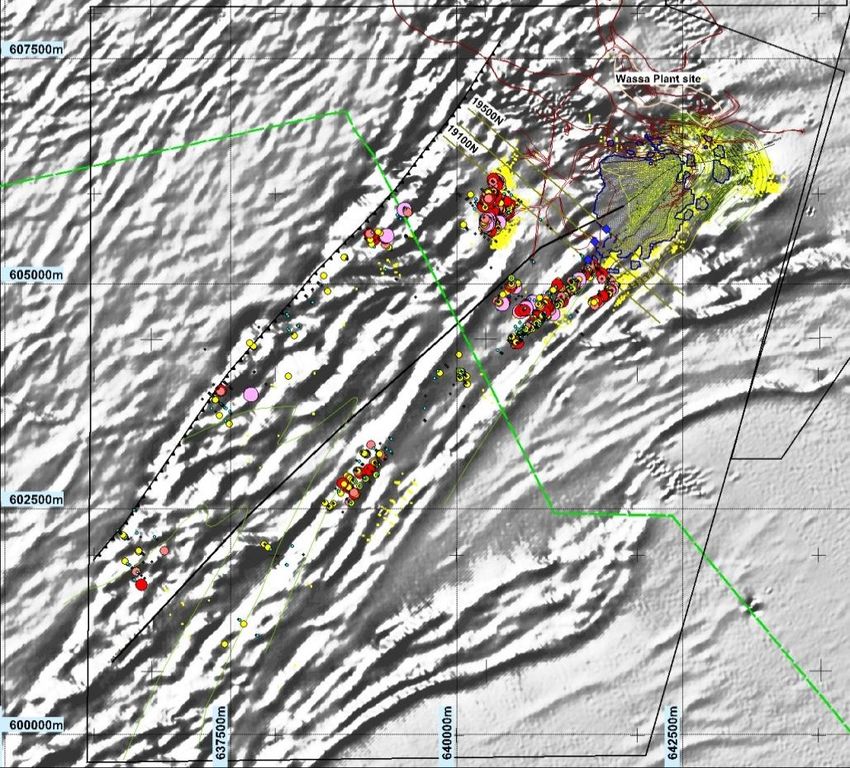
A Strong Safety Culture

    •    New indicators to drive behaviours
           • Last LTI in January 2018
           • TRIFR 0.74, AIFR 2.60

    • Recent safety culture review found workforce
      consider culture productive and supportive

    • Increasing reporting of hazards and near
      misses

    • Good use of pre-task hazard assessments
      (Take 5)

    • Visual boards in use to provide common
      understanding of performance

    • Major housekeeping improvements underway

    • Strong performance       by    safety   standards
      working teams

    NYSE: GSS
8
    TSX: GSC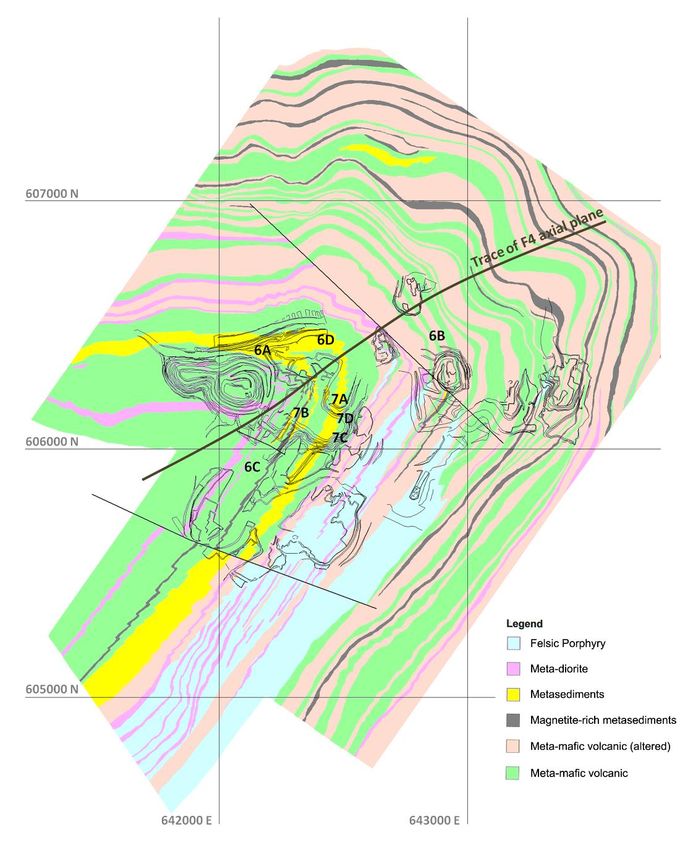
Golden Star Safety Strategy and Leadership

    • Leadership   –   170  leaders   in
      leadership    empowerment     and
      development program

    • Working groups to enhance systems
      and drive improved leadership

    • Empowerment - workforce developing
      Golden Star safety standards

           • Electrical safety
           • Heavy equipment and driving
           • Cranes and lifting
           • Work at height
           • Drilling
           • Others in plan
    • Improvement orientation - safety
      plans incorporate improvement action   Electrical standards champions
      plans

    • New recognition systems

    • Culture reviews to chart progress

    NYSE: GSS
9
    TSX: GSC
Corporate Social Responsibility: Snapshot

      Oil palm plantations employ          Value retention       CSR agreements with host
            over 700 people           86% goods and services           communities
         Over US$6.2M to date        value by host communities   98% employees Ghanaian

              Partnerships            Economic development        Livelihoods based post-
      Free preventative health for      Over US$479M in               mining land use
            +15,000 people            government payments        International recognition

     NYSE: GSS
10
     TSX: GSC
WASSA GEOLOGY
NYSE: GSS
11
TSX: GSCRegional Geology: Ashanti Belt Cross Section
Obuasi
Edikan
Damang
Bogoso
Wassa
Prestea
Tarkwa
Benso
Nzema Father Brown
NYSE: GSS Source: Perrouty et al. 2012
12
TSX: GSCGhana Gold Deposits: Timing
Damang Bogoso-Prestea-HBB Tarkwa Wassa
Obuasi-Edikan-Nzema
NYSE: GSS Source: Modified from Perrouty et al. 2012
13
TSX: GSCWassa Deposit: Stratigraphy
• The stratigraphy underlying the Wassa
deposit is composed of mafic volcanic
flows with minor intercalated
sedimentary horizons of graphitic
mudstones, iron formation and
greywacke
• The stratigraphic sequence which is
locally intruded by dioritic dykes and
felsic Porphyry has been divided into
three lithological packages:
1. Thick mafic volcanic flows
intercalated with wackes and
intruded by diorite
2. A relatively thick altered volcanic
flow interlayered with mafic
volcanic flows and intruded by a
felsic Porphyry
3. Interlayered altered volcanic
flows and graphitic mudstones
• U/Pb dating of the Felsic Porphyry
obtained a crystallization age of 2191 ±
4.7 Ma
NYSE: GSS
14
TSX: GSCWassa Geology
• The Wassa Gold deposit is hosted in Birimian meta sedimentary and volcanic rocks
• Dating has shown it is the oldest deposit in the Ashanti Belt
• Initial gold mineralization has been affected by two major folding events which controls
current geometry of ore bodies
• Gold has been remobilized during the first tight folding event and it is these higher
grade fold closures which are being mined underground
NYSE: GSS
15
TSX: GSCReconciliation
Exploration Model (long range) to Grade Control Model to Plant
Grade Control Model (short range) (mined-to-date)
2016 Budget Grade Control CMS and Muck
Grade Control Model Plant Recon
Sublevel Exploration Model Model Grade
Sublevel
T Gr Oz T Gr Oz
720 30 3.8 4 185 3.5 21 T Gr Oz T Gr Oz T Gr Oz
695 167 3.8 20 225 3.2 23 720 100 4.0 13 88 4.7 13 108 4.6 16
670 457 3.8 56 478 3.8 58 203 3.3 21 179 4.2 24 195 4.1 25
695
645 347 5.1 57 403 4.9 63
670 196 4.5 29 187 4.9 30 206 5.1 34
620 247 4.7 37 163 4.2 22
Total 1,249 4.3 174 1,454 4.0 187 Total 499 3.9 63 455 4.6 68 509 4.6 75
Tonnes and ounce uplift Tonnes, grade and ounce uplift
NYSE: GSS
16
TSX: GSCOVERVIEW OF WASSA
UNDERGROUND
NYSE: GSS
17
TSX: GSCGSS
NYSE:
16
TSX: GSCWassa Underground: Production Rate
• 2018 production rate target was
Average production rate per day increased in September 2018 due to
4,000 outperformance in year-to-date
3,500
• Achieved over 3,400 tpd in Q3 2018
3,000 – well positioned to maintain this
production rate going forwards
Ore Tonnage
2,500
2,000 • Mining sequence working well and
1,500
3,400 an increasing number of stopes
2,400 2,600 prepared and developed
1,000
500 • Total lateral development advance of
4,700 during first 9 months of 2018
- – outperforming budget
Q1'18 Q2'18 Q3'18
• Panel 1 is currently being mined
• Definition drilling for the lower levels
Targeting average production rate of Panel 1 and upper part of Panels
from Wassa Underground of 2 and 3 is in progress to upgrade
3,000 tpd in 2018 Mineral Resources from Indicated to
Measured
NYSE: GSS
18
TSX: GSCWassa Underground: Grade
Wassa Underground: Grade Processed
6.00
5.00
Grams Per Tonne
4.00
3.00
4.99
4.54
2.00
3.69
1.00
-
Q1'18 Q2'18 Q3'18
• Average grade processed of 4.33 g/t Au in first 9 months of 2018 – higher than
Mineral Reserve grade of 4.11 g/t Au
• 26% decrease in grade processed in Q3 2018 compared to Q2 2018 due to expected
variation within ore body
• Grade expected to return to approximately Mineral Reserve grade in Q4 2018
2018 grade processed from Wassa Underground expected to be in line with
Mineral Reserve grade
NYSE: GSS
19
TSX: GSC2018 Operational Successes
Increased mining fleet successfully integrated
• Gold production from Wassa Underground has increased steadily during first 9
months of 2018 as a result of the integration of the new fleet (one jumbo, one
loader and four trucks)
Positive reconciliation between mining and ore model
• The definition drilling program continues to identify more ore per sub-level than
shown in the long range ore models
Competent ground conditions continue
• Good rockmass conditions have allowed stable openings up to 75m high with
minimal dilution
NYSE: GSS
20
TSX: GSCPreparing For Expansion in 2019
• Wassa is targeting a 4,000 tpd production
rate on a consistent basis by mid-2020
• Golden Star began preparing for this
expansion during Q3 2018 through:
• Undertaking a ventilation upgrade –
larger fans installed (from 4 x 90kW
to 4 x 132kW) to allow for an increase
in mining equipment in operation
underground
Ventilation borehole under construction
• The commencement of drilling of two
ventilation boreholes – due to be
completed during Q1 2019
• Increase in production drilling –
record number of metres (over 1,000
m) drilled by longhole drilling team in
24 hours during Q3 2018
• Increasing definition drilling - drilling
is ongoing in Panels 2 and 3 to
delineate 9 months of Measured ore Completed ventilation borehole
ahead of production by end 2019
NYSE: GSS
21
TSX: GSCPlanned InfrastructureUpgrades
Planned Infrastructure Upgrades: Backfill Project
Evaluation of backfill options is underway with the objective of allowing GSR to
mine a greater portion of Wassa’s Mineral Reserves
• Stage 1: Unconsolidated waste backfill planned to be implemented in Panel 1 in 2019
to facilitate pillar recovery
• Stage 2: Cemented paste backfill planned to be implemented for Panel 2 and below
from Q2 2020 onwards – this will allow Wassa Underground to achieve a mining rate of
4,000 tpd from mid-2020
• Benefits of paste backfill:
• No need for pillars – full extraction of ore body on each sublevel and improved
mining efficiency
• Paste is piped in rather than trucked in like unconsolidated backfill – reduces the
need for mobile mining fleet
• With reduced mining fleet, ventilation requirements and fleet congestion are
reduced
NYSE: GSS
22
TSX: GSCPlanned ExpansionOf
Planned Expansion of Mining
MiningFleet
Fleet
Wassa Underground is well-positioned to achieve 3,400 tpd consistently with
current mining fleet, ramping up to 4,000tpd in mid-2020
• 2 Volvo trucks have been procured – expected to arrive in Ghana in November
2018
• Additional equipment planned to be purchased in 2019:
• 2 Volvo Trucks
• 1 Jumbo drill to replace old unit
• 1 Loader R2900G
• 1 M12 Cat Grader
NYSE: GSS
23
TSX: GSCUnder-Utilized Capacity in Decline and Plant
Targeted 2018 Decline Capacity Processing
Mining Rate Plant Capacity
3,000 tpd Up to 5,000 tpd 7,700 tpd
• Wassa Underground’s maximum targeted production rate in the Feasibility Study was
2,300 tpd
• Decline engineered with excess capacity with a view to expanding production over
time
• Processing plant has two ball mills – currently only one is being utilized
No bottleneck to expansion to 4,000 tpd production rate
NYSE: GSS
24
TSX: GSCWASSA
UNDERGROUND:
DESIGN & SCHEDULE
NYSE: GSS
25
TSX: GSCUnderground Design
Underground Design and
and Schedule
Schedule
2018
NYSE: GSS
26
TSX: GSCUnderground Design
Underground Design and
and Schedule
Schedule
Ventilation raise
2018
2019
NYSE: GSS
27
TSX: GSCUnderground Design
Underground Design and
and Schedule
Schedule
2018
2019
2020
NYSE: GSS
28
TSX: GSCUnderground Design
Underground Design and
and Schedule
Schedule
2018
2019
2020
2021
NYSE: GSS
29
TSX: GSCUnderground Design
Underground Design and
and Schedule
Schedule
Ventilation raise
2018
2019
2020
2021
2022
NYSE: GSS
30
TSX: GSCUnderground Design
Underground Design and
and Schedule
Schedule
2018
2019
2020
2021
2022
2023
NYSE: GSS
31
TSX: GSCUnderground Design
Underground Design and
and Schedule
Schedule
2018
2019 Panel 1
2020 Panel 4
2021 Panel 2
2022 Panel 3
Panel 6
2023
2024
NYSE: GSS
32
TSX: GSCWASSA PROCESSING
PLANT
33 NYSE:GSS
NYSE: GSS
33
2 TSX:GSC
TSX: GSCWassa Processing Plant: Flow Sheet
WASSA PROCESSING PLANT
Recovery 95%
DUMP TRUCK
Daily Throughput 4,000 tpd
ROM Capacity 7,700 tpd / 2.7 Mtpa
FE WHEEL LOADER Mill availability 95% O/F
ROM Bin U/F Primary Cyclone
cluster 2
O/S
Apron Vibrating
feeder Grizzly
CV06
Scalping screen 2
Single Secondary U/S
CV01 Tertiary
toggle Jaw cone Crusher weightometer CV13
Secondary bin Ball mill 2 scats Knelson conc 2
Crusher Tertiary
Screen Tertiary Screens X2
CV03 cone U/F
CV05 Sump 2
Crushers Concentrate tk 2
weightometer X2
CV02 CV07 Quaternary
CV16 bin
CV17 Shaking table
CV04
Splitter O/F
Quaternary Lime Silo box
cone
Concentrate tk 1 O/S
Crushers X4 O/S
Trash screen
CV08 & 09
COS Sump 1
CV11 Scalping screen 1
weightometer U/F Trash
U/S
CV10 material
Belt feeders X4 Knelson conc 1
O/F
Regeneration Kiln Barren carbon hopper
weightometer CV12 Ball mill 1 scats
Quench carbon screen U/F Primary Cyclone
cluster 1
Carbon Safety Screen
CIL tanks
Tails
Autosampler
Sump 6 U/S
Carbon basket
Recovery O/F
Pre-leach High rate Thickener
screen
Acid wash O/F
Storage facility cone
Secondary Cyclone
cluster 1
Sump 3
Thickener overflow tank U/F
Elution
column U/F
O/F
Electrowinning cell (3x)
Strip solution
tank Head U/F
Autosampler Secondary Cyclone
cluster 2 Sump 4
Calcine oven (2x)
Sump 5 with
cyanide addition
Induction furnace
Bullion bars
NYSE: GSS
34
TSX: GSCProcessing Assumptions
95.7% recovery achieved in first 9 months of 2018 due to increased
residence time in CIL plant
Strategy
• To run one ball mill at optimum throughput and operate the crushing section on the
day shift only
• The second ball mill will be run if the mine delivers more ore than the targeted daily
throughput
• Benefits of this strategy are:
• Improved ore blend management
• Improved recovery with increased carbon-in-leach residence time at CIL
• Improved flexibility due to the presence of a standby milling unit
Planned upgrade in 2019:
• Installation of an in-line leach reactor for recovery of gravity gold
NYSE: GSS
35
TSX: GSCWASSA
EXPLORATION
NYSE: GSS
36
TSX: GSCGrowth of Wassa Underground’s Mineral Resources
NYSE: GSS
37
TSX: GSCWassa: Isometric View Looking East
N S
19500N
19300N
18700N
19100N
18900N
Wassa 2 rigs
Main Pit 19450N
B Shoot 1 rig
F Shoot mined stopes
mined stopes 19000N 18700N
step out
2 rigs
currently
drilling
1500 m
Inferred Mineral Resource
44.9m tonnes grading 3.6 g/t Au for
5.2Moz
1 rig
19400N
6 drill rigs currently on site with 7th rig
expected to start drilling in November BS18DD391M
2018 BS18DD391D1
BS18DD308D2
300 m
Additional
potential to
South at
BS18DD388D2
depth
NYSE: GSS
38
TSX: GSCB Shoot South Drilling: 19300 N
W E
19300N
BSDD308D1
13.4m @ 6.0g/t
BSDD308M
23.7m @9.6g/t
BS18DD308D2
12.9 m @ 6.8 g/t
BS17DD386M BS18DD308D2
6.4 m @ 3.2 g/t 18.4 m @ 6.3 g/t
HG intercepted in 18900
projects to North down dip
of 308 D2
Planned Holes
2019
• BS18DD308D2 has intersected what has been interpreted
BSDD308M as F Shoot
BS18DD308D2 7.4 m @3.1 g/t
18.4 m @ 6.3 g/t
• Mineralized zone is wider and higher grade than up dip hole
and remains open down dip
HG intercepted in 18900 • Additional drilling down dip and up plunge to the North of
projects to North down dip this hole is currently ongoing
of 308 D2
• New hole is expected to add Inferred Mineral Resource
ounces
NYSE: GSS
39
TSX: GSCB Shoot South Drilling: 19100N
W E
19100N
BS18DD389D1A
BSDD315M 6.4m@1.5g/t
60.1m @ 3.4g/t 4.0m@4.5g/t
BS18DD390M
BS18DD389M
18.3m @ 4.3g/t
12.6m @ 3.7g/t
Additional drilling
planned
BSDD315M
70.5m @ 5.9g/t
BS18DD390M
8.5m @ 6.5 g/t
• Additional drilling planned to test the upper and
lower F Shoot zone at depth
Planned Holes • New results from BS18DD390M have shown the
gold distribution is variable and further drilling will
be conducted on 50 m centres to confirm grades
and geometry in this area
NYSE: GSS
40
TSX: GSCB Shoot South Drilling: 18900N
W E
18900N
BS17DD385D3
5.0m @ 5.5g/t
Planned holes
BS17DD385D4
7.7m@5.2g/t
BS17DD385D1
BS17DD385D3
15.9m @4.3g/t
15.0 m @ 3.8 g/t
BS18DD388D2
8.1 m @ 3.6 g/t
BS17DD385M
BS18DD388M 23.8m @6.1g/t
58.5 m @ 4.8 g/t 21.7m @ 5.3g/t
BS17DD385D2 • Holes BS18DD388D1 and D2 have
BS18DD388D2 4.3m@25.9g/t
extended the lower F Shoot
14.7m @ 4.4 g/t
8.2m @ 8.7 g/t
BS18DD388D1 mineralization both up and down dip
8.8 m @ 7.2 g/t
27.1m @ 4.7 g/t
5.7 m @ 4.1 g/t
66.8m @ 5.2 g/t
40.7m @ 4.8 g/t
8.7 m @ 7.3 g/t • The new results are anticipated to have a
BS17DD385D3
positive effect on the existing Inferred
134 m@4.3 g/t Mineral Resource
NYSE: GSS
41
TSX: GSCB Shoot South Drilling: 18700N 200m Step Out Fence
W E
18700N
BS18DD391D2
currently drilling
BS18DD391D2
1500 m
assays pending
BS18DD391D1
BS18DD392D1
currently drilling
BS18DD391M
BS18DD391D1 4.9 m@2.2g/t
20.8 m@2.7g/t 3.9 m@3.1g/t
8.6 m@14.7g/t 8.9 m@18.7g/t
64.3 m @ 7.4g/t 6.2 m@5.9g/t
49.7 m@5.5g/t 5.0 m@10.9g/t
7.0m@2.9g/t
BS18DD392M
No significant intersections 500 m
NYSE: GSS
42
TSX: GSCWassa South: Drilling Update and Plan
N S • 2018 and 2019 drilling
19300N
19200N
19100N
19000N
18900N
18700N
18500N
19400N
programs revised to
align with decisions
made during Board
technical committee
meeting
B Shoot mined • B Shoot: planned
stopes
Indicated conversion
drilling of 94 holes
BS18DD393M totaling ~52 km
Current depth 363.5m
1500 m
Geodrill test holes
• F Shoot (South):
OGD test holes planned N-S Inferred
Mineral Resource
AMS test holes extension drilling of 20
holes totaling ~21 km
of drilling
600 m BLY LF230 • Directional holes
BS18DD391D2 oriented to south to
Current depth 667m
TD 875m enable easier drilling
due to natural tendency
BLY KWL of holes to deviate in
BS18DD392D1 this direction
current depth 481.5m, total
depth 1200m
• Preparation of budgets
is underway
NYSE: GSS
43
TSX: GSCNew Target: 242 Foot Wall Zone
NW Proposed follow up DD
holes
SE
X Sect 8900WE
24217DD006
7.0m @ 8.2g/t 200m
Portal • Wassa has numerous additional drill targets, which will be tested
N
further over the next few years
• The 242 FW target occurs in the NW limb of the large F4 fold
closure, which changes the orientation of the ore zones from N-S
24217DD006
Wassa striking and moderately dipping to a NE–SW striking zone, which
Underground dips shallow to SE
• Robust target which could be accessed via separate underground
infrastructure
NYSE: GSS
44
TSX: GSCWassa Exploration Potential Along Strike
Wassa plant Wassa Main
site
SAK
Ballyebo
Ballyebo
South
• Geophysical and geochemical anomalies delineate the Wassa mineralized trend 5,400m
south of the last step out deep drilling fence (18700 N)
• 200 m step out fences along this trend have been planned for 2019 and will continue to test
the down plunge extensions of mineralization to the south
• Additional high grade targets require follow up along the SAK–Ballyebo Trend
NYSE: GSS
45
TSX: GSCFather Brown Satellite Deposit: Snapshot
Potential to provide high grade, underground feed to Wassa processing plant
as part of the strategy to ‘fill the mills’
Father Brown is located 85km from Wassa
processing plant
Father Brown and other nearby pits mined from
2011-2015 – production of approximately 300koz
(2.2Mt at 4.4 g/t Au in total, including grade of
~5.2 g/t Au from Father Brown)
Existing Indicated and Inferred Mineral Resources
of 479koz (2.7Mt grading 5.42 g/t Au)
Two DD rigs have commenced drilling to further
investigate underground mining potential
Mineral Resources expected to increase through
further drilling
Existing infrastructure including haul road,
workshops and camp – reduced capital
requirement to commence underground Father Brown high grade vein1
production
NYSE: GSS 1. Photos taken when Father Brown was being mined as an open pit operation.
46
TSX: GSCFather Brown Geology
• Father Brown/Adiokrom
Legend deposits are hosted
PGN_Structures within the Mpohor
intrusive complex
Type
• Mpohor intrusive complex
Fault_undifferentiated
is composed of gabbros,
Mpohor Intrusive
Late Brittle Fault
grano-diorites and
Complex D3_SZ
diorites
( ( D1_thrusts
PGN_Lithologies • Gold mineralization is
late in comparison with
Lithology Wassa
DOL
SED
• Gold mineralization is
FV
associated with discrete
Manso Trend
shear/fault zones
Qfpo
FBZ ADK Pits
GRA
• Gold occurs with quartz
GDIO_Mag
veining, pyrite and
GDIO intense silica and K-spar
TON alteration
DIO
MF • Free gold is commonly
GAB seen along the Father
Brown structure
NYSE: GSS
47
TSX: GSCFather Brown Drilling Update & Drill Plan
N Father Brown
S
2019 Planned
holes ~15,000 m Pit
Adiokrom
Pit
Limit of
current
Mineral
Resource
DD holes drilled to
date: 8 holes totaling
3,500 m
2018 Planned
200 m
holes ~5,000 m
NYSE: GSS
48
TSX: GSCFather Brown Cross Section 33000 N
W Adiokrom Pit
E • Adiokrom structure strikes
roughly N-S (mine grid)
and dips ~65 degrees to
the west
ADKDD026 • Father Brown structure is
12.0m@7.2g/t ADKDD033
8.0m@9.1g/t much more shallow
dipping: ~40 degrees to
West and striking 160
FUG18RC001 degrees
ADKDD036 Assays pending
6.1m@2.6g/t
• Father Brown appears to
pinch out to the North
Limit of current Mineral
Resource where Adiokrom
mineralization intensifies
FUG18DD001A
Projected intersection Assays pending
of Father Brown and • Intersection of the two
Adiokrom structures 200 m structures at depth
remains a good target
and could potentially
DD Grade legend
result in a large dilation
> 10g/t zone or “blow out” at
5.0 – 10.0g/t depth
1.5 – 5.0g/t
1.0 – 1.5g/t
0.5 – 1.0g/t
NYSE: GSS
49
TSX: GSCFather Brown Cross Section 32900 N
W E • Conceptual grade models and
Father underground mining studies
Brown
Pit suggest that Father Brown has
potential to be a viable
underground operation should
average width and grade
FBZDD064
continue to ~500 m elevation
3.1m @ 3.1 g\t Au
FBZDD077
FBZDD062
6.2m @ 6.0 g\t Au
• Current drilling planned to test
2.0m @ 3.5 g\t Au Mineral Resource to this
FBZDD048
1.1m @ 10.2 g\t Au elevation on 100 m spaced
Limit of current
Mineral Resource fences
FBZDD063
3.4m @ 3.0 g\t Au
FBZDD080
1.8m @ 2.1 g\t Au
FUG18DD006 500 m elevation
Assays pending
200 m
DD Grade legend
> 10g/t
5.0 – 10.0g/t
1.5 – 5.0g/t
1.0 – 1.5g/t
0.5 – 1.0g/t
NYSE: GSS
50
TSX: GSCNew Target: High Grade Subriso West
S Benso SW (mined out pit)
N Wassa
Plant
3.7m@96.9 g/t
1.7m@63.2g/t Father
8.6m@9.8 g/t
Brown
4.9m@5.6g/t 10.1m@9.4g/t existing
haul road
4.4m@8.2g/t 11.8m@3.7g/t Benso
SW Pit
15.5m@6.2g/t 7.2m@10.4g/t
8.0m@2.8g/t
12.4m@2. g/t
8.0m@5.8g/t
14.1m@3.9g/t
6.4m@3.4g/t
6.5m@1.6g/t
13.2m@1.7g/t
2.6m@3.9g/t
NYSE: GSS
51
TSX: GSCOther New Targets
Wassa Numerous other targets requiring drilling follow up
• 165 km of IP conducted in 2010 with drilling
targets requiring testing
• Father Brown area reviewed by consulting
geologist Dr Rael Lipson
• 25 high priority targets identified
Chichiwelli
Benso
Manso Trend
Essaman Wiredukrom
Abada
Father Brown
NYSE: GSS
52
TSX: GSCWassa Complex: Summary
• Focusing on optimizing the mine to
• Strong performance
maximize margin inand
first 9 months
cash flow
ofgeneration
2018 – on track to achieve FY
guidance
• Continuing to improve the
• Well-positioned to maintain 3,400
understanding of the ore body with tpd
underground production rate with
increasing depth
mining sequence working well
• Driving continuous improvement
• Infrastructure upgrades underway to
• allow for 4,000that
Ensuring tpd production
the rate on
upgraded
a underground
consistent basis by is
fleet mid-2020
fully utilized to
achieve a mining average rate of
• Under-utilized capacity in decline and
3,400 tpd in 2019
processing plant – no bottleneck to
• expansion
Higher grade underground production
ensures mine remains robust to
• Significant exploration
sensitivities upside grade
of gold price, potential
and
attonnage
Wassa South and Father Brown
satellite deposit
NYSE: GSS
53
TSX: GSCQUESTIONS?
NYSE: GSS
54
TSX: GSCYou can also read