Annual plankton community metabolism in estuarine and coastal waters in Perth (Western Australia) - PeerJ
←
→
Page content transcription
If your browser does not render page correctly, please read the page content below
Annual plankton community metabolism
                                   in estuarine and coastal waters in Perth
                                   (Western Australia)
                                   Susana Agusti1 ,* , Lorena Vigoya2 ,3 ,* and Carlos Manuel Duarte1 ,*
                               1
                                 Red Sea Research Center, King Abdullah University of Science and Technology (KAUST), Thuwal,
                                 Saudi Arabia
                               2
                                 The UWA Oceans Institute, University of Western Australia, Crawley, WA, Australia
                               3
                                 Present address: AECOM, Auckland, New Zealand
                               *
                                 These authors contributed equally to this work.

                                       ABSTRACT
                                       The planktonic metabolic balance that is the balance between gross primary production
                                       (GPP) and community respiration (CR) was determined in Matilda Bay (estuarine)
                                       and Woodman Point (coastal) in Perth, Western Australia. The rates of net community
                                       production (NCP = GPP – CR) and the ratio between GPP and CR (P/R) were assessed
                                       to evaluate whether the metabolic balance in the two coastal locations tends to be
                                       net autotrophic (production exceeding community respiration) or net heterotrophic
                                       (respiration exceeding production). We also analyzed environmental variability by
                                       measuring temperature, salinity, and nutrients and chlorophyll a concentration.
                                       Samples were collected biweekly from March 2014 to March 2015. During the study
                                       period the metabolic rates were three times higher in Matilda Bay than in Woodman
                                       Point. The predominant metabolism was net autotrophic at both sites with P/R ratios
                                       >1 in the majority of the sampling dates. In Matilda Bay, the metabolic rates were
                                       negatively correlated with salinity denoting river dynamics influence, and positively
                                       with chlorophyll a. In Woodman Point only the GPP was positively correlated with
                                       chlorophyll a. The positive correlation between P/R ratio and GPP in Matilda Bay
                                       and the positive correlations between the metabolic rates and chlorophyll a suggest
Submitted 19 February 2018             that factors controlling autotrophic processes are modulating the planktonic metabolic
Accepted 4 June 2018                   balance in the coastal marine ecosystem in Perth. Significant correlations were found
Published 26 June 2018                 between CR and GPP-standardized to chlorophyll a and water temperature. The
Corresponding author                   net autotrophic metabolic balance indicates that in both ecosystems planktonic
Susana Agusti,                         communities are acting as a sink of CO2 and as a source of organic matter and oxygen
susana.agusti@kaust.edu.sa
                                       to the system and are able to export organic matter to other ecosystems.
Academic editor
Monique Messié
Additional Information and         Subjects Ecology, Marine Biology, Biogeochemistry, Biological Oceanography
Declarations can be found on       Keywords Planktonic metabolic balance, Net community production (NCP), Gross primary
page 13                            production (GPP), Community respiration (CR), Indian Ocean, Swan river estuary, Temperature
DOI 10.7717/peerj.5081

    Copyright                      INTRODUCTION
2018 Agusti et al.
                                   Plankton metabolism is a fundamental property of marine ecosystem driving the flux
Distributed under                  of gases and the transference of organic matter to the food web (Duarte, Agustí &
Creative Commons CC-BY 4.0
                                   Regaudie-de Gioux, 2011). The metabolism of plankton communities in the open ocean is
OPEN ACCESS                        in approximate balance, i.e., with gross primary production (GPP) similar to community

                                   How to cite this article Agusti et al. (2018), Annual plankton community metabolism in estuarine and coastal waters in Perth (Western
                                   Australia). PeerJ 6:e5081; DOI 10.7717/peerj.5081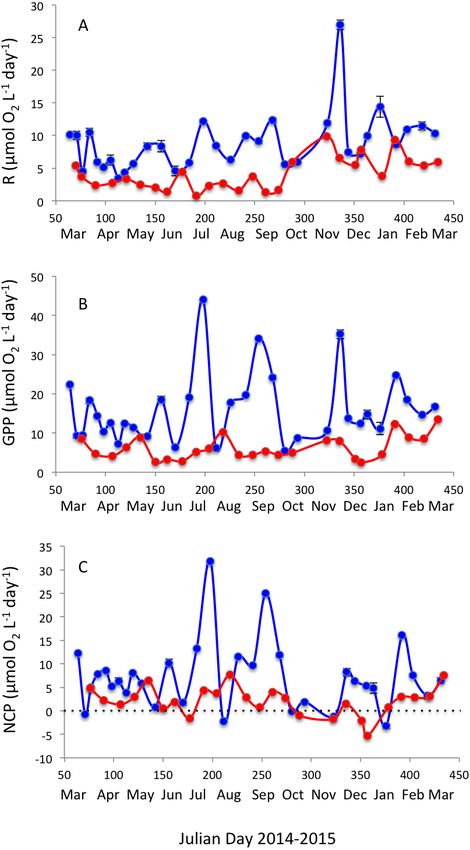
respiration (CR) and a P/R ratio close to 1.0, or experiences small deviations from this
                                    balance (Williams et al., 2013; Duarte et al., 2013), because deviations from such balance
                                    require external fluxes of nutrients or organic carbon, which are small. In contrast,
                                    coastal plankton communities, which typically present higher metabolic rates (Duarte
                                    & Agustí, 1998), may have large deviations from metabolic balance with either excess
                                    respiration over production when the ecosystem receives large inputs of labile organic
                                    carbon (e.g., Mediterranean coastal areas, Duarte, Agustí & Vaqué, 2004; Vidussi et al.,
                                    2011) or gross primary production in excess of respiration when the ecosystem receives
                                    large inputs of dissolved inorganic nutrients (e.g., Agustí, Satta & Mura, 2004).
                                       The metabolic balance of coastal ecosystems plays an important role in determining their
                                    role as CO2 sources or sinks (Borges, 2005; Cai, 2011). Recently, a contrasting role between
                                    continental shelves acting as sinks and near-shore ecosystems as sources of atmospheric
                                    CO2 was proposed to reconcile opposing views on the role of coastal ecosystems as CO2
                                    sources or sinks (Chen & Borges, 2009; Cai, 2011). In particular, inner estuaries are believed
                                    to act as sources of CO2 to the atmosphere due to a prevalence of heterotrophic ecosystem
                                    metabolic status fueled by land-derived inputs of organic carbon whereas outer reaches of
                                    estuaries tend to be CO2 sinks (Odum & Hoskin, 1958; Odum & Wilson, 1962; Heip et al.,
                                    1995; Kemp et al., 1997; Gattuso, Frankignoulle & Wollast, 1998; Hopkinson & Smith, 2005).
                                       However, virtually all of the results from near-shore and open coastal ecosystems thus far
                                    refer to those in the northern hemisphere, particularly Europe, the USA and Asia (Borges,
                                    2005; Chen & Borges, 2009; Cai, 2011). As these typically represent highly populated areas
                                    with watersheds supporting intense agricultural practices, the results may not be directly
                                    transferable to coastal areas in the southern hemisphere. The metabolism of Australian
                                    coastal waters was recently studied by McKinnon et al. (2013) and McKinnon et al. (2017).
                                    Autotrophic plankton metabolism prevailed in the coastal zone of the Great Barrier Reef
                                    (GBR) (McKinnon et al., 2013), despite being located in the wet Australian tropics with
                                    a distinct rainy season. Moreover, the inshore area was even more strongly autotrophic
                                    than the offshore region of the GBR, which is in contrast to the expectation that inshore
                                    coastal waters should be heterotrophic. Coastal waters adjacent to Northern Australia were
                                    also predominantly autotrophic (McKinnon et al., 2017). Whether autotrophic metabolism
                                    could prevalent in other regions of Australia is, thus far, unresolved.
                                       Here we report plankton metabolic rates for two contrasting coastal sites in the Perth
                                    area in temperate Western Australia, Matilda Bay, an inshore-site in the Swan river estuary,
                                    and Woodsman Point, an open coastal site. Specifically, we assessed biweekly during a
                                    year (March 2014 to March 2015) community respiration, gross primary production and
                                    net community production, along with temperature, salinity, dissolved inorganic nutrient
                                    concentration, and chlorophyll a concentration.

                                    METHODS
                                    Matilda Bay is located in the lower reaches of the Swan River. Swan is one of the main
                                    rivers in Western Australia with an extension of more than 50 km and a catchment area
                                    about 190,000 Km2 (Thompson, 1998). The estuary has been open to the ocean since 1987

Agusti et al. (2018), PeerJ, DOI 10.7717/peerj.5081                                                                          2/16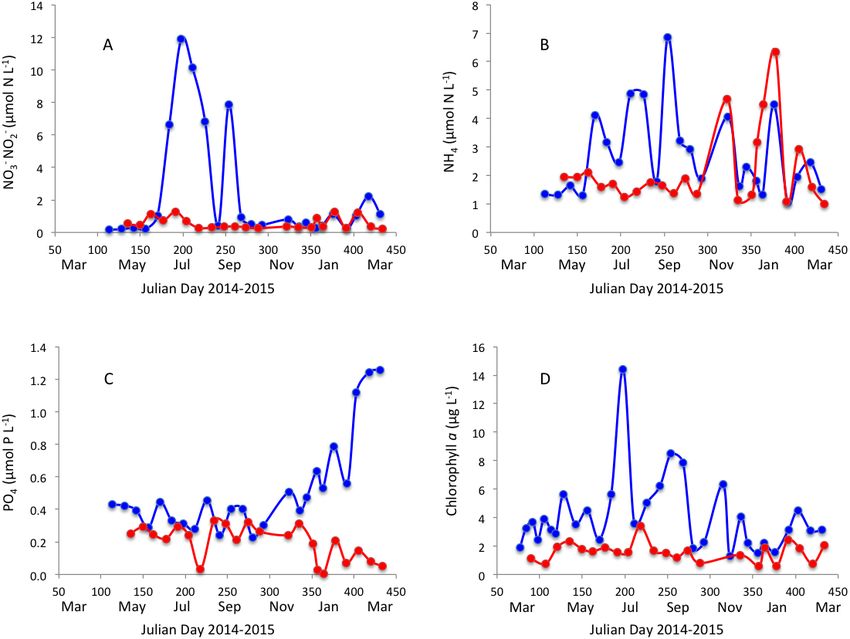
when a rocky bar near to the mouth of the estuary in Fremantle was removed. The estuary
has a seasonal cycle influenced by rainfall with wet and cool winters with about 90% of
the annual rain and hot and dry summers (Thompson, 1998; Hamilton et al., 2006). During
winter most of the water body is fresh because of the rainfall and runoff but the salinity
increases upstream when the rainfall decreases and the system receive a significant flow
of oceanic waters (Thompson, 1998). The estuary has received anthropogenic pressure
because of land clearing for agricultural purposes, urbanization, dam construction and
other factors (Chan et al., 2002; Thompson, 1998). Consequently, nutrient inputs and
sedimentation rates have increased and the water quality has decreased (Chan et al., 2002;
Hamilton et al., 2006). Gedaria (2012) reported that salinity and temperature are the main
drivers of the variation in phytoplankton biomass in the Swan River estuary. Woodman
Point is located in the Owen Anchorage in the Coast of Cockburn Sound (Perth, Western
Australia), and, in contrast with Matilda Bay, represents an open shoreline with no direct
freshwater influence. Cockburn Sound area was a place of industrial activity reducing
coastal water quality in the 1950 s due to phytoplankton blooms (Cambridge & McComb,
1984). However, the water quality has improved since the mid-1990 s due to the reduction
of nutrients inputs from industrial activities (Kendrick et al., 2002). The coastal area of
Western Australia is also influenced by the Leeuwin Current, a poleward-flowing eastern
boundary current characterized by warm waters with low salinity and low nutrients, but
weakening between November and March (Cresswell & Golding, 1980).
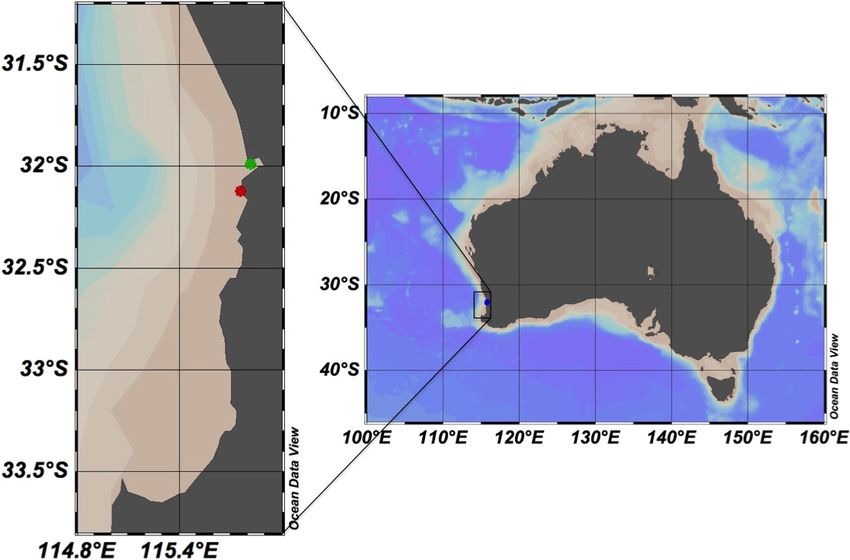
Sub-surface water samples were collected at biweekly intervals between March 2014
to March 2015 in Matilda Bay (−31.9904◦ S, 115.8181◦ E; Fig. 1) and the Ammunition
Jetty, Woodman Point (−32.1241◦ S, 115.7586◦ E; Fig. 1). The free software Ocean Data
View (Schlitzer, 2016), version 4.7.10, was used to generate the study area map. Samples
were then transported to incubated and processed at the University of Western Australia
(UWA). Temperature (◦ C), salinity and dissolved oxygen were measured through the
water column by deploying a calibrated YSI EXO1 Multi-parameter Water Quality Sonde
fitted with a pressure sensor (±0.04 m), temperature (±0.01 ◦ C), conductivity sensor, and
an optode dissolved oxygen sensor. In addition, surface water temperature was measured
from the water collected by a digital thermometer.
Net community production, gross primary production, and community respiration
were quantified by changes in dissolved oxygen using micro-Winkler techniques by the
use of a precise automatic titration based on redox potentiometric endpoint (Oudot et al.,
1988). Water collected in each site was siphoned into 21 calibrated glass 100 ml borosilicate
Winkler bottles. Seven bottles were fixed immediately to measure initial oxygen, another
seven bottles were incubated in the light and the last seven bottles were incubated in the
dark. The incubation, starting between 8 to 9 AM, was run for 24 h in situ conditions
of temperature and natural solar radiation in an outdoor, temperature controlled tank.
After the incubation, samples were fixed and the final oxygen was measured using a
high-precision autotitrator (Compact Titrator G20; Mettler Toledo, Columbus, OH,
USA). NCP rates were determined from the oxygen change in the clear bottles (oxygen
clear –initial oxygen), CR rates were determined from the oxygen change in the dark bottles
(initial oxygen–dark oxygen) and GPP rates were calculated as the sum of CR and NCP
Agusti et al. (2018), PeerJ, DOI 10.7717/peerj.5081 3/16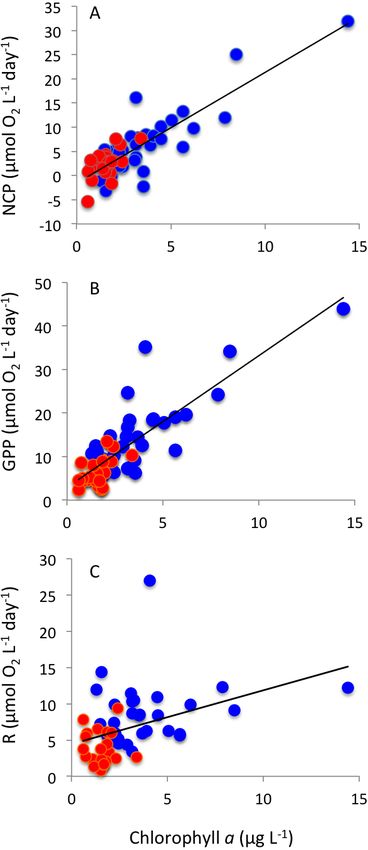
Figure 1 Map showing the study area in Western Australia. The stations sampled in the coast of Perth
                                     are marked with green (Matilda Bay) and red (Woodman Point) dots. The free software Ocean Data View
                                     (Schlitzer, 2016), version 4.7.10, was used to generate the study area map.
                                                                                                         Full-size DOI: 10.7717/peerj.5081/fig-1

                                    (Duarte, Agustí & Regaudie-de Gioux, 2011). Model II regression was used to analyse the
                                    relationships between CR, NCP, and GPP.
                                       Aliquots of 200 ml were used for chlorophyll a analyses using acetone extraction and
                                    fluorometric determination after Parsons, Maita & Lalli (1984). Subsamples were filtered
                                    through Whatman grade GF/F glass microfiber filters of 25 mm diameter. Filters were
                                    placed in plastic tubes of 1 ml and stored at −20 ◦ C until analysis. Filters were immersed
                                    in acetone at 90% during 24 h for chlorophyll a extraction. After that period, chlorophyll a
                                    fluorescence was measured by the use of a Trilogy Laboratory Fluorometer (Turner Designs)
                                    equipped with a module of Chlorophyll a Non-Acidification Fluorescent Module (CHL-A
                                    NA) at UWA. The fluorometer was calibrated with pure chlorophyll a (Sigma-Aldrich
                                    C6144-1mg; Sigma-Aldrich, St. Louis, MO, USA) solution.
                                       Samples for dissolved inorganic nutrient analyses were collected during transportation
                                    to the laboratory and kept frozen until analysis in a segmented flow autoanalyzer following
                                    standard procedures Samples (Hansen & Koroleff, 1999).
                                       The temperature response of plankton communities was described by fitting, using least
                                    squares regression analysis, the Arrhenius equation,

                                    Ln Y = A exp−AE/kT

Agusti et al. (2018), PeerJ, DOI 10.7717/peerj.5081                                                                                         4/16
Table 1 Mean (± SE) of the variables measured in Matilda Bay and Woodman Point (Western Aus-
tralia).
Matilda bay Woodman point
Mean ± SE (N = 33) Mean ± SE (N = 27)
◦
Temperature ( C) 20.90 0.66 20.79 0.57
Salinity 32.09 0.95 35.13* 0.29
Ammonia (µmol N L−1 ) 2.68 0.30 2.17 0.29
Nitrate (µmol N L−1 ) 2.32 0.71 0.56* 0.08
Phosphate (µmol P L ) −1
0.52 0.06 0.20 *
0.02
Chlorophyll a (µg Chl a L−1 ) 4.05 0.47 1.68* 0.14
Respiration (µmol O2 L−1 d−1 ) 8.81 0.76 4.33* 0.48
NCP (µmol O2 L−1 d−1 ) 7.21 1.29 2.32* 0.61
GPP (µmol O2 L −1 −1
d ) 16.05 1.56 6.23* 0.60
P/R 1.91 0.14 2.05 0.27
Notes.
NCP, net community production; GPP, gross primary production; P/R, is the ratio of GPP over R.
*denotes statistically significant difference (t -test, P < 0.05).
where Y is the property of interest, AE is the activation energy (eV), k is the Boltzmann’s
constant (8.617734 10–5 eV◦ K−1 ) and T is the sea-surface water temperature (◦ K), and A
is a fitted intercept (Regaudie-de Gioux & Duarte, 2012).
RESULTS
Surface water temperature ranged from 12.0 to 27.4 ◦ C and 15.1 to 25.0 ◦ C (Fig. 2A) and
salinity ranged from 22.03 to 36.97 PSU and 31.6 to 37.1 PSU (Fig. 2B) in Matilda Bay and
Woodman Point, respectively. The minimum salinity was reached in late winter and spring
in Matilda Bay, following river discharge, and while the pattern was less clear in Woodman
Point, the lowest salinity was also observed in winter and early spring (Fig. 2B). Dissolved
inorganic nitrogen concentration was highest in winter, but phosphate concentration was
highest in late summer in Matilda Bay (Figs. 3A–3C ). In contrast, nitrate and phosphate
concentrations in Woodman Point were lower (P < 0.05) than those in Matilda Bay
(Table 1) and dissolved inorganic nitrogen concentration showed two maxima, winter
and summer, while phosphate concentrations showed a summer minima (Figs. 3A–3C).
Chlorophyll a concentration was significantly higher and more variable in Matilda Bay than
in Woodman Point (Table 1, Fig. 3D), and reached the highest values in winter, at the time
of peak nitrate concentration (Fig. 3D), as there was a significant, positive, relationship
between chlorophyll a concentration and nitrate concentration (r = 0.67, P < 0.0001).
Respiration rates were, on average, twice as high in Matilda Bay as in Woodman Point
(Table 1), and increased strongly toward summer in Woodman Point whereas it showed
less seasonal variability in Matilda Bay (Fig. 4A). Gross primary production was also much
higher in Matilda Bay than in Woodman Point (Table 1), with no clear seasonal pattern at
either site (Fig. 4B). The communities were generally autotrophic, with GPP about twice
as high as R (NCP and P/R >1, Table 1), with NCP being three times higher, on average, at
Agusti et al. (2018), PeerJ, DOI 10.7717/peerj.5081 5/16Figure 2 Temporal variability in seawater temperature and salinity. Changes in surface seawater tem-
perature (A) and salinity (B) in Matilda Bay are shown in blue line and symbols, and in Woodman Point
in red line and symbols, over time.
Full-size DOI: 10.7717/peerj.5081/fig-2
Matilda Bay than at Woodman Point (Table 1, Fig. 4C), and neither community displayed
any clear seasonal trend in net community production along the year (Fig. 4C). GPP
was significantly correlated with CR (r = 0.68, P < 0.0001), but NCP increased strongly
with increasing GPP (Fig. 5). Net community production and gross primary production
increased with increasing chlorophyll a concentration (NCP, R2 = 0.73, P < 0.0001;
Agusti et al. (2018), PeerJ, DOI 10.7717/peerj.5081 6/16Figure 3 Nutrients and chlorophyll a variability. Changes in (A) nitrate, (B) ammonium, (C) phos-
phate and (D) chlorophyll a concentration in Matilda Bay (blue line and symbols) and Woodman Point
(red line and symbols) over time.
Full-size DOI: 10.7717/peerj.5081/fig-3
GPP, R2 = 0.69, P < 0.0001), with the relationship between community respiration rate
and chlorophyll a being much weaker (CR, R2 = 0.15, P = 0.0036) albeit also significant
(Figs. 6A–6C).
Respiration rates increased with increasing temperature, resulting in an activation
energy of 0.76 ± 0.21 eV (Fig. 7A). GPP showed, in contrast, no significant temperature-
dependence (P > 0.05). Indeed, when standardized to chlorophyll a, as observed in
previous studies (e.g., Regaudie-de Gioux & Duarte, 2012; Garcia-Corral et al., 2017), there
was a significant temperature-dependence of gross primary production, with an activation
energy of 0.69 ± 0.12 (Fig. 7B), comparable to that of community respiration.
DISCUSSION
Chlorophyll a values were higher in Matilda Bay than in Woodman point, but all values
ranged within those reported for coastal waters around Perth (Pearce, Lynch & Hanson,
2006). The highest chlorophyll a concentration in both Matilda Bay and Woodman point
occurred at the low salinity winter events. Chlorophyll a concentration in the Swan River has
been reported to vary seasonally showing large interannual variability (Thompson, 1998).
Agusti et al. (2018), PeerJ, DOI 10.7717/peerj.5081 7/16Figure 4 Planktonic metabolism. Changes in (A) community respiration rate, (B) gross primary pro-
duction, and (C) net community production in Matilda Bay (blue line and symbols) and Woodman Point
(red line and symbols) over time.
Full-size DOI: 10.7717/peerj.5081/fig-4
Agusti et al. (2018), PeerJ, DOI 10.7717/peerj.5081 8/16Figure 5 The relationship between net community production and gross primary production The
solid line shows the fitted regression equation: NCP (mmol O2 m−3 d−1 ) = −2.65 + 0.65(± 0.05) GPP
(mmol O2 m−3 d−1 ) (R2 = 0.75, P < 0.0001). Blue symbols and red symbols correspond to Matilda Bay
and Woodman Point, respectively.
Full-size DOI: 10.7717/peerj.5081/fig-5
Both coastal ecosystems, but particularly Matilda Bay, supported productive communities,
as reflected in high GPP rates.
Community respiration rates were less variable than GPP, particularly at Matilda
Bay, but GPP sufficed to support all carbon demands from the community generating
excess organic matter. This resulted in the prevalence of autotrophic communities at both
sites, with average P/R ratios above 2.0 similar across both sites. This is expected from
relatively productive sites with GPP well above the threshold previously determined to
delineate autotrophic from heterotrophic communities (Duarte & Agustí, 1998; Duarte
& Regaudie-de Gioux, 2009). Net community production was strongly correlated with
chlorophyll a concentration, accounting for the much higher NCP in productive Matilda
Bay compared to Woodman Point plankton communities, suggesting that the metabolic
balance of plankton communities in the coast of Perth is regulated by factors controlling
autotrophic processes, such as nutrient inputs, salinity regimes and temperature. In coastal
waters of Northern Australia, McKinnon et al. (2017) also observed that the metabolism
and community respiration were autotrophic and positively related to chlorophyll a
concentration.
The results presented here contribute to address a paucity of studies of plankton
community metabolism in the Indian Ocean (Regaudie-de Gioux & Duarte, 2013). Robinson
& Williams (1999) studied the planktonic metabolic balance during a research cruise in
the Gulf of Oman, reporting P/R ratios for surface waters between 1.17 and 2.43, with
Agusti et al. (2018), PeerJ, DOI 10.7717/peerj.5081 9/16Figure 6 Plankton metabolism and phytoplankton. The relationship between (A) net community pro-
duction, (B) gross primary production and (C) community respiration and chlorophyll a concentration.
The solid lines show the fitted regression equations: (A) NCP (mmol O2 m−3 d−1 ) = −1.54 + 2.29 (±0.19)
Chl a (µg Chl a L−1 ) (R2 = 0.73, P < 0.0001); (B) GPP (mmol O2 m−3 d−1 ) = 2.93 + 3.03 (±0.05) Chl a
(µg Chl a L−1 ) (R2 = 0.69, P < 0.0001); and (C) R (mmol O2 m−3 d−1 ) = 4.45 + 0.74 (±0.24) Chl a (µg
Chl a L−1 ) (R2 = 0.15, P = 0.0036). Blue symbols and red symbols correspond to Matilda Bay and Wood-
man Point, respectively.
Full-size DOI: 10.7717/peerj.5081/fig-6
Agusti et al. (2018), PeerJ, DOI 10.7717/peerj.5081 10/16Figure 7 Thermal relationships. Arrhenius plots showing the relationship between the natural log of (A)
community respiration and (B) gross primary production standardized to chlorophyll a, and 1/kT, where
k is the Boltzmann’s constant (8.617734 10–5 eV ◦ K−1 ) and T is the sea-surface water temperature (◦ K) in
Matilda Bay (blue symbols) and Woodman Point (red symbols). The solid lines show the fitted equations:
ln R (mmol O2 mg m−3 d−1 ) = 31.87–0.76 (±0.21) 1/kT (R2 = 0.21, P = 0.0008) and ln GPP/Chl a (mmol
O2 mg Chl a−1 d−1 ) = 28.8–0.69 (±0.12) 1/kT (R2 = 0.41, P < 0.0001).
Full-size DOI: 10.7717/peerj.5081/fig-7
the highest ratio near to the Omani coast (Regaudie-de Gioux & Duarte, 2013; Robinson
& Williams, 1999). Indeed, the P/R ratio of the station closer to the Omani coast, 2.43
(Robinson & Williams, 1999) was similar to the P/R ratio for out study sites in the Western
Australia coast. More recently, McKinnon et al. (2017) in a comprehensive study of the
metabolism of planktonic communities in the North of Australia, found that Indian Ocean
communities from Ningaloo Reef and Exmouth Gulf (North Western Australia coast) were
also predominantly net autotrophic.
Our results indeed showed a prevalence of net autotrophic metabolism in plankton
communities of the Coast of Perth (Western Australia), both at the productive estuarine
waters at Matilda Bay and the open coastal Indian Ocean waters at Woodman Point.
This indicates that planktonic communities in these coastal locations act as strong CO2
Agusti et al. (2018), PeerJ, DOI 10.7717/peerj.5081 11/16sinks and sources of organic matter and oxygen to the system. This is in contrast to the
expectation that near-shore ecosystems act as sources of atmospheric CO2 , proposed to
reconcile opposing views on the role of coastal ecosystems as CO2 sources or sinks (Chen
& Borges, 2009; Cai, 2011). Indeed, the pattern showed here, with higher net community
production in the inner waters of Matilda Bay compared to the more open waters at
Woodman Point agree with prior findings for Australian GBR where inshore areas being
more strongly autotrophic than offshore waters (McKinnon et al., 2013).
The plankton communities in the coastal waters of Perth showed increased metabolic
rates with increasing temperature, as expected from metabolic theory of ecology (Brown et
al., 2004). However, the activation energy for gross primary production of 0.69 ± 0.12 eV
found here was well below that found in previous analyses of Indian Ocean communities.
Garcia-Corral et al. (2017) reported for Indian Ocean open-ocean waters a gross primary
production Ea (standardized to chlorophyll a) of 1.70 eV. Also, whereas consistent with
other assessments (e.g., Regaudie-de Gioux & Duarte, 2012; Garcia-Corral et al., 2017),
the activation energy for community respiration was higher than that for gross primary
production, this difference was small and not statistically significant. This is important as it
predicts that warming events, such as the heat wave that impacted marine ecosystems across
Western Australia in 2011 (Wernberg et al., 2016), will affect gross primary production and
respiration rates of plankton communities in a similar way.
The net autotrophic communities encountered in the coastal system studied in Western
Australia suggest that these pelagic communities produce organic matter in excess, thereby
exporting organic matter either to the underlying benthic compartment or offshore. For
instance, analysis of carbon stocks in Matilda Bay sediments, which support seagrass
meadows, have shown the organic carbon to be partially of planktonic origin along
with contributions of the seagrass themselves (Rozaimi, Serrano & Lavery, 2013). Hence,
both the pelagic and benthic compartments of Matilda Bay appear to be autotrophic,
although the contributions of the benthic compartment to ecosystem metabolism were not
addressed here. We, therefore, provide only one of the components, pelagic metabolism,
that determine ecosystem metabolic budgets, which include contributions from benthic
compartments as well as exchanges, either import or export, with adjacent ecosystems.
CONCLUSIONS
Our results indicated that planktonic communities in the two coastal Western Australia
locations studied act as strong CO2 sinks and sources of organic matter and oxygen to
the system. The plankton communities of the Coast of Perth (Western Australia) showed
net autotrophic metabolism both at the productive estuarine waters at Matilda Bay and
the open coastal Indian Ocean waters at Woodman Point. This result is in contrast to
the expectation of net heterotrophic balance for near-shore ecosystems, but in agreement
with the few metabolic balance assessments from Australian coastal waters. The thermal
relationships indicated that warming may decrease the strong capacity observed for CO2
sinks. Our study is based on two contrasting plankton communities in Western Australia
and, while useful to address the absence of reports on plankton community metabolism
Agusti et al. (2018), PeerJ, DOI 10.7717/peerj.5081 12/16in the Indian Ocean coast of Australia, and the paucity of reports across the Indian Ocean
(Regaudie-de Gioux & Duarte, 2013), a broader analysis of coastal plankton communities
across Western Australia is required to confirm the patterns revealed here and diagnose
the role of plankton communities in across Western Australia in carbon fluxes and their
likely response to future warming.
ACKNOWLEDGEMENTS
We thank Lara García Corral and María Comesaña for their assistance with sampling and
analyses.
ADDITIONAL INFORMATION AND DECLARATIONS
Funding
This research was funded by the Australian Research Council’s Discovery Project (project
number DP140100825) and the King Abdullah University of Science and Technology
(KAUST) base line funding BAS/1/1072-01-01 to Susana Agusti. The funders had no role
in study design, data collection and analysis, decision to publish, or preparation of the
manuscript.
Grant Disclosures
The following grant information was disclosed by the authors:
Australian Research Council’s Discovery Project: DP140100825.
King Abdullah University of Science and Technology (KAUST): BAS/1/1072-01-01.
Competing Interests
Susana Agusti is an Academic Editor for PeerJ. Lorena Vigoya is employed by AECOM.
She participated in the study while getting her masters degree at the University of Western
Australia.
Author Contributions
• Susana Agusti conceived and designed the experiments, analyzed the data, contributed
reagents/materials/analysis tools, prepared figures and/or tables, authored or reviewed
drafts of the paper, approved the final draft.
• Lorena Vigoya performed the experiments, analyzed the data, authored or reviewed
drafts of the paper, approved the final draft.
• Carlos Manuel Duarte conceived and designed the experiments, analyzed the data,
contributed reagents/materials/analysis tools, authored or reviewed drafts of the paper,
approved the final draft.
Data Availability
The following information was supplied regarding data availability:
The raw data are provided in Data S1.
Agusti et al. (2018), PeerJ, DOI 10.7717/peerj.5081 13/16Supplemental Information
Supplemental information for this article can be found online at http://dx.doi.org/10.7717/
peerj.5081#supplemental-information.
REFERENCES
Agustí S, Satta MP, Mura MP. 2004. Summer community respiration and pelagic
metabolism in surface Antarctic waters. Aquatic Microbial Ecology 35:197–205
DOI 10.3354/ame035197.
Borges AV. 2005. Do we have enough pieces of the jigsaw to integrate CO2 fluxes in the
coastal ocean? Estuaries 28:3–27 DOI 10.1007/BF02732750.
Brown JH, Gillooly JF, Allen AP, Savage VM, West GB. 2004. Toward a Metabolic Theory
of Ecology 85:1771–1789.
Cai W-J. 2011. Estuarine and coastal ocean carbon paradox: CO2 sinks or sites of
terrestrial carbon incineration? Annual Review of Marine Science 3:123–145
DOI 10.1146/annurev-marine-120709-142723.
Cambridge ML, McComb AJ. 1984. The loss of seagrasses in Cockburn Sound,
Western Australia. I. The time course and magnitude of seagrass decline
in relation to industrial development. Aquatic Botany 20(3–4):229–243
DOI 10.1016/0304-3770(84)90089-5.
Chan TU, Hamilton DP, Robson BJ, Hodges BR, Dallimore C. 2002. Impacts of
hydrological changes on phytoplankton succession in the Swan River, Western
Australia. Estuaries 25:1406–1415 DOI 10.1007/BF02692234.
Chen CTA, Borges AV. 2009. Reconciling opposing views on carbon cycling in the
coastal ocean: continental shelves as sinks and near-shore ecosystems as sources
of atmospheric CO2. Deep Sea Research Part II: Topical Studies in Oceanography
56:578–590 DOI 10.1016/j.dsr2.2009.01.001.
Cresswell GR, Golding TJ. 1980. Observations of a south-flowing current in the
southeastern Indian Ocean. Deep Sea Research Part A. Oceanographic Research Papers
27:449–466 DOI 10.1016/0198-0149(80)90055-2.
Duarte CM, Agustí S. 1998. The CO2 balance of unproductive aquatic ecosystems.
Science 281:234–236 DOI 10.1126/science.281.5374.234.
Duarte CM, Agustí S, Regaudie-de Gioux A. 2011. The role of marine biota in the
metabolism of the biosphere. In: Duarte CM, ed. The role of marine biota in the
functioning of the biosphere. Spain: Fundacion BBVA, 39–53.
Duarte CM, Agustí S, Vaqué D. 2004. Controls on planktonic metabolism in the bay
of blanes, northwestern mediterranean littoral. Limnology and Oceanography
49:2162–2170 DOI 10.4319/lo.2004.49.6.2162.
Duarte CM, Regaudie-de Gioux A. 2009. Thresholds of gross primary production for the
metabolic balance of marine planktonic communities. Limnology and Oceanography
54:1015–1022 DOI 10.4319/lo.2009.54.3.1015.
Agusti et al. (2018), PeerJ, DOI 10.7717/peerj.5081 14/16Duarte CM, Regaudie-de Gioux A, Arrieta JM, Delgado-Huertas A, Agustí S. 2013. The
oligotrophic ocean is heterotrophic. Annual Review of Marine Science 5:551–569
DOI 10.1146/annurev-marine-121211-172337.
Garcia-Corral LS, Holding JM, Carrillo-de Albornoz P, Steckbauer A, Pérez-Lorenzo
M, Navarro N, Serret P, Gasol JM, Morán XAG, Estrada M, Fraile-Nuez E, Benítez-
Barrios V, Agustí S, Duarte CM. 2017. Temperature dependence of plankton
community metabolism in the subtropical and tropical ocean. Global Biogeochemical
Cycles 31:1141–1154 DOI 10.1002/2017GB005629.
Gattuso JP, Frankignoulle M, Wollast R. 1998. Carbon and carbonate metabolism in
coastal aquatic ecosystems. Annual Review of Ecology and Systematics 29:405–434
DOI 10.1146/annurev.ecolsys.29.1.405.
Gedaria AI. 2012. Niche partitioning of microbial populations in the swan—canning
estuary. Doctoral thesis, The University of Western Australia.
Hamilton DP, Douglas GB, Adeney JA, Radke LC. 2006. Seasonal changes in major ions,
nutrients and chlorophyll a at two sites in the Swan River estuary, Western Australia.
Marine and Freshwater Research 57(8):803–815 DOI 10.1071/MF05046.
Hansen HP, Koroleff F. 1999. Determination of nutrients. In: Grasshoff K, Kremling K,
Ehrhardt M, eds. Methods of seawater analysis. 3rd edition. Germany: Wiley-VCH
Verlag GmbH, 159–228.
Heip CHR, Goosen NK, Herman PMJ, Kromkamp JC, Middelburg JJ, Soetaert KER.
1995. Production and consumption of biological particles in temperate tidal
estuaries. Oceanography and Marine Biology: an Annual Review 33:1–149.
Hopkinson CSJ, Smith EM. 2005. Estuarine respiration: an overview of benthic, pelagic
and whole system respiration. In: Giorgio PA, Williams PJL, eds. Respiration in
aquatic ecosystems. New York: Oxford University Press 122–146.
Kemp WM, Smith EM, Marvin-DiPasquale M, Boynton WR. 1997. Organic carbon
balance and net ecosystem metabolism in Chesapeake Bay. Marine Ecology Progress
Series 150:229–248 DOI 10.3354/meps150229.
Kendrick GA, Aylward MJ, Hegge BJ, Cambridge ML, Hillman K, Wyllie A, Lord DA.
2002. Changes in seagrass coverage in Cockburn Sound, Western Australia between
1967 and 1999. Aquatic Botany 73:75–87 DOI 10.1016/S0304-3770(02)00005-0.
McKinnon AD, Duggan S, Logan M, Lønborg C. 2017. Plankton respiration, produc-
tion, and trophic state in tropical coastal and shelf waters adjacent to northern
Australia. Frontiers in Marine Science 4:346 DOI 10.3389/fmars.2017.00346.
McKinnon AD, Logan M, Castine SA, Duggan S. 2013. Pelagic metabolism in the
waters of the Great Barrier Reef. Limnology and Oceanography 58:1227–1242
DOI 10.4319/lo.2013.58.4.1227.
Odum HT, Hoskin CM. 1958. Comparative studies of the metabolism of Texas bays.
Institute of Marine Science Publications 5:16–46.
Odum HT, Wilson R. 1962. Further studies on the reaeration and metabolism of Texas
bays, 1958–1960. Institute of Marine Science Publications 8:23–55.
Agusti et al. (2018), PeerJ, DOI 10.7717/peerj.5081 15/16Oudot C, Gerard R, Morin P, Gningue I. 1988. Precise shipboard determination of
dissolved oxygen (Winkler procedure) for productivity studies with a commercial
system. Limnology and Oceanography 33:146–150 DOI 10.4319/lo.1988.33.1.0146.
Parsons TR, Maita Y, Lalli CM. 1984. A manual of chemical and biological methods for
seawater analysis. Oxford: Pergamon Press.
Pearce AF, Lynch MJ, Hanson CE. 2006. The Hillarys Transect (1): seasonal and cross-
shelf variability of physical and chemical water properties off Perth, Western
Australia, 1996–98. Continental Shelf Research 26:1689–1729
DOI 10.1016/j.csr.2006.05.008.
Regaudie-de Gioux A, Duarte CM. 2012. Temperature dependence of plank-
tonic metabolism in the ocean. Global Biogeochemical Cycles 26:GB1015
DOI 10.1029/2010GB003907.
Regaudie-de Gioux A, Duarte CM. 2013. Global patterns in oceanic planktonic
metabolism. Journal Limnology and Oceanography 58(3):977–985
DOI 10.4319/lo.2013.58.3.0977.
Robinson C, Williams PJB. 1999. Plankton net community production and dark
respiration in the Arabian Sea during September 1994. Deep Sea Research Part II:
Topical Studies in Oceanography 46:745–765 DOI 10.1016/S0967-0645(98)00126-X.
Rozaimi M, Serrano O, Lavery PS. 2013. Comparison of carbon stores by two mor-
phologically different seagrasses. Journal of the Royal Society of Western Australia
96:81–83.
Schlitzer R. 2016. Ocean data view. Version 4.7.10. Available at http:// odv.awi.de.
Thompson PA. 1998. Spatial and temporal patterns of factors influencing phytoplankton
in a salt wedge estuary, the swan river, Western Australia. Estuaries 21(4):801–817
DOI 10.2307/1353282.
Vidussi F, Mostajir B, Fouilland E, Floc’h EL, Nouguier J, Roques C, Got P, Thibault-
Botha D, Bouvier T, Troussellier M. 2011. Effects of experimental warming
and increased ultraviolet B radiation on the Mediterranean plankton food web.
Limnology and Oceanography 56:206–218 DOI 10.4319/lo.2011.56.1.0206.
Wernberg T, Bennett S, Babcock RC, De Bettignies T, Cure K, Depczynski M, Dufois F,
Fromont J, Fulton CJ, Hovey RK, Harvey ES, Holmes TH, Kendrick GA, Radford
B, Santana-Garcon J, Saunders BJ, Smale DA, Thomsen MS, Tuckett CA, Tuya F,
Vanderklift MA, Wilson S. 2016. Climate-driven regime shift of a temperate marine
ecosystem. Science 353(6295):169–172 DOI 10.1126/science.aad8745.
Williams PJLB, Quay PD, Westberry TK, Behrenfeld MJ. 2013. The oligotrophic ocean
is autotrophic. Annual Review of Marine Science 5:535–549
DOI 10.1146/annurev-marine-121211-172335.
Agusti et al. (2018), PeerJ, DOI 10.7717/peerj.5081 16/16You can also read