3Q20 Earnings Call Presentation - October 21, 2020
←
→
Page content transcription
If your browser does not render page correctly, please read the page content below
3Q20 Earnings Call Presentation
        October 21, 2020
Forward Looking Statements
This presentation contains forward-looking statements made pursuant to the Safe Harbor Provisions of the Private
Securities Litigation Reform Act of 1995. Forward-looking statements involve a number of risks, uncertainties or other
factors beyond the company’s control, which may cause material differences in actual results, performance or other
expectations. These factors include, but are not limited to, the uncertainty of the extent, duration and effects of the
COVID-19 pandemic and the response of governments and other third parties, including government-mandated property
closures, increased operational regulatory requirements or travel restrictions, on our business, results of operations, cash
flows, liquidity and development prospects, general economic conditions, disruptions or reductions in travel and our
operations, due to natural or man-made disasters, pandemics, epidemics, or outbreaks of infectious or contagious
diseases, our ability to invest in future growth opportunities, execute our previously announced capital expenditure
programs in both Macao and Singapore, and produce future returns, new development, construction and ventures,
government regulation, risks relating to our gaming licenses and subconcession, our subsidiaries’ ability to make
distribution payments to us, substantial leverage and debt service, fluctuations in currency exchange rates and interest
rates, gaming promoters, competition, tax law changes, transportation infrastructure in Macao, political instability, civil
unrest, terrorist acts or war, legalization of gaming, insurance, and other factors detailed in the reports filed by Las Vegas
Sands Corp. with the Securities and Exchange Commission. Readers are cautioned not to place undue reliance on these
forward-looking statements, which speak only as of the date thereof. Las Vegas Sands Corp. assumes no obligation to
update such information.

Within this presentation, the company may make reference to certain non-GAAP financial measures including “adjusted
net income/loss,” “adjusted earnings/loss per diluted share,” and “consolidated adjusted property EBITDA,” which have
directly comparable financial measures presented in accordance with accounting principles generally accepted in the
United States of America ("GAAP"), along with “adjusted property EBITDA margin,” “hold-normalized adjusted property
EBITDA,” “hold-normalized adjusted property EBITDA margin,” “hold-normalized adjusted net income/loss,” and “hold-
normalized adjusted earnings/loss per diluted share,” as well as present these or other items on a constant currency basis.
The specific reasons why the company’s management believes the presentation of each of these non-GAAP financial
measures provides useful information to investors regarding Las Vegas Sands’ financial condition, results of operations
and cash flows, as well as reconciliations of the non-GAAP measures to the most directly comparable GAAP measures,
are included in the company’s Form 8-K dated October 21, 2020, which is available on the company’s website at
www.sands.com. Reconciliations also are available in the Reconciliation of Non-GAAP Measures and Other Financial
Information section of this presentation.
                                                                                                                                 2
Las Vegas Sands’ Strategic Priorities
Safety and security of team members and guests
Support for local communities in Macao, Singapore and Las Vegas
Continuation of previously announced capital expenditure programs in both Macao and Singapore
Maintaining strong balance sheet and liquidity required to invest in future growth opportunities
3
Current Operating Status: Recovery Process Continuing in Each
of Our Markets
Macao:
− Our gaming and non-gaming operations in Macao are open, as was the case throughout 2Q20 and 3Q20
− The low levels of revenue generated in 3Q20 reflect meaningfully reduced visitation to the market
− Beginning in September 2020, eligible travelers residing in Mainland China were allowed to apply for visas under the
Individual Visit Scheme (‘IVS’)
o Travelers from Mainland China must obtain both of the following to enter Macao:
• A visa
• A negative COVID-19 test result
− Increasing the number of visas available through the IVS and other visa programs, and the streamlining of testing
procedures, will be important for the recovery
Singapore:
− On July 1st, 2020, the Casino at MBS re-opened to Sands Rewards Club members, Paiza Club members and Annual Levy
Holders
− Guest suites at MBS re-opened during 3Q20
− Reduction in international travel restrictions and increasing airlift into Singapore will be important for the recovery
Las Vegas:
− Our Las Vegas operations re-opened on June 4th, 2020
− The return of group business and increased airlift to the Las Vegas market will be important for the recovery
4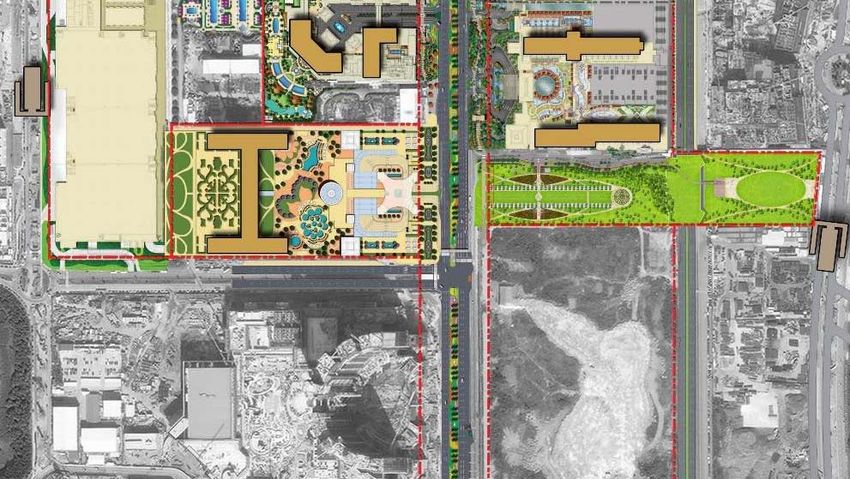
Third Quarter 2020 Financial Results
Quarter Ended September 30, 2020 vs Quarter Ended September 30, 2019

   ($ in US millions, except per share information)   LVS Consolidated Third Quarter Financial Results
                                                          3Q19             3Q20           $ Change

   Net Revenue                                            $3,250            $586           ($2,664)
   Net Income (Loss)                                        669              (731)          (1,400)
   Diluted EPS                                             $0.69           ($0.74)          ($1.43)
   Dividends per Common Share                              $0.77                  -         ($0.77)

   Adjusted Net Income (Loss) Attributable to LVS           573              (515)          (1,088)
   Adjusted Diluted EPS                                    $0.75           ($0.67)          ($1.42)

   Adjusted Property EBITDA                                1,283             (203)          (1,486)
   Adjusted Property EBITDA Margin                         39.5%

   Hold-Normalized :
       Adjusted Property EBITDA                           $1,259            ($184)         ($1,443)
       Adjusted Property EBITDA Margin                     38.9%
       Adjusted Diluted EPS                                $0.72           ($0.65)          ($1.37)

                                                                                                         5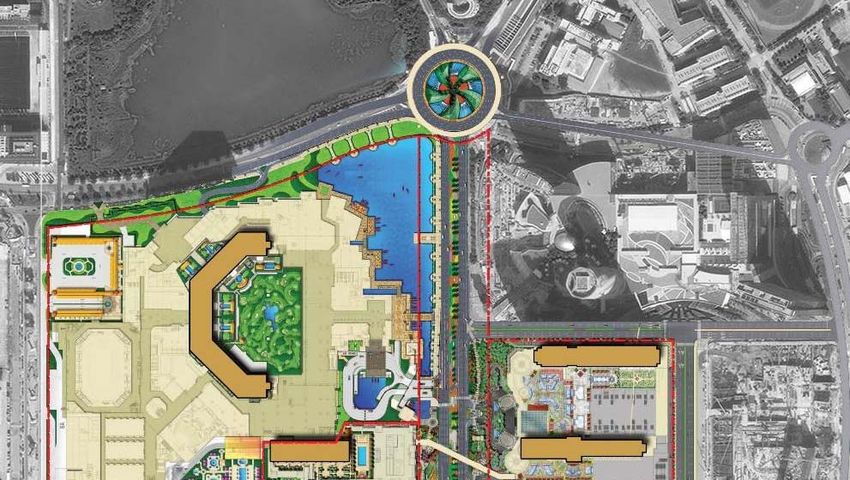
LVS Consolidated Operations EBITDA Performance
Quarter Ended September 30, 2020 vs Quarter Ended September 30, 2019

                                         LVS Consolidated Adjusted Property EBITDA
 ($ in US millions)
                           Adjusted Property EBITDA                Hold-Normalized Adj. Prop. EBITDA

              $1,400
              $1,200         $1,283                                       $1,259
              $1,000
                 $800
                 $600
                 $400
                 $200
                      $0
                                             -$203                                        -$184
                -$200
                -$400
                             3Q19            3Q20                         3Q19            3Q20

                                                                                                       6
LVS Consolidated Operations EBITDA Performance
Quarter Ended September 30, 2020 vs Quarter Ended June 30, 2020

                                         LVS Consolidated Adjusted Property EBITDA
 ($ in US millions)
                           Adjusted Property EBITDA                Hold-Normalized Adj. Prop. EBITDA

                      $0

                                                                                          -$184
                                            -$203
              -$200

              -$400

                                                                          -$514
                             -$547

              -$600
                            2Q20            3Q20                           2Q20            3Q20

EBITDA Losses Decreased to $203 Million in Q3, Compared to $547 Million in Q2

                                                                                                       7
Sequential Improvement in EBITDA Performance
Quarter Ended September 30, 2020 vs Quarter Ended June 30, 2020
   ($ in US millions)                                   Adjusted                Hold-Normalized
                                                 Property EBITDA            Adjusted Property EBITDA
                                                2Q20               3Q20        2Q20         3Q20

   Sands China                                 ($312)              ($233)     ($285)        ($240)
      Increase in Adj. EBITDA                                       $79                      $45
      % Decrease in Adj. EBITDA Loss                           -25.3%                      -15.8%

   Marina Bay Sands                            ($113)               $70       ($112)          $59
      Increase in Adj. EBITDA                                      $183                     $171
      % Decrease in Adj. EBITDA Loss

   Las Vegas                                   ($122)               ($40)     ($117)          ($3)
      Increase in Adj. EBITDA                                       $82                     $114
      % Decrease in Adj. EBITDA Loss                           -67.2%                      -97.4%

   LVS Consolidated                            ($547)              ($203)     ($514)        ($184)
      Increase in Adj. EBITDA                                      $344                     $330
      % Decrease in Adj. EBITDA Loss                           -62.9%                      -64.2%

Our Adjusted Property EBITDA Results Improved in Each of Our Markets Relative to 2Q20

                                                                                                       8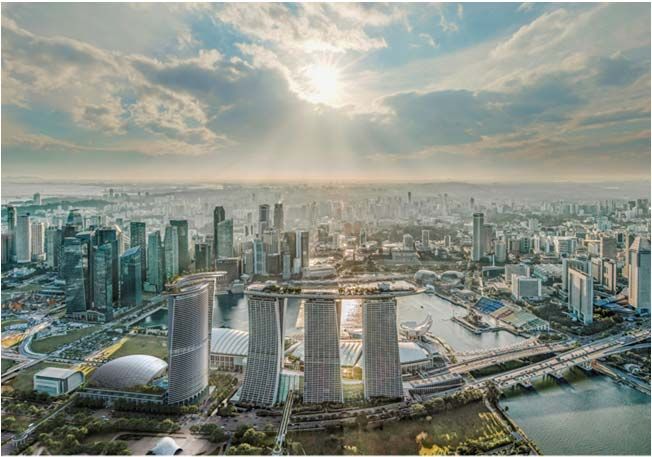
Sands China Ltd.
Adjusted Property EBITDA Loss of $233 Million in 3Q20
Adjusted Property EBITDA
Adjusted property EBITDA loss of $233 million ($ in US millions)
Actual Hold-Normalized
$1,000
Mass (non-Rolling tables and slots):
$800
─ Non-Rolling table win: $55 million $600
$755 $757
─ Slot win: $10 million $400
$200
Mass table hold decreased 3.8 pts to 19.8% from 23.6% $0
compared to 3Q19 -$233 -$240
-$200
Occupancy decreased 88.7 pts to 7.8%, while ADR fell 17.2% to -$400
$154 compared to 3Q19 3Q19 3Q20 3Q19 3Q20
Rolling volume decreased 92.8% to $1.05 billion compared to Non-Rolling Table and Slot Win
3Q19; Rolling win % was 4.06% in 3Q20 compared to 3.01% in the ($ in US millions)
prior-year quarter $2,000
$1,596
$1,500 $160
$1,000
$1,436
$500 $10
$65 $55
$0
3Q19 3Q20
Slot Machines
Non-Rolling Tables
Note: beginning in September 2020, eligible travelers residing in Mainland China were allowed to begin to apply for visas under the Individual
Visit Scheme; the receipt of a visa together with a negative COVID-19 test allow travelers to visit Macao from Mainland China.
9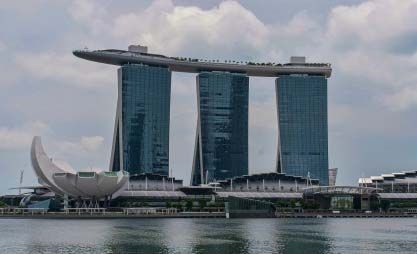
Marina Bay Sands
Adjusted Property EBITDA of $70 Million in 3Q20
Adjusted Property EBITDA
Adjusted property EBITDA of $70 million ($ in US millions)
Actual Hold-Normalized
$450
Mass (non-Rolling tables and slots): $435
$396
─ Non-Rolling table win: $75 million
$300
─ Slot win: $119 million
Mass table hold decreased 0.2 pts to 17.8% from 18.0% $150
compared to 3Q19
$70 $59
Occupancy decreased 42.2 pts to 55.5%, while ADR fell 45.9% $0
3Q19 3Q20 3Q19 3Q20
to $257 compared to 3Q19
Rolling volume decreased 79.7% to $1.48 billion compared to Non-Rolling Table and Slot Win
3Q19; Rolling win % was 4.23% in 3Q20 compared to 3.98% in the ($ in US millions)
prior-year quarter
$500
$408
$400
$153
$300
$194
$200
$255 $119
$100
$75
$0
3Q19 3Q20
Slot Machines
Non-Rolling Tables
10Las Vegas Operations
Adjusted Property EBITDA Loss of $40 Million in 3Q20
Adjusted Property EBITDA
($ in US millions)
Adjusted property EBITDA loss of $40 million
Actual Hold-Normalized
$150
Hotel room revenue fell 71.5% to $41 million compared to 3Q19
− Occupancy decreased 50.9 pts to 43.7 year-over-year $100 $106
$93
− ADR decreased 26.6% to $174 year-over-year $50
− RevPAR decreased 66.1% to $76 year-over-year
$0
-$3
Slot win decreased 19.7% to $49 million compared to 3Q19 -$40
-$50
Table games drop decreased 10.1% to $425 million, while win 3Q19 3Q20 3Q19 3Q20
percentage decreased 8.9 pts to 8.0% compared to 3Q19
Composition of Table Games Drop
($ in US millions)
$600
$500 $473
$425
$400
$252 $144
$300
$200
$281
$100 $221
$0
3Q19 3Q20
Non-Baccarat
Baccarat
11Investment Grade Balance Sheet Strength
As of September 30, 2020: Trailing Twelve Months Ended September 30, 2020:
Cash Balance – $2.40 billion Cash Flow from Operations – ($0.07) billion
Debt1 – $13.89 billion Adjusted Property EBITDA – $1.08 billion
Net Debt1 – $11.49 billion LVS Dividends Paid – $1.19 billion; SCL Dividends Paid –
Net Debt1 to TTM EBITDA – 10.7x $308 million2
($ in US millions) Sands China U.S. LVS Corp. Total
Figures as of September 30, 2020 Ltd. Singapore Operations and Other Consolidated
Cash and Cash Equivalents3 $1,041 $322 $150 $884 $2,397
Debt 6,944 2,980 - 3,965 13,889
Net Debt (Cash) 5,903 2,658 (150) 3,081 11,492
Trailing Twelve Months Adjusted Property EBITDA 333 4 696 46 - 1,075
Gross Debt to TTM Adjusted Property EBITDA 20.9x 4.3x - - 12.9x
Net Debt to TTM Adjusted Property EBITDA 17.7x 3.8x - - 10.7x
Investment Grade Balance Sheet Provides Stability During the Recovery Period
1. Debt balances shown here are net of deferred financing costs and original issue discounts of $143 million and exclude finance leases.
2. Reflects only the public (non-LVS) portion of dividends paid by Sands China. Total dividends paid by Sands China in the TTM period ended September 30, 2020 were $1.02 billion.
3. Includes restricted cash of $17 million.
4. TTM Adjusted Property EBITDA for Sands China presented here reflects Adjusted Property EBITDA from our Macao Operations.
12Debt Maturity Profile
Debt Maturity by Year
($ in US millions)
$3,476
$3,500 $3,321
$3,000
1,021
1,676
$2,500
$2,000 $1,861 $1,887 500 $1,900
$1,500
1,000
$1,000 1,900
1,800 1,750 1,800 $750 $700
$500
800 750 700
1
$15 $61 $61 $0
$0
% of 2020 2021 2022 2023 2024 2025 2026 2027 2028 2029 2030
Total 0% 0% 0% 13% 14% 24% 25% 0% 14% 5% 5%
MBS Credit Facility SCL Bonds LVS Bonds
Long Dated and Low Cost Capital Structure in Place; No Significant Maturities until 2023
1. Amount maturing October 1 through December 31, 2020.
13Capital Expenditures Expectations
Future Planned Investments Composed of Income Producing Projects and Maintenance
($ US in millions)
$3,000
LVS Capex Expectations
$2,400 $2,180
$1,800
$981
$1,350 $1,400
$1,300
$50 $1,125 $1,075
$1,200 $150
$949 $273
$837 $300 $200 $900
$75 $350 $800
$194 $211 $25
$600 $396 $240 $450 $450 $225
$147
$477 $450 $450 $400 $400 $500 $500 $500
$0
2017A 2018A 2019A 2020E 2021E 2022E 2023E 2024E
Development Timeline
Expansion, Renovation and Rebranding of SCC to The Londoner
Grand Suites at Four Seasons Macao
The Londoner Court
Marina Bay Sands Expansion Project2
Marina Bay Sands Expansion2 Expansion, Renovation and Rebranding of SCC to The Londoner Grand Suites at Four Seasons Macao Pre-Opening
1
The Londoner Court The Parisian Macao St. Regis Hotel at SCC Investments in Current Properties and Other Maintenance Post-Opening
Capital Expenditures Include Investments to Expand and Enhance Our Industry-Leading Portfolio of Integrated
Resorts in Macao and Singapore
1. Reflects investments that are designed to generate future income in our current property portfolio.
2. The timing of the project is subject to revision based upon the impact of COVID-19.
14Ongoing Strategic Reinvestment in Industry-Leading
Portfolio of Integrated Resorts in Macao and Singapore
Through Future Total Expected Timeframe
The Londoner Macao: 3Q20 Spend Spend
• Renovation, expansion and rebranding of SCC to The ~$610M ~$740M ~$1.35B • Phased completion throughout 2020 and
Londoner Macao 2021
New Luxurious Hotel Towers in Macao:
• Grand Suites at Four Seasons Macao Expanded suite inventory ~$450M - ~$450M • Project Completed
with approximately 290 new luxury suites, ranging in size from
• All Administrative Licenses Received
2,000 to 4,700 SF; introduction of three luxurious gaming salons
(~1 million SF in new suite product)
• The Londoner Court Approximately 370 new luxury suites ranging ~$295M ~$105M ~$400M • Targeted completion in late 2020
in size from 1,400 to 3,100 SF (~1 million SF in new suite product)
Total Macao Spend: The Londoner Macao, Londoner Court and
Grand Suites at Four Seasons Macao ~$1.4B ~$0.8B ~$2.2B
Marina Bay Sands Expansion1:
• $3.3 billion expansion to bring new luxurious hotel, entertainment, ~$1.0B ~$2.3B ~$3.3B • Targeted opening in 20241
MICE and retail offerings to Marina Bays Sands - a new luxury
hotel tower with ~1,000 new all-suite rooms, a state-of-the-art
arena, additional MICE capacity and new luxury retail
Total Project Spend: ~$2.4B ~$3.1B ~$5.5B
(1) The timing of the MBS expansion is subject to revision based upon the impact of COVID-19.
15The Investment Case for Las Vegas Sands
The global leader in Integrated Resort development and operation
Industry-leading, investment grade balance sheet strength
A unique MICE-based business model delivering industry-leading returns
Unmatched development and operating track record creates competitive advantage as we pursue the most promising
opportunities in new markets
Proven history of delivering innovative growth in Asia
A commitment to maximizing shareholder returns
The industry’s most experienced leadership team: visionary, disciplined and dedicated to driving long-term shareholder value
Maximizing Return to Shareholders by:
1. Pursuing growth in current markets through investments in capacity expansion and reinvestment in industry-leading
property portfolio
2. Leveraging proven MICE-based Integrated Resort business model and balance sheet strength to pursue global growth
opportunities in new markets
3. Maintaining strong balance sheet and liquidity to preserve ability to make investments in future growth
16Disciplined Execution of Our Global Growth Strategy
Focused on the Most Promising Global Development Opportunities
Uniquely positioned to bring our unmatched track record and powerful convention-based business model to the world’s most
promising Integrated Resort development opportunities
Balance sheet strength designed to support future large-scale development projects
Development opportunity objectives:
− Target minimum of 20% return on total invested capital
− 25% - 35% of total project costs to be funded with equity (project financing to fund 65% - 75% of total project costs)
Principal Areas of Future Development Interest:
Macao Singapore South Korea
17Appendices
Cash and Available Liquidity - LVS
Illustrative “Near Zero” Revenue Scenario
                                                       ($ in US millions)                                                        Cash and Available Liquidity at September 30, 2020
                                                                                                                                 SCL                     MBS            Las Vegas Corp./Other                                     Total

                                                          Cash                                                              $1,041                      $322                     $150                     $884                  $2,397
                                                                                            1
                                                          Revolver Availability                                               2,018                       433                                            1,499                    3,950
                                                                                                                                                                 2
                                                       Cash and Available Liquidity                                         $3,059                      $755                     $150                  $2,383                   $6,347

                                                       ($ in US millions)                                                                Illustrative "Near Zero" Revenue Scenario
                                                                                                                                     Monthly Opex, Fixed Charges and Other Costs
                                                                                                                                 SCL                     MBS            Las Vegas Corp./Other                                     Total
                                                          Estimated Run-rate Op. Ex.                                           $110                       $45                      $65                                             $220

                                                          Fixed Charges and Other
                                                              Interest Expense                                                                                                                                                         50
                                                              Maintenance Capex                                                                                                                                                        30
                                                              Corporate Costs & Other                                                                                                                                                  15
                                                          Subtotal                                                                                                                                                                     95

                                                       Monthly Operating Expenses, Fixed Charges and Other Costs (ex Development Capex)                                                                                            $315
                                                                                                                       3
                                                              SCL Monthly Development Capex                                                                                                                                            50
                                                       Total Monthly Operating Expenses, Fixed Charges and Other Costs                                                                                                             $365

 We have Sufficient Resources to Operate in a “Near Zero” Revenue Environment for Approximately 18 Months
 While Continuing to Execute our Existing Development Projects in Both Macao and Singapore
1. Revolver availability is subject to existing covenants and other terms under their respective facility agreements. See details on slide 21. Availability of individual revolving credit facilities is reduced by outstanding letters of credit and bank guarantees. Revolver commitments are as
   follows, SCL: $2,018 million, MBS: $548 million, LVSC: $1,500 million. None of the revolvers were drawn as of September 30, 2020.
2. An additional $2,740 million delayed draw facility is in place to fund the expansion of Marina Bay Sands. As of September 30, 2020, $46 million was outstanding.
3. Represents the approximate average monthly spend on development capex in Macao for the periods 4Q 2020 and 2021. MBS development capex has been excluded from this analysis due to separate funding sources described in Note 2.
Source: Company data, LVS management estimates.

                                                                                                                                                                                                                                                                                                     19
$11.0 Billion of LVS and SCL Bonds Have No Financial Covenants
Investment Grade Long-term Debt – No Financial Covenants for LVS and SCL Bonds
Outstanding Financial Covenants
Las Vegas Sands
Corp. Senior US$4.0 Billion None
Unsecured Notes
Sands China Ltd.
Senior Unsecured US$7.0 Billion None
Notes
Marina Bay Sands
Secured Credit US$3.0 Billion Waived Until January 20221
Facility
Total US$14.0 Billion -
1. On June 18, 2020 Marina Bay Sands received a waiver letter from its lenders, exempting it from the facility’s leverage and interest covenants through 4Q21.
20Revolver Commitments and Financial Covenants
Current Revolver
Leverage Covenant Interest Covenant
Availability1
Las Vegas
Sands Corp. Waived
US$1,499 Million Until January 20222 -
Unsecured Revolver
Sands China Ltd. Waived Waived
Unsecured Revolver US$2,018 Million Until January 20223 Until January 20223
Marina Bay Sands Waived Waived
Secured Revolver US$433 Million Until January 20224 Until January 20224
Total US$3,950 Million - -
1. Reflects availability as of September 30, 2020. Availability of revolving credit facilities is reduced by outstanding letters of credit and bank guarantees. Revolver commitments are as follows, SCL: $2,018 million, MBS: $548 million, LVSC: $1,500 million.
None of the revolvers were drawn as of September 30, 2020.
2. On September 23, 2020 Las Vegas Sands received a waiver letter from its lenders, exempting it from the facility’s leverage covenant through 4Q21. Upon expiry of the waiver letter, the leverage covenant will return to 4.0x. Las Vegas
Sands Corp. unsecured revolver covenant is a net debt covenant capped at a $1,000 million deduction of cash; covenant EBITDA includes royalty-related revenue and applicable dividends from SCL and MBS as well as various
other adjustments allowable under the US credit agreement; covenant debt includes LVSC notes; revolving credit facility is not subject to an interest covenant. During the waiver period, LVS must maintain minimum liquidity of $350 million at its
US entities. Liquidity is defined as cash plus revolver availability. During the waiver period, LVS is only permitted to pay dividends if liquidity would be $1,000 million after taking into account the dividend payment.
3. On September 11, 2020 Sands China received a second waiver letter from its lenders, exempting it from the facility’s leverage and interest covenants through 4Q21 and permitted SCL to raise up to $1,000 million in incremental revolver
commitments. If SCL raises incremental commitments and leverage exceeds 4.0x during the waiver period, then the Company will only be permitted to pay dividends if liquidity is greater than $2,000 million after taking into account the payment of
the dividend. Liquidity is defined as cash plus revolver availability. Upon expiry of the waiver letter, the leverage covenant will return to 4.0x and the interest coverage covenant will return to 2.5x. Sands China Ltd. unsecured revolver covenant is a
gross debt covenant; covenant debt includes SCL notes.
4. On June 18, 2020 Marina Bay Sands received a waiver letter from its lenders, exempting it from the facility’s leverage and interest covenants through 4Q21. Upon expiry of the waiver letter, the leverage covenant will return to 4.5x and the interest
coverage covenant will return to 3.5x. Marina Bay Sands Credit Facility covenant is a gross debt covenant; covenant debt includes debt drawn under the MBS Credit Facilities; 4.5x represents leverage test applicable prior to the one-year
anniversary of MBS receiving a temporary occupancy permit for the MBS expansion. Following the one-year anniversary of receiving a temporary occupancy permit for the MBS expansion, maximum leverage covenant level becomes 4.0x.
21Geographically Diverse Sources of EBITDA
EBITDA Contribution by Geography in Trailing Twelve Months Ended December 31, 2019
($ in US millions)
LVS 2019 Consolidated Adjusted Property EBITDA1
$5,389M
United
States
10%
Singapore
31%
Macao
59%
1. The Macao region includes adjusted property EBITDA from The Venetian Macao, Sands Cotai Central, The Parisian Macao, The Plaza Macao and Four Seasons Hotel Macao, Sands Macao and Ferry Operations and Other. The Singapore region
includes adjusted property EBITDA from Marina Bay Sands and the United States region includes adjusted property EBITDA from the Las Vegas Operating Properties and Sands Bethlehem.
Note: The company completed the sale of Sands Bethlehem on May 31, 2019, and $52 million of Adjusted Property EBITDA generated by Sands Bethlehem is included in the United States segment above for the period from January 1, 2019 to May
30, 2019.
22Retail Mall Portfolio in Asia
Trailing Twelve Months Retail Mall Revenue
($ in US millions)
$800
$696 $712
1
$700 $657
$600 $182 $185
1 TTM 3Q20 Sales
$184 $533 per Sq. Foot²
$500 $52 $53 $441
1
$47 $145
$72 $70 MBS
$400 $63 $1,225
$37 $127
Parisian Macao
$142 $151 $54 $407
$300 $137 $30
$44 SCC
$115 $476
$200 $96 Four Seasons
Luxury: $3,665
$248 $253 $226 Other: $1,354
$100 $182
$144 Venetian
$935
$0
3Q19 4Q19 1Q20 2Q20 3Q20
Operating
$618M $634M $578M $462M $377M
Profit
Operating Profit
Margin 89% 89% 88% 87% 85%
The Venetian Macao Four Seasons Macao Sands Cotai Central3 The Parisian Macao Marina Bay Sands
1. Results include $59 million, $111 million and $76 million of rent concessions provided to tenants in 1Q20, 2Q20 and 3Q20, respectively.
2. Tenant sales per square foot is the sum of reported comparable sales for the trailing 12 months divided by the comparable square footage for the same period. Only tenants that have occupied mall space for a minimum of 12 months are included
in the tenant sales per square foot calculation.
3. At September 30, 2020, approximately 450,000 square feet of gross leasable area was occupied out of a total of up to approximately 600,000 square feet of retail mall space that will be featured at completion of all phases of Sands Cotai Central’s
renovation, rebranding and expansion to The Londoner Macao.
23Retail Portfolio in Asia
($ per Sq. Foot, Unless Otherwise Indicated) 2
3Q20 Sales per Sq. Ft.
GLA1 Occupancy %
(Sq. Ft) at Period End TTM 3Q20 TTM 2Q20 TTM 1Q20 TTM 4Q19 TTM 3Q19
The Shoppes at Marina Bay Sands 620,213 95.0% $1,225 $1,500 $1,917 $2,062 $2,028
Shoppes at Venetian 812,934 84.9% $935 $1,224 $1,460 $1,709 $1,708
Shoppes at Four Seasons
Luxury Retail 125,466 100.0% $3,665 $4,756 $6,033 $7,065 $6,652
Other Stores 116,959 88.1% $1,354 $1,924 $2,481 $2,823 $2,687
Shoppes at Cotai Central 525,497 85.6% $476 $603 $780 $934 $966
Shoppes at Parisian 295,963 82.5% $407 $561 $687 $785 $688
1. Denotes gross leasable area.
2. Tenant sales per square foot reflect sales from tenants only after the tenant has been open for a period of 12 months.
Note: During 2Q20 the malls in Macao remained open while the Shoppes at Marina Bay Sands were closed April 7th to June 18th; upon re-opening in Singapore, mall visitation was limited to loyalty program members; some tenants in both regions
limited their business hours.
24Market Leading Hotel Capacity
SCL is the Clear Leader in Macao Hotel Room and Suite Inventory
Projected Macao Market 4/5 Star Hotel Rooms at December 31, 20201 – Gaming Operators
Cotai ~ 25,000 Rooms by Gaming Operators Total Macao ~ 28,500 Rooms by Gaming Operators
MGM 12,112 Rooms and MGM 12,401 Rooms and
China Suites at SCL China Suites at SCL
Wynn 6% Wynn 7%
Macau Macau
6% 9%
SJM
8% SJM
Sands Sands
10%
China China
Melco
49% 44%
15%
Melco
14%
Galaxy Galaxy
16% 16%
With a Market-Leading ~US$15 Billion of Investment by 2020, SCL Hotel Inventory is Forecast to Represent
~44% of Gaming Operator Hotel Rooms and ~49% of Hotel Rooms on Cotai
1. See slide 35 titled ‘Market-Leading Hotel Capacity at SCL’ for further detail.
Source: Public company filings, Macao DSEC, Macao Tourism Board.
25Sands China
Continued Expansion of Market-Leading Cotai Strip Property Portfolio
LVS’ Cotai Strip Properties Leadership in Macao
Investment
Grand Suites at Four
Seasons Macao St. Regis Hotel >$14 billion today, ~$15 billion by year end 2020
~290 Suites (Opened 400 Suites
Approximately 30 million square feet of interconnected facilities on Cotai
October 1, 2020)
Hotel Inventory
The Venetian Macao The Londoner Court
2,905 Suites ~370 Suites ~12,000 rooms and luxury suites
~49% of hotel inventory on Cotai
C Retail
O ~1.9 million square feet of gross leasable retail
T Conrad
Revenue of $314 million as of TTM 3Q20
A
659 Rooms
& Suites
Entertainment
I The Macao leader in entertainment – more seats, shows and venues than any
Four Seasons Londoner other operator
Macao Hotel
360 Suites 600 Suites The Cotai Arena is the largest, most important entertainment venue in Macao,
S featuring 15,000 seats
Paiza
Mansions
T Sheraton
3,968 Rooms MICE
19 Suites & Suites
R The Macao leader in convention and group meetings
I ~80% of all MICE square footage in Macao is owned and operated by Sands
P China
Reinvestment
~290 new suites in the Grand Suites at Four Seasons Macao opened October
The Parisian Macao Tropical Gardens 1, 2020 (~1 million SF in new suite product)
2,541 Rooms &
Suites ~370 new suites in The Londoner Court targeted to open in late 2020 (~1
million SF in new suite product)
The re-themed Londoner Macao will provide a third European-themed iconic
destination resort on Cotai with additional MICE, retail, entertainment and
luxurious suite offerings upon completion of its planned opening in phases
New Luxury Suites Suite Conversion1 throughout 2020 and 2021
1. Upon completion, The Londoner hotel will feature approximately 600 suites.
26Our Integrated Resorts Are Designed to Maximize Economic Growth
and the Leisure & Business Tourism Appeal of our Host Markets
Contribution to Singapore’s Leisure & Business Tourism Appeal
MBS Existing Contributed to economic growth and to Singapore’s appeal as an exciting
global city
Delivered iconic architecture to Singapore’s CBD area
MBS is central to the MICE business in Singapore with record 2019 MICE
revenues. MBS hosted more than 3,000 events in 2018
Created thousands of jobs for Singaporeans (MBS employed >10,000
FTE’s in 2019)
Procurement and sourcing focused on Singapore-based SME’s
MBS Expansion Further enhance MBS’ status as an iconic architectural landmark
Provide suite product that is unparalleled in South East Asia
Introduce a ‘state-of-the-art’ theater designed for live musical
performances that can attract the highest-caliber global entertainment
events and artists to Singapore
Extend the success of Singapore as a MICE destination
Ensure MBS is positioned to grow its economic, employment and
visitation contributions to Singapore in the years ahead
Note: Images above denote preliminary artistic impressions which are subject to change.
27Marina Bay Sands Expansion
Marina Bay Sands $3.3 Billion Expansion to Bring New
Luxurious Hotel, Entertainment, MICE and Retail Offerings
Las Vegas Sands has entered into a development agreement with the Singapore government to expand Marina Bay Sands
Iconic New Luxury Hotel Tower:
− Approximately 1,000 all-suite rooms designed to set a new standard of luxury in the region
− Sky roof with a swimming pool and other tourism attractions
State-of-the-art arena designed specifically for live musical performances; Seating for at least 15,000
Additional MICE capacity (meeting and function rooms, exhibition halls)
Luxury retail
Note: Images above denote preliminary artistic impressions which are subject to change.
29Marina Bay Sands Expansion
A Development Agreement with the Singapore Tourism Board Will Allow an Expansion of Marina Bay Sands
30Marina Bay Sands Expansion
Artistic Impression
Design and Development Work are Progressing, with a Focus on Increasing the Leisure and Business
Tourism Appeal of Singapore and Marina Bay Sands
Note: Image above denotes preliminary artistic impression which is subject to change.
31Macao Market Background and Infrastructure Slides
Market-Leading ~$15 Billion of Investment
Investing in Macao’s Future as a Leisure & Business Tourism Destination
Industry-Leading Integrated Resort Portfolio
− Portfolio of ~12,400 suites and hotel rooms
− Addition of ~2 Million sq. feet of new luxurious hotel suite inventory in 2020
The Entertainment and Tourism Offerings of The Londoner Macao Will Be Introduced Throughout 2020 and 2021
Conference, Exhibition and Carpeted Meeting Space: ~2 Million sq. feet
World-Class Entertainment and Events
World Class Shopping: ~ 1.9 Million sq. feet
Our Diversified Convention-Based Integrated Resort Offerings Coupled with Industry Leading Branding and Service
Levels Appeal to the Broadest Set of Customers and Provide a Competitive Advantage in the Macao Market
33Macao Visitation Opportunity
Business & Leisure Tourism Expenditure Drivers
Future Growth Drivers As a result, Macao’s Mass visitors will
More efficient and affordable Come From Farther Away
transportation infrastructure
Stay Longer
Greater number of hotel rooms and
non-gaming offerings in Macao
Spend More On
Additional tourism attractions in − Lodging
− Retail
Macao and Hengqin Island
− Dining
− Entertainment
Rapidly expanding middle-class with − Gaming
growing disposable income and a
desire for tourism and travel
experiences
34Market Leading Hotel Capacity at SCL
Projected Macao Market 4/5 Star Hotel Rooms at December 31, 2020
Cotai Total Market
New Capacity % of Gaming % of Gaming % of Total
Gaming Operator Rooms Operators Rooms Operators Market
16,000 Sands China 12,112 49% 12,401 44% 33%
Galaxy Entertainment 3,920 16% 4,420 16% 12%
14,000 M elco 3,772 15% 3,987 14% 11%
12,401 SJM Holdings 2
2,000 8% 2,839 10% 7%
Wynn M acau Ltd. 1,706 6% 2,714 9% 7%
12,000 The Parisian
M GM China 1,400 6% 1,982 7% 5%
Macao
2,541 Sands Macao, 289 Subtotal Gaming Operators 24,910 100% 28,343 100% 75%
10,000
Grand Suites at Four Other 4/5 Star1 - - 9,242 0% 25%
Seasons Macao, ~290 Total 24,910 100% 37,585 100% 100%
8,000 The Four Seasons Macao, 379
Venetian Macao The Londoner
2,905 Court, ~370 Starworld, 500
City of Dreams Morpheus Tower, 772 MGM Cotai, 1,400 (Phased Opening
6,000 St. Regis Macao, 400 Broadway Macau, 320 (Phased Opening Began June 15, 2018) Began February 13, 2018)
4,420 Altira Macau, 215 Sofitel Macau, 408
3,987
4,000
2,839 2,714
Sands Cotai
Central 3 Macau Studio City
1,982
2,000 5,227 Galaxy Macau4 SJM Cotai Wynn Palace
1,600
3,600 2,000 1,706 MGM Cotai
City of Dreams 1,400
1,400 Wynn Macau, 1,008 MGM Grand, 582
0 Grand Lisboa, 431
2
Sands China Galaxy Entertainment Melco SJM Holdings Wynn Macau Ltd. MGM China
With a Market-Leading ~US$15 Billion of Investment by 2020, SCL Hotel Inventory is Forecast to Represent
~49% of Hotel Rooms on Cotai
1. In addition to the hotel rooms that are owned by gaming operators, there are approximately 9,242 additional four- and five-star hotel rooms owned by non-gaming operators in Macao at December 31, 2019.
2. Reflects only SJM Holdings owned hotels.
3. Upon completion, The Londoner hotel, will feature approximately 600 suites.
4. Reflects the opening of Galaxy Phase I and Phase II.
Source: Public company filings, Macao DSEC, Macao Tourism Board.
35Supplemental Data
Historical Hold-Normalized Adjusted Property EBITDA1
($ in US millions)
                                                               3Q18                  4Q18                 1Q19                 2Q19                  3Q19                  4Q19                 1Q20                  2Q20                 3Q20
                         2
Macao Operations
     Reported                                                  $754                  $786                  $858                 $765                  $755                 $811                   $67                 ($312)               ($233)
     Hold-Normalized                                           $754                  $820                  $845                 $765                  $757                 $788                   $84                 ($285)               ($240)

Marina Bay Sands
     Reported                                                  $419                  $362                  $423                 $346                  $435                 $457                  $282                 ($113)                  $70
     Hold-Normalized                                           $419                  $390                  $433                 $392                  $396                 $417                  $270                 ($112)                  $59

Las Vegas Operations
     Reported                                                    $76                 $100                  $138                 $136                   $93                 $120                   $88                 ($122)                 ($40)
     Hold-Normalized                                             $97                 $125                  $131                 $146                  $106                 $120                   $88                 ($117)                  ($3)

                         3
Sands Bethlehem
     Reported                                                    $33                   $24                  $33                   $19                      -                     -                    -                     -                     -
     Hold-Normalized                                             $33                   $24                  $33                   $19                      -                     -                    -                     -                     -

LVS Consolidated
     Reported                                                $1,282               $1,272                $1,452                $1,266               $1,283                $1,388                  $437                 ($547)               ($203)
     Hold-Normalized                                         $1,303               $1,359                $1,442                $1,322               $1,259                $1,325                  $442                 ($514)               ($184)
1. This schedule presents hold-normalized adjusted property EBITDA based on the following methodology:
    - for Macao operations and Marina Bay Sands: if the quarter’s rolling win percentage is outside of the 3.15%-3.45% range, then a hold adjustment is calculated by applying a rolling win percentage of 3.30% to the rolling volume for the quarter.
    - for Las Vegas Operations: if the quarter’s baccarat win percentage is outside of the 18.0%-26.0% range, then a hold adjustment is calculated by applying a baccarat win percentage of 22.0%, and if the quarter’s non-baccarat win percentage is
      outside of the 16.0%-24.0% range, then a hold adjustment is calculated by applying a non-baccarat win percentage of 20.0%.
    - for Sands Bethlehem: no hold adjustment was made.
    - for all properties: gaming taxes, commissions paid, bad debt expense, discounts and other incentives are applied to determine the hold-normalized adjusted property EBITDA impact.
2. Adjusted property EBITDA presented here reflects adjusted property EBITDA from The Venetian Macao, Sands Cotai Central, The Parisian Macao, The Plaza Macao and Four Seasons Hotel Macao, Sands Macao and Ferry Operations and Other.
3. The company completed the sale of Sands Bethlehem on May 31, 2019. Results of operations include Sands Bethlehem through May 30, 2019.

                                                                                                                                                                                                                                                          37
Macao Market: Mass Gaming Segment
Macao Market Mass Gaming Revenue (Tables & Slots) & Mass Win-per-Visit1
($ US in millions)
$6,000 $1,400
$5,440 $5,523 $5,608
$5,500 $5,356
$5,251
$4,955
$4,864 $1,200
$5,000 $4,706 $4,841
$4,589
$4,449 $4,419
$4,500
$4,169
$3,989 $4,146 $4,017 $1,000
$4,000 $3,919
$3,816
$3,682 $3,408 $3,609 $3,508
$3,497 $3,589
$3,500 $800
$677
$3,000
$597 $609
$580 $586
$540 $526 $557 $600
$2,500 $536 $527 $522
$504
$536 $525 $540 $2,180
$586 $490 $497 $484 $480 $471 $494
$464 $457
$2,000 $432
$400
$1,500
$1,000
$200
$331
$500
$212
$0 $0
1Q14 2Q14 3Q14 4Q14 1Q15 2Q15 3Q15 4Q15 1Q16 2Q16 3Q16 4Q16 1Q17 2Q17 3Q17 4Q17 1Q18 2Q18 3Q18 4Q18 1Q19 2Q19 3Q19 4Q19 1Q20 2Q20 3Q20
Mass Win (Tables & Slots) Mass Win per Visit
We Estimate Macao Market-Wide Mass Win Decreased Approximately 94% in 3Q20 Compared to 3Q19
1. Market-wide mass GGR for all periods through 2Q20 is defined as mass win (tables and slots) as reported by the casino operators in their public filings (does not include revenue from Galaxy’s City Clubs business). All figures reported in Hong Kong
dollars have been converted to USD using a 7.75 exchange rate. Market-wide mass GGR for 3Q20 is estimated by LVS management based on DICJ reported data and LVS management’s estimated differences between DICJ reporting and win
reported by operators in public filings.
Source: Public company filings, Macao DSEC, Macao DICJ, Macao Public Security Police.
.
38Sands China Mass Market Table Update
SCL Base Mass Table Win by Quarter SCL Premium Mass Table Win by Quarter
Sands China Departmental Profit Margin1: 35% - 45% Sands China Departmental Profit Margin1: 25% - 40%
($ in US millions) ($ in US millions)
Avg. Win per Table per Day: $280 $1,000 Avg. Win per Table per Day: $655
$1,000
$900 $900
$800 $800
$789
$700 $762 $700
$674 $675
$600 $600
$500 $500
$400 $400
$300 $300
$278 $270
$200 $200
$100 $100
$23 $32
$4 $6
$0 $0
3Q19 4Q19 1Q20 2Q20 3Q20 3Q19 4Q19 1Q20 2Q20 3Q20
Avg. Avg.
Tables
956 953 687 912 892 Tables
450 466 376 521 531
1. Denotes expected range under normal operating conditions.
Note: Sands China’s base mass and premium mass table revenues as presented above are based on the geographic position of non-rolling (mass) tables on the gaming floor. Some high-end mass play occurs in the base mass geographic area.
39Sands China Mass Market Table and Slots Update
SCL Mass Table1 Win by Quarter SCL Slots2 Win by Quarter
Avg. Win per Table per Day: $420 Avg. Win per Unit per Day: $45
($ in US millions) ($ in US millions)
$1,800 $200
$1,600 $180
$1,400 $1,464 $160
$1,436 $160 $161
$1,200 $140
$120
$1,000
$100
$800
$80
$600
$60
$548 $61
$400
$40
$200 $20
$55 $5 $10
$10
$0 $0
3Q19 4Q19 1Q20 2Q20 3Q20 3Q19 4Q19 1Q20 2Q20 3Q20
Avg. Avg.
1,406 1,419 1,063 1,433 1,423 6,039 5,932 4,196 2,372 2,409
Tables Units
1. Excludes rolling play.
2. Includes slots and electronic table games.
40Macao Market: Mass Gaming Revenue
Macao Market Mass Gaming Revenue
($ in US millions) 1
Mass Win (Tables and Slots)
Q1 Q2 Q3 Q4 Total
2016 $3,609 $3,508 $3,816 $3,989 $14,922
2017 $4,146 $4,017 $4,169 $4,706 $17,038
Growth ('17 v '16) 14.9% 14.5% 9.3% 18.0% 14.2%
2018 $4,955 $4,841 $4,864 $5,251 $19,911
Growth ('18 v '17) 19.5% 20.5% 16.7% 11.6% 16.9%
2019 $5,440 $5,356 $5,523 $5,608 $21,927
Growth ('19 v '18) 9.8% 10.6% 13.5% 6.8% 10.1%
2020 $2,180 $212 $331 2
2
Growth ('20 v '19) -59.9% -96.0% -94.0%
1. Market-wide mass GGR for all periods through 2Q20 is defined as mass win (tables and slots) as reported by the casino operators in their public filings (does not include revenue from Galaxy’s City Clubs business). All figures reported in Hong Kong
dollars have been converted to USD using a 7.75 exchange rate.
2. Market-wide mass GGR for 3Q20 is estimated by LVS management based on DICJ reported data and LVS management’s estimated differences between DICJ reporting and win reported by operators in public filings.
Source: Public company filings, Macao DICJ.
41Macao Market: VIP Gaming
Macao Market VIP Gaming Revenue
($ in US millions)
VIP Win1
Q1 Q2 Q3 Q4 Total
2016 $3,294 $2,856 $3,017 $3,516 $12,683
2017 $3,661 $3,734 $4,099 $4,292 $15,786
Growth ('17 v '16) 11.1% 30.7% 35.9% 22.1% 24.5%
2018 $4,429 $4,208 $4,288 $4,412 $17,337
Growth ('18 v '17) 21.0% 12.7% 4.6% 2.8% 9.8%
2019 $3,892 $3,640 $3,173 $3,301 $14,006
Growth ('19 v '18) -12.1% -13.5% -26.0% -25.2% -19.2%
2020 $1,494 $172 $269 2
Growth ('20 v '19) -61.6% -95.3% -91.5% 2
1. Market-wide VIP GGR for all periods through 2Q20 as reported by the casino operators in their public filings (does not include revenue from Galaxy’s City Clubs business). All figures reported in Hong Kong dollars have been converted to USD using
a 7.75 exchange rate.
2. Market-wide VIP GGR for 3Q20 is estimated by LVS management based on DICJ reported data and LVS management’s estimated differences between DICJ reporting and win reported by operators in public filings.
Source: Public company filings, Macao DICJ.
42Sands China VIP Table Update
SCL Rolling Volume by Quarter SCL Rolling Win by Quarter
($ in US billions) ($ in US millions, except per table amounts)
$20 $600 Avg. Win per Table per Avg. Win per Table per
Day: $19,011 Day: $2,226
$16
$14.58 $400 $439
$12
$8
$200
$4
$43
$1.05
$0 $0
3Q19 3Q20 3Q19 3Q20
Avg. Rolling
251 210 Win %
3.01% 4.06%
Tables
Sands China Rolling Volume Declined ~93% in 3Q20 Compared to 3Q19
43Sands ECO360
Sands ECO360
 Industry Leading Global Sustainability Program

The Sands ECO360 Global Sustainability program reflects our vision
to lead our industry in sustainable development and integrated resort operations

                                                                                   45
Global Goals:
Our 2016-2020 Targets
• We have aligned our global sustainability targets for 2016-2020 with three key, measurable, UN Sustainable Development Goals
(SDGs) and our emissions reduction goals are approved by science-based targets:
Emissions Water Waste
Double the global rate of improvement Substantially increase water-use Substantially reduce waste
UN Sustainable Development in energy efficiency efficiency across all sectors generation through prevention,
Increase substantially the share of reduction, recycling, and reuse
Goals (SDGs) renewable energy in the global energy Halve per capita global food waste
mix
Sands ECO360 Energy Water Waste Food
Alignment with SDGs
Transportation Procurement
6% reduction in emissions from 3% reduction in consumption on a 5% increase in waste diversion
resort operations, in addition to per square foot basis (Achieved) rate (In Progress)
LVS Goals (2016-2020) offsetting newly opened resorts
(Achieved)
6% reduction in ferry emissions
(Achieved)
Implemented 53 eco-efficiency Implemented 17 water-efficiency Started food donation program at
projects throughout our resorts projects throughout our resorts Sands China Ltd.
Select 2019 LVS Started sourcing renewable energy Implemented water engagement Engaged team members and
Accomplishments certificates (REC) for Marina Bay program with kitchens and food & community members on single-use
Sands and The Venetian Resort (VR) beverage outlets at all properties plastic reduction and challenges
Achieved 98% of LED lighting at Increased water input from well and Increased sourcing of sustainable
Sands China Ltd. properties nano-filtration system at VR seafood at all properties
462019 Sands ECO360
Key Accomplishments:
Employee engagement: During 2019, our Team Members continued to embed sustainability into our culture,
1 contributing to more than 240,000 Sands ECO360 Actions to protect the environment, which allowed us to reach
our 1 million Sands ECO360 action by 2020 goal one year in advance. Our global ECOengage campaign on
single-use plastic demonstrated to be an effective way to discuss and act on pressing, current environmental
challenges.
LEED Certifications: The Sands Expo and Convention Center at Marina Bay Sands obtained the LEED
2 Platinum certification for “Existing Buildings: Maintenance & Operations”. It is believed to be the first MICE
venue in Asia Pacific to achieve this certification.
The Parisian Macao is the first Integrated Resort in Macao to achieve the LEED Silver for Building Design and
Construction certification.
CDP and DJSI: We are the only company from the Casino & Gaming industry named on the DJSI North
3 America, and are still part of the CDP Climate A List and CDP Water A List.
Single-use Plastic: In 2019, we formalized our strategy to address single-use plastic and implemented multiple
4 initiatives to eliminate, reuse, replace and recycle single-use plastic in our operations. Items like plastic straws,
food containers, retail bags, laundry packaging and water bottles have been, or are in process of being,
addressed.
Renewable Electricity: The Venetian Resort Las Vegas partnered with NV Energy to procure sufficient
5 renewable energy certificates to cover 100% of its electricity use.
47Sustainability Awards and Certifications
Recognition on a Local and Global Level
Las Vegas Sands United States Macao Singapore
Dow Jones Sustainability Indices Better Buildings Challenge LEED Silver for Building Design and LEED Platinum for Building Operations
(2015, 2016, 2018, 2019) The Venetian Resort Las Vegas Construction and Maintenance
FTSE4Good The Parisian Macao Sands Expo and Convention Center at
APEX/ASTM Level Two
(2019) Macao Green Hotel Awards Marina Bay Sands
Sands Expo and Congress Center at The
Platinum – The Venetian Macao LEED Gold for Building Operations and
CDP Climate A List Venetian Resort Las Vegas
Gold – Sands Cotai Central, Parisian Maintenance
(2015, 2016, 2018, 2019) LEED Silver for New Construction Macao, Four Seasons Hotel Macao
ArtScience Museum at Marina Bay
CDP Water A List The Palazzo Silver – Sands Macao
Sands
(2018, 2019) LEED Gold for Building Operations and World’s Leading Green Hotel – World
Singapore BCA Green Mark Platinum
Maintenance Travel Awards
Marina Bay Sands
Sands Expo and Congress Center at The Conrad Macao
Venetian Resort Las Vegas APEX/ASTM Level One
ISO 20121
Marina Bay Sands
The Venetian Macao
ISO 20121
IMEX / GMIC Green Supplier Award
Marina Bay Sands
The Venetian Macao
IMEX / GMIC Green Supplier Award
Marina Bay Sands
VERIFIED
TM
Recognized by independent third parties as a global leader in sustainability
48Reconciliation of Non-GAAP Measures and Other Financial Information
Reconciliation of Net Income (Loss) to
 Consolidated Adjusted Property EBITDA

($ in US millions)

                                                                        1Q19              2Q19               3Q19               4Q19          2019    1Q20    2Q20     3Q20     TTM 3Q20
Net income (loss)                                                      $744             $1,108               $669              $783         $3,304    ($51)   ($985)   ($731)      ($984)
 Add (deduct):
  Income tax expense (benefit)                                           85                236                82                 65            468      25      (54)     (17)         19
  Loss on modification or early retirement of debt                        -                  -                24                  -             24       -        -        -           0
  Gain on sale of Sands Bethlehem (1)                                     -               (556)                -                  -           (556)      -        -        -           -
  Other (income) expense                                                 21                (20)                7                (31)           (23)    (37)       3        4         (61)
  Interest expense, net of amounts capitalized                          141                143               137                134            555     131      118      137         520
  Interest income                                                       (20)               (17)              (20)               (17)           (74)    (13)      (4)      (3)        (37)
  Loss on disposal or impairment of assets                                7                  -                11                 72             90       5        5       58         140
  Amortization of leasehold interests in land                             9                 14                14                 14             51      14       13       14          55
  Depreciation and amortization                                         301                289               284                291          1,165     290      285      292       1,158
  Development expense                                                     5                  4                 4                 11             24       6        9        3          29
  Pre-opening expense                                                     4                 10                 9                 11             34       5        4        5          25
  Stock-based compensation                                                3                  4                 3                  4             14       3        6        2          15
  Corporate expense                                                     152                 51                59                 51            313      59       53       33         196
Consolidated Adjusted Property EBITDA                                $1,452             $1,266            $1,283             $1,388         $5,389    $437    ($547)   ($203)     $1,075

1. The company completed the sale of Sands Bethlehem on May 31, 2019. Results of operations include Sands Bethlehem through May 30, 2019.

                                                                                                                                                                                            50
Non-GAAP Measures: Adjusted Net Income/Loss; Hold-Normalized Adjusted Net Income/Loss; Adjusted
Earnings/Loss Per Diluted Share; and Hold-Normalized Adjusted Earnings/Loss Per Diluted Share
($ in US millions, except per share data) Three Months Ended Nine Months Ended
September 30, September 30,
2020 2019 2020 2019
Net income (loss) attributable to LVS ($565) $533 ($1,386) $2,069
Nonrecurring legal settlement - - - 96
Pre-opening expense 5 9 14 23
Development expense 3 4 18 13
Loss on disposal or impairment of assets 58 11 68 18
Other (income) expense 4 7 (30) 8
Gain on sale of Sands Bethlehem(1) - - - (556)
Loss on modification or early retirement of debt - 24 - 24
Income tax impact on net income adjustments(2) (2) (6) (6) 151
Noncontrolling interest impact on net income adjustments (18) (9) (15) (10)
Adjusted net income (loss) attributable to LVS ($515) $573 ($1,337) $1,836
Hold-normalized casino revenue 21 (15)
Hold-normalized casino expense (2) (9)
Income tax impact on hold adjustments(2) (6) 4
Noncontrolling interest impact on hold adjustments 2 (1)
Hold-normalized adjusted net income (loss) attributable to LVS ($500) $552
Three Months Ended Nine Months Ended
September 30, September 30,
2020 2019 2020 2019
Per diluted share of common stock:
Net income (loss) attributable to LVS ($0.74) $0.69 ($1.81) $2.68
Nonrecurring legal settlement - - - 0.12
Pre-opening expense 0.01 0.01 0.02 0.03
Development expense - 0.01 0.02 0.02
Loss on disposal or impairment of assets 0.07 0.02 0.09 0.02
Other (income) expense 0.01 0.01 (0.04) 0.01
Gain on sale of Sands Bethlehem(1) - - - (0.72)
Loss on modification or early retirement of debt - 0.03 - 0.03
Income tax impact on net income adjustments(2) - (0.01) (0.01) 0.20
Noncontrolling interest impact on net income adjustments (0.02) (0.01) (0.02) (0.01)
Adjusted earnings (loss) per diluted share ($0.67) $0.75 ($1.75) $2.38
Hold-normalized casino revenue 0.03 (0.02)
Hold-normalized casino expense - (0.02)
Income tax impact on hold adjustments(2) (0.01) 0.01
Noncontrolling interest impact on hold adjustments - -
Hold-normalized adjusted earnings (loss) per diluted share ($0.65) $0.72
Weighted average diluted shares outstanding 764 769 764 772
1. The company completed the sale of Sands Bethlehem on May 31, 2019.
2. The income tax impact for each adjustment is derived by applying the effective tax rate, including current and deferred income tax expense, based upon the jurisdiction and the nature of the adjustment.
51Non-GAAP Trailing Twelve Month Supplemental Schedule
($ in US millions)
3Q19 4Q19 1Q20 2Q20 3Q20 TTM 3Q20
Cash Flows From Operations $900 $1,242 ($370) ($652) ($294) ($74)
Adjust for:
Provision for doubtful accounts (4) (15) (18) (17) (25) (75)
Foreign exchange gains (losses) (11) 30 39 (5) (5) 59
Other non-cash items (54) (18) (11) 17 15 3
Changes in working capital 147 (79) 618 (25) (58) 456
Add: Stock-based compensation expense 3 4 3 6 2 15
Add: Corporate expense 59 51 59 53 33 196
Add: Pre-opening and development expense 13 22 11 13 8 54
Add: Interest expense, net of amounts capitalized 137 134 131 118 137 520
Add: Interest and other (income) expense 11 (48) (50) (1) 1 (98)
Add: Income tax expense 82 65 25 (54) (17) 19
LVS Consolidated Adjusted Property EBITDA $1,283 $1,388 $437 ($547) ($203) $1,075
Adjusted Property EBITDA
Macao:
T he Venetian Macao $342 $368 $49 ($97) ($78)
Sands Cotai Central 169 180 - (79) (71)
T he Parisian Macao 120 122 (3) (81) (40)
T he Plaza Macao and Four Seasons Hotel Macao 75 102 28 (18) (15)
Sands Macao 52 40 (1) (31) (26)
Ferries and Other (3) (1) (6) (6) (3)
Macao Operations 755 811 67 (312) (233) $333
Marina Bay Sands 435 457 282 (113) 70 696
Las Vegas Operating Properties 93 120 88 (122) (40) 46
LVS Consolidated Adjusted Property EBITDA $1,283 $1,388 $437 ($547) ($203) $1,075
Note: The company completed the sale of Sands Bethlehem on May 31, 2019.
52Historical Hold-Normalized Adj. Property EBITDA1
($ in US millions)
3Q18 4Q18 1Q19 2Q19 3Q19 4Q19 1Q20 2Q20 3Q20
2
Macao Operations
Reported $754 $786 $858 $765 $755 $811 $67 ($312) ($233)
Hold-Normalized Adjustment - 34 (13) - 2 (23) 17 27 (7)
Hold-Normalized $754 $820 $845 $765 $757 $788 $84 ($285) ($240)
Marina Bay Sands
Reported $419 $362 $423 $346 $435 $457 $282 ($113) $70
Hold-Normalized Adjustment - 28 10 46 (39) (40) (12) 1 (11)
Hold-Normalized $419 $390 $433 $392 $396 $417 $270 ($112) $59
Las Vegas Operations
Reported $76 $100 $138 $136 $93 $120 $88 ($122) ($40)
Hold-Normalized Adjustment 21 25 (7) 10 13 - - 5 37
Hold-Normalized $97 $125 $131 $146 $106 $120 $88 ($117) ($3)
3
Sands Bethlehem
Reported $33 $24 $33 $19 - - - - -
Hold-Normalized $33 $24 $33 $19 - - - - -
LVS Consolidated
Reported $1,282 $1,272 $1,452 $1,266 $1,283 $1,388 $437 ($547) ($203)
Hold-Normalized Adjustment 21 87 (10) 56 (24) (63) 5 33 19
Hold-Normalized $1,303 $1,359 $1,442 $1,322 $1,259 $1,325 $442 ($514) ($184)
1. This schedule presents hold-normalized adjusted property EBITDA based on the following methodology:
- for Macao operations and Marina Bay Sands: if the quarter’s rolling win percentage is outside of the 3.15%-3.45% range, then a hold adjustment is calculated by applying a rolling win percentage of 3.30% to the rolling volume for the quarter.
- for Las Vegas Operations: if the quarter’s baccarat win percentage is outside of the 18.0%-26.0% range, then a hold adjustment is calculated by applying a baccarat win percentage of 22.0%, and if the quarter’s non-baccarat win
percentage is outside of the 16.0%-24.0% range, then a hold adjustment is calculated by applying a non-baccarat win percentage of 20.0%.
- for Sands Bethlehem: no hold adjustment was made.
- for all properties: gaming taxes, commissions paid, bad debt expense, discounts and other incentives are applied to determine the hold-normalized adjusted property EBITDA impact.
2. Adjusted property EBITDA presented here reflects adjusted property EBITDA from The Venetian Macao, Sands Cotai Central, The Parisian Macao, The Plaza Macao and Four Seasons Hotel Macao, Sands Macao and Ferry Operations and Other.
3. The company completed the sale of Sands Bethlehem on May 31, 2019. Results of operations include Sands Bethlehem through May 30, 2019.
53Supplemental Information
3Q20 and 3Q19
($ in US millions) Three Months Ended September 30, 2020
Amortization Loss on Pre-Opening
Depreciation of Leasehold Disposal or and Adjusted
Operating and Interests Impairment Development Royalty Stock-Based Corporate Property
Income (Loss) Amortization in Land of Assets Expense Fees Compensation Expense EBITDA
Macao:
The Venetian Macao ($128) $45 $2 $1 $1 - $1 - ($78)
Sands Cotai Central (182) 55 1 53 1 - 1 - (71)
The Parisian Macao (82) 41 1 - - - - - (40)
The Plaza Macao and Four Seasons Hotel Macao (35) 19 1 - - - - - (15)
Sands Macao (33) 6 - 1 - - - - (26)
Ferry Operations and Other (7) 2 - - - 2 - - (3)
Macao Operations (467) 168 5 55 2 2 2 - (233)
Marina Bay Sands (25) 73 9 - 3 10 - - 70
United States:
Las Vegas Operating Properties (75) 44 - 3 - (12) - - (40)
United States Property Operations (75) 44 - 3 - (12) - - (40)
Other Development (3) - - - 3 - - - -
Corporate (40) 7 - - - - - 33 -
($610) $292 $14 $58 $8 - $2 $33 ($203)
Three Months Ended September 30, 2019
Amortization Loss on Pre-Opening
Depreciation of Leasehold Disposal or and Adjusted
Operating and Interests Impairment Development Royalty Stock-Based Corporate Property
Income (Loss) Amortization in Land of Assets Expense Fees Compensation Expense EBITDA
Macao:
The Venetian Macao $299 $38 $1 $2 - - $2 - $342
Sands Cotai Central 92 67 1 1 7 - 1 - 169
The Parisian Macao 80 39 1 - - - - - 120
The Plaza Macao and Four Seasons Hotel Macao 58 10 1 5 1 - - - 75
Sands Macao 44 6 1 1 - - - - 52
Ferry Operations and Other (34) 4 - - - 27 - - (3)
Macao Operations 539 164 5 9 8 27 3 - 755
Marina Bay Sands 325 75 9 1 - 25 - - 435
United States:
Las Vegas Operating Properties 107 37 - 1 - (52) - - 93
United States Property Operations 107 37 - 1 - (52) - - 93
Other Development (5) - - - 5 - - - -
Corporate (67) 8 - - - - - 59 -
$899 $284 $14 $11 $13 - $3 $59 $1,283
54Supplemental Information
YTD 3Q20 and YTD 3Q19
($ in US millions) Nine Months Ended September 30, 2020
Amortization Loss on Pre-Opening
Depreciation of Leasehold Disposal or and Adjusted
Operating and Interests Impairment Development Royalty Stock-Based Corporate Property
Income (Loss) Amortization in Land of Assets Expense Fees Compensation Expense EBITDA
Macao:
The Venetian Macao ($270) $130 $5 $2 $2 - $5 - ($126)
Sands Cotai Central (385) 170 5 54 4 - 2 - (150)
The Parisian Macao (252) 124 2 1 - - 1 - (124)
The Plaza Macao and Four Seasons Hotel Macao (60) 48 2 4 1 - - - (5)
Sands Macao (79) 20 - 1 - - - - (58)
Ferry Operations and Other (34) 6 - - - 13 - - (15)
Macao Operations (1,080) 498 14 62 7 13 8 - (478)
Marina Bay Sands (55) 225 27 - 7 33 2 - 239
United States:
Las Vegas Operating Properties (157) 122 - 6 - (46) 1 - (74)
United States Property Operations (157) 122 - 6 - (46) 1 - (74)
Other Development (18) - - - 18 - - - -
Corporate (167) 22 - - - - - 145 -
($1,477) $867 $41 $68 $32 - $11 $145 ($313)
Nine Months Ended September 30, 2019
Amortization Loss on Pre-Opening
Depreciation of Leasehold Disposal or and Adjusted
Operating and Interests Impairment Development Royalty Stock-Based Corporate Property
Income (Loss) Amortization in Land of Assets Expense Fees Compensation Expense EBITDA
Macao:
The Venetian Macao $913 $115 $4 $2 - - $5 - $1,039
Sands Cotai Central 294 229 5 1 15 - 2 - 546
The Parisian Macao 302 117 2 - - - 1 - 422
The Plaza Macao and Four Seasons Hotel Macao 202 28 2 8 3 - - - 243
Sands Macao 113 19 1 1 - - 1 - 135
Ferry Operations and Other (101) 11 - - - 83 - - (7)
Macao Operations 1,723 519 14 12 18 83 9 - 2,378
Marina Bay Sands 884 217 23 1 7 71 1 - 1,204
United States:
Las Vegas Operating Properties 408 107 - 5 - (153) - - 367
Sands Bethlehem 42 10 - - - - - - 52
United States Property Operations 450 117 - 5 - (153) - - 419
Other Development (11) - - - 11 - - - -
Corporate (282) 21 - - - (1) - 262 -
$2,764 $874 $37 $18 $36 - $10 $262 $4,001
Note: The company completed the sale of Sands Bethlehem on May 31, 2019.
55You can also read