Interim results Unaudited 2018 - Octodec
←
→
Page content transcription
If your browser does not render page correctly, please read the page content below
Unaudited   2018
Interim     creating value
            beyond financial return
results
creating value beyond
financial return
Octodec Investments Limited (Octodec or the group or the company) is listed
on the JSE Limited (JSE) as a real estate investment trust (REIT) with a portfolio of
309 properties valued at R12.9 billion, which includes a 50% interest in four joint
ventures. The group invests in the retail, residential, shopping centre, industrial and
office property sectors and all of the properties are situated in Gauteng.

Octodec is well-positioned to continue          Octodec has contracted City Property
taking advantage of opportunities in the        Administration Proprietary Limited
Tshwane and Johannesburg CBDs.                  (City Property), to perform its asset and
The group’s primary objective is to improve     property management functions.
the existing properties in strategic
investment nodes with the objective of
attracting new tenants and improving
rental income.

309                                                  66.3 %
properties                                            of our portfolio is in

                                                        sh ane
valued at
R12.9bn
                                          33.7 %
                                          of our portfolio is in

                                              ohannes urg
Octodec | interim results 2018

Measuring performance

101.7              cents per share distributed for the six-month period
                   (2017: 104.8 cents)

R29.62             net asset value (NAV) per share

3.2 %              like-for-like growth in rental income for the six-month period

97.5 %             of exposure to interest rate risk is hedged

37.1%              loan to investment value (LTV)

9.2 %              all-in annual weighted average cost of borrowings

                   Sharon’s Place development substantially completed

Rental income % by sector

36.9 %
FY2017: 37.1%
                             30.5 %
                             FY2017: 29.5%
                                                         20.7 %
                                                         FY2017: 21.1%
10.6% shopping
centres
                            Residential                     Offices
FY2017: 10.0%
26.3%
retail – shops
FY2017: 27.1%
Retail

                                 7.5%
                              FY2017: 8.2%
                                                         4.4 %
                                                         FY2017: 4.1%

                              Industrial                   Parking
North West
                                                          Gauteng
                                                                      Tshwane

                        Mogale City

                                                            Ekurhuleni
                    Randfontein                 Johannesburg                              Mpumalanga

                                   Soweto
                Merafong City
                                                                                 Lesedi

                                Emfuleni
                                                       Midvaal

                           F r e e St a t e

    Geographical analysis of the rental income

      33.2%
                       21.2%
                                      12.7%       12.5%
                                                                 7.1%       5.0%          4.3%          4.0%

      Tshwane       Johannesburg      Tshwane   Johannesburg &   Tshwane    Tshwane     Silverton &    Waverley,
        CBD             CBD             Other    Surroundings    Hatfield    Arcadia   Surroundings   Gezina, Moot
contents
review of results                                                                        2

investing for growth                                                                     6
  Developments                                                                           6
  Disposals                                                                              7
  Vacancies                                                                         Property
                                                                                         8
  Lease expiryOur business
              profile                                                                    9
                 Ownership structure
borrowingsBusiness model                                                                10

changes inOperating
             fair value
                      context                                                           12

renewal of asset and property management
           Risks and material issues

agreementLeadership
             with City Property                                                         12

prospectsPerformance                                                                    13
           Financial director’s review
declarationOperating
             of cash  review
                            dividend                                                    14
  Salient datesProperty
                and times
                        portfolio review                                                14
  Tax implications
               Residfor  non-resident
                     entia l property sectorshareholders
                                             review                                     15
                Retfor
  Tax implications ail pSouth
                        roperty sAfrican
                                 ector reviresident
                                           ew       shareholders                        15
                  Office property sector review
notes to the condensed consolidated interim
             Industrial property sector review
financial statements
             Parking property sector review
                                                                                        16
  Basis of preparation                                                                  16
             Resources and relationships review
  Fair value measurement                                                                16
                 Financial resources
  Stated capital, basic and diluted earnings per share                                  18
                 Physical resources
  Events after the reporting date                                                       18
                 Our people
  Commitments
           Relationships
                                                                                        18
  Related partyKnow-how
                transactions                                                            18

financial statements
            Natural resources                                                           19
                 Meeting our social investment commitment
  Condensed consolidated statement of financial position                                19
          Corporate
  Condensed consolidatedgovernance      review income
                        statement of comprehensive                                      20
            Application of King
  Condensed consolidated        IVTM
                             statement of changes in equity                             21
            Remuneration review
  Condensed consolidated   statement of cash flows                                      22
                 Social, ethics, remuneration and transformation committee review
  Reconciliation of comprehensive income to headline earnings                           23
          Audited
  Condensed          financial
            consolidated       statements
                         segmental information                                          23

              Notice of annual general meeting
  Reconciliation of earnings to distributable earnings                                  24

              Glossary
review of results
During the period under review, the local operating environment was plagued by political
and policy uncertainty which weighed heavily on consumer confidence and local economic
growth. With this in mind our approach was to increase our focus on the core property
fundamentals and position ourselves to continue to provide shareholders with sustainable
value creation. We increased our focus on the disposal of non-core and under-performing
properties.
Octodec’s board has declared a dividend of 5.3%) and property operating expenses
101.7 cents per share for the six-month period increased by 2.2% compared to the prior
ended 28 February 2018. The dividend was comparative period. The gross operating cost
impacted by pressure on rental income growth ratio to contractual revenue reduced to 44.2%
as a result of the sluggish performance of the (31 August 2017: 45.9%). Operating costs,
local economy, and the reduction in net of assessment rates, utility recoveries
distributable income during the let-up phase of and other recoveries, were at 28.3%
The Manhattan, One on Mutual and Sharon’s (31 August 2017: 30.9%) of contractual rental
2
Place. Total revenue earned on a contractual income. This was due to an increased focus on
basis increased by 3.5% (28 February 2017: cost reductions and improved efficiencies.
Salient features
6 months 6 months
28 February 28 February
% 2018 2017
Change R’000 R’000
Revenue – earned on contractual basis 3.5 929 656 897 813
Net property income – earned on
contractual basis 4.7 518 866 495 683
Investment property including joint ventures 1.9 12 904 343 12 664 048
Shareholders’ funds 1.9 7 884 600 7 736 852
Interest bearing borrowings 2.1 4 832 687 4 734 847
Shares in issue (‘000) 266 198 261 539
Net asset value (NAV) per share (cents) 0.1 2 962 2 958
Loan to investment value (LTV) ratio (%) 37.1% 37.2%
Distribution to shareholders (1.2) 270 779 274 137
Distribution per share (cents) (3.0) 101.7 104.8Octodec | interim results 2018
Percentage increase
2018
2017
%
9.6
10
8.2
8
7.0
6.0
6.1
5.7
6 core portfolio, represented by those properties held for the previous comparable period with
The
no major development activity, reflected like-for-like rental income growth of 3.2%. Rental achieved
3.8
from
4 retail shopping centres and parking showed the strongest growth, at 7.0% and 9.6%
2.5
respectively. The residential portfolio showed lower growth in like-for-like rental income of 1.4%.
2.1
1.8
1.4
2
This lower growth is mainly attributable to increased vacancies and lower escalations of rental
0.8
rates during the period, mainly in Hatfield and the Tshwane CBD. A number of new competitors
0
entered the Hatfield market, resulting in increased supply of residential accommodation. Marketing
efforts and an enhancement of the tenant offering to address the increased competition are
Residential
High street shops
Offices
centres
Shopping
Industrial
Parking
bearing results with a reduction in residential vacancies achieved after 28 February 2018 to 3.7%.
Rental income from shopping centres increased by 7.0% compared to the same period in the prior
year. However, we do not anticipate a similar performance in the second six-months due to
increased vacancies at the end of February 2018.
Percentage increase in like-for-like rental income for the 3
six-month period ended 28 February 2018
% Percentage increase
9.6
10
7.0
8
6
4.3
4
2.5
Percentage increase in
1.4
2 like-for-like rental income of
0.8
0 3.2%
Parking
centres
Shopping
shops
Retail –
Offices
Residential
Industrialreview of results | continued
review of results continued
Cost to income ratios
The cost to income ratios are as follows:
28 February 28 February 31 August
2018 2017 2017
% % %
Property costs
Gross basis 44.2 44.8 45.9
Net basis 28.3 29.6 30.9
Property and administration costs
Gross basis 49.4 49.0 50.2
Net basis 35.0 34.6 36.0
Property costs, both on a gross and net basis, have decreased compared to the prior period.
4 This is largely due to the reversal of an accrual for tenant installations which did not occur as well
as accruals for electricity and water, which estimate was revised in the current period, based on
our experience with billings from the Councils.
Bad debt write-offs and provisions during the period remained unchanged at 1.2% of total tenant
income (28 February 2017: 1.2%). Despite the sustained economic pressure, arrears and doubtful
debt provisions remain at acceptable levels as a result of tight credit risk management.
No significant deterioration is anticipated in the near future.
The administrative costs increased by R14.6 million compared to the same period in 2017, mainly
due to once-off costs incurred with the negotiation and preparation of the asset and property
management agreement, a provision for a VAT liability relating to prior periods as well as an overall
increase in administration expenses.
Finance costs for the period amounted to R213.9 million, an increase of 7.5% compared to the
prior period. The all-in weighted cost of borrowings remained at 9.2% per annum (31 August 2017:
9.2%). This is mainly due to increased borrowings to fund developments and projects, as well as
the cost of additional interest rate hedging contracts entered into during the period.Octodec | interim results 2018
5
2018
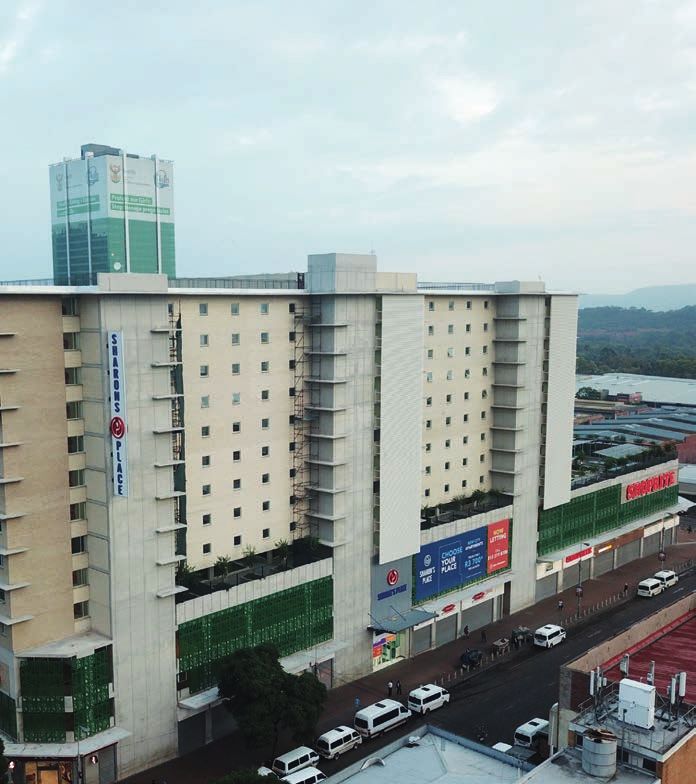
Sharon’s Place
Interesting views of
Sharon’s Place with
drone photographyinvesting for growth
Developments
Sharon’s Place, a large, well-located residential development consisting of 400 residential
units, 5 660 m2 of ground floor retail, anchored by Shoprite and Clicks, and 289 parking
bays, is adjacent to the new Tshwane House municipal development in the Tshwane CBD.
The total cost of the project, excluding land costs, is R356.0 million. The initial annual yield,
excluding land costs, is expected to be 7.3% when fully let. The retail portion of the
property was completed in July 2017 and Block B of the residential section, which consists
of three blocks, was complete as at 28 February 2018. Blocks A and C are expected to be
completed in phases by June 2018. There has been a strong demand for the residential
units, with all units in Block B being let shortly after completion thereof.
The group has several smaller projects under way, in line with Octodec’s strategy to upgrade,
maintain and extract value from its property portfolio. These include the upgrade of North City,
an office block in Braamfontein and The Tannery, a multi-tenanted industrial complex situated in
6
Silverton, Tshwane. These projects will not only improve the occupancy levels and enhance the
value of the portfolio, but will also contribute to the upliftment of the areas in which Octodec is
predominantly invested.
Octodec is in the planning phase of a residential development, Reinsurance House, which is
situated in a prime location in the Johannesburg CBD. This development will only commence
when a suitable yield of at least 8.5% is achievable. The total development cost is expected to be
approximately R110 million.
2018
Tshwane
Sharon’s PlaceOctodec | interim results 2018
Disposals
In line with the decision to dispose of non-core or under-performing properties, the group
disposed of a further ten properties during the period, six of which have been transferred
for a total consideration of R43.8 million. Transfer of the remaining four properties for a
total consideration of R44.8 million is expected to take place before the 2018
financial year-end.
Properties disposed of and transferred before 28 February 2018
Total Profit/(loss) Exit
consideration on disposal Transfer yield
PROPERTY LOCATION R’million R’million date %
Pretboy Tshwane Other 3.2 (0.4) February 2018 7.1
Pretwade Wadeville 10.5 – February 2018 3.6 7
Johannesburg
Sharp Centre Tshwane CBD 5.7 – October 2017 10.0
Iskemp Isando, 18.0 1.1 February 2018 1.2
Johannesburg
119 & 121 Johannesburg CBD 5.6 0.2 December 2017 0.1
Albertina Sisulu
Grariv Tshwane Other 0.8 0.1 December 2017 5.2
Units 24 and 42
Total 43.8 1.0 7.1
Transfers expected to take place after 28 February 2018
Total Profit/(loss) Expected Exit
consideration on disposal transfer yield
PROPERTY LOCATION R’million R’million date %
Swemvoor Gezina, Tshwane 9.1 0.8 June 2018 5.0
Viskin Tshwane CBD 3.0 (0.3) May 2018 9.0
Tronap Tshwane North 6.7 – June 2018 10.0
Medical Towers Johannesburg CBD 26.0 0.9 June 2018 4.0
Total 44.8 1.4 5.5investing for growth | continued
Vacancies
Vacancies in the Octodec portfolio at 28 February 2018, including properties held for
redevelopment, amounted to 18.5% (31 August 2017: 19.0%) of gross lettable area.
The core vacancies, which exclude the gross lettable area relating to properties held
for development, those currently being redeveloped and those recently redeveloped,
amounted to 10.8% (31 August 2017: 10.7%).
Vacancies by sector as at 28 February 2018
Properties
Gross held for
lettable redevelopment
area Total or recently Core
(GLA) vacancies developed vacancies
m² % % %
Offices 509 084 37.5 (22.2) 15.3
8 Retail – shops 390 556 9.2 – 9.2
Retail – shopping centres 92 198 6.2 – 6.2
Industrial 263 050 14.5 – 14.5
Residential 396 962 8.7 (3.3) 5.4
Total 1 651 850 18.5 (7.7) 10.8
31 August 2017
Offices* 509 848 36.7 (21.8) 14.9
Retail – shops* 398 105 10.8 (1.6) 9.2
Retail – shopping centres 91 867 4.6 – 4.6
Industrial 270 521 12.3 – 12.3
Residential 394 721 12.3 (5.1) 7.2
Total 1 665 062 19.0 (8.3) 10.7
* In order to provide a meaningful comparison, certain GLA was re-allocated from retail – shops to
Offices in 2017.Octodec | interim results 2018
Residential total vacancies include units in In recent years, certain office properties such
Blocks A and C of Sharon’s Place which are still as Fedsure House, Reinsurance House, Van
under construction as at February 2018. Office Riebeeck Medical Building and Midtown were
vacancies are expected to increase due to a acquired with high vacancy levels. These office
large government tenant currently occupying properties, with 112 869 m2 of mothballed
3100m2, who will be vacating in April 2018. space, offer significant residential conversion,
As expected, a number of properties held for office redevelopment or disposal opportunities,
development, or those which are currently the value of which will be realised over time.
under development, have vacancies.
Lease expiry profile
Octodec’s portfolio features a mix of short to long-term leases. The majority of the leases
provide for a monthly agreement at expiry of the lease. When this occurs an effort is made
to conclude longer-term leases. This is especially typical of the residential market and
9
leases with small to medium-sized enterprises.
Lease expiry profile as at 28 February 2018
Gross Monthly
lettable area contractual
(GLA) rent
m² % R’000 %
Residential (12 months and less) 362 573 21.9 36 175 29.4
Monthly commercial 204 960 12.4 17 200 14.0
to 28 February 2019 290 928 17.6 24 601 20.0
to 28 February 2020 190 874 11.6 15 300 12.5
to 28 February 2021 150 554 9.1 15 677 12.7
to 28 February 2022 67 789 4.1 5 904 4.8
Thereafter 79 175 4.8 8 128 6.6
Vacancies 304 997 18.5 – –
Total 1 651 850 100.0 122 985 100.0borrowings
Borrowings as at 28 February 2018
Weighted average
interest rate per
Amount annum
R’million %
Bank loans 3 705.5 9.2
Domestic medium term note programme (DMTN) 1 127.2 8.4
Total borrowings 4 832.7 9.0
Cost of swaps – 0.2
Total borrowings 4 832.7 9.2
The group’s loan to value ratio (LTV) (value of contracts in respect of 97.5% (31 August 2017:
10
interest bearing borrowings, net of cash 82.1%) of its borrowings.
divided by the fair value of its investment
The hedges in place are for a weighted average
portfolio) as at 28 February 2018 is 37.1%
period of 1.6 years. The all-in average weighted
(31 August 2017: 37.1%).
interest rate of all borrowings is 9.2% per
Octodec has reduced its exposure to interest annum (31 August 2017: 9.2%).
rate risk by entering into interest rate swap
2018
Tshwane
012central featured in
the foreground2018
2019
2020
2021
Octodec | interim results 2018
Loan expiry profile per financial year (Rm and %)
2259 (47%)
%
Rm
50
2500
40
2000
1002 (21%)
833 (17%)
30
739 (15%)
1500
1000 20
500 10
Total value of loans
0 0 R4.833 billion
2018
2019
2020
2021
Expiry profile of fixed rate loans and interest rate swap contracts per financial year (Rm and %)
11
1361 (29%)
1750 (37%)
Rm
%
1101 (23%)
1500
30
1250
25
1000
500 (11%)
20
750 15
500 10
Total interest rate swaps
250 5 and fixed rate loans
0 0 R4.712 billion
2018
2019
2020
2021
Octodec participates in a DMTN programme Premium Properties Limited are A-(ZA) and
through its subsidiary, Premium Properties A1-(ZA) respectively.
Limited. As at 28 February 2018 the total
Octodec had unutilised available banking
issuance was at R1 127.2 million, or 23.3% of
facilities amounting to R838.5 million at
the group’s borrowings. Global Credit Rating’s
28 February 2018.
long and short-term national scale ratings of
2259 (47%)
%
Rm
50
2500changes in fair value
It is the group’s policy to perform internal valuation of R54.7 million or 0.4% for the
valuations of all the properties at the interim six month period ended 28 February 2018.
period and at year-end. The valuations are
The mark-to-market value of interest rate
based on the income capitalisation method,
swaps contracts, which protect the group
which is consistent with the basis used in prior
against adverse interest rate movements,
years. The property portfolio was internally
resulted in a fair value gain of R6.3 million
valued at R12.7 billion after a net increase in
for the period.
renewal of asset and
12
property management
agreement with
City Property
Octodec will, subject to shareholders’ and A circular to shareholders of Octodec containing,
other approvals, enter into a new asset and inter alia, the salient features of the agreement,
property management agreement with City together with the requisite Fairness Opinion,
Property, effective from 1 July 2018, which and containing a notice of general meeting, will
agreement will replace the existing asset and be mailed to shareholders in due course.
property management agreement between
the parties.Octodec | interim results 2018
prospects
After a challenging environment characterised by political and economic uncertainty,
the local operating environment has started to show some signs of improvement, which
should provide the stimulus for Octodec to continue to unlock value and provide
shareholders with a growing and sustainable distribution.
Octodec and its experienced management expected to be similar to the distribution for the
team combined with its diversified portfolio, six-month period ended 28 February 2018.
large number of tenants, sound operating Therefore no growth in distribution per share
fundamentals and prudent capital for the full financial year is anticipated.
management, bears out Octodec’s resilience
This guidance is based on the following:
during these challenging times.
• forecasted investment property income is
Octodec responded to the increased
calculated using contractual rentals and
competition and changing trends in the
assumed market-related renewals
residential sector by adjusting the tenant
• allowance for vacancies has been
offering without compromising on
established using assumptions and historical
recoverability of rentals or other standards. 13
experience
This has already contributed to the improved
• no major corporate and tenant failures
occupation levels in the residential sector with
are assumed
vacancies having decreased from 7.2% at
• no further deterioration in the economic and
31 August 2017 to 5.4% at 28 February 2018.
social environments
This, together with prudent cost management • the phased take-up of rental space in
across the group, should sustain the greenfield developments is based on
performance of the group for the remainder of historical experience adjusted for the current
the financial year. economic environment.
The disposal of non-core or under-performing This forecast has been neither reviewed nor
properties will remain a key focus area for the reported on by the group’s auditors.
foreseeable future.
The forecast distribution for the second
six-month period ending 31 August 2018 isdeclaration of
cash dividend
The board of directors of Octodec declared an interim cash dividend of 101.7 cents per share,
for the six months ended 28 February 2018, out of the company’s distributable income.
Salient dates and times
The salient dates and times for the cash dividend are as set out below:
2018
Last day to trade cum dividend Tuesday, 15 May
14
Shares trade ex-dividend Wednesday, 16 May
Record date to receive cash dividend Friday, 18 May
Electronic transfer into personal bank account of certificated
shareholders2 Monday, 21 May
Accounts credited by CSDP or broker to dematerialised shareholders
with the cash dividend payment Monday, 21 May
Notes:
1.
Shares may not be dematerialised or rematerialised between Wednesday, 16 May 2018 and Friday,
18 May 2018, both days inclusive. The above dates and times are subject to change. Any changes will be
announced on SENS.
2.
Where the transfer secretaries do not have the banking details of any certificated shareholders, the cash
dividend will be held by the company pending receipt of the relevant certificated shareholder’s banking
details, whereafter the cash dividend will be paid via electronic transfer into the personal bank accounts of
certificated shareholders.Octodec | interim results 2018
Tax implications for non-resident shareholders
Dividends received by non-resident shareholders from a REIT will not be taxable as income and will
be exempt from income tax in terms of the exemption in section 10(1)(k)(i) of the Income Tax Act. Any
dividend received by a non-resident from a REIT is subject to dividend tax at 20%, unless the rate is
reduced in terms of any applicable agreement for the avoidance of double taxation agreements (DTA)
between South Africa and the country of residence of the non-resident shareholders. Assuming
dividend tax will be withheld at a current rate of 20% the net dividend amount due to non-resident
shareholders is 81.36 cents per share.
A reduced dividend tax in terms of the applicable DTA may only be relied on if the non-resident
shareholder has submitted the following forms to his/her CSDP or broker, as the case may be, in
respect of uncertificated shares, or the transfer secretaries, in respect of certificated shares:
• A declaration that the dividend is subject to a reduced rate as a result of the application of
the DTA; and
• A written undertaking to inform the CSDP, broker or the transfer secretaries, as the case may be,
should the circumstances affecting the reduced rate change or the beneficial owner cease to be
the beneficial owner,
both in the form prescribed by the Commissioner for the South African Revenue Services (SARS).
If applicable, non-resident shareholders are advised to contact the CSDP, broker or the company, as
the case may be, to arrange for the above-mentioned documents to be submitted prior to payment of
the dividend, if such documents have not already been submitted.
15
Tax implications for South African resident shareholders
Dividends received by or accrued to South African tax residents must be included in the gross income
of such shareholders. They are not exempt from income tax in terms of the exclusion to the general
dividend exemption contained in section 10(1)(k)(i)(aa) of the Income Tax Act because they are
dividends distributed by a REIT. These dividends are, however, exempt from dividend withholding tax
(dividend tax) in the hands of South African resident shareholders, provided that the South African
resident shareholders have made submissions to the CSDP or broker, as the case may be, in respect
of uncertificated shares, or the company in respect of certificated shares, a DTD (EX) (Dividend Tax:
declaration that the dividend is exempt from dividends tax and a written undertaking to inform the
CSDP, broker or the company, as the case may be, should the circumstances affecting the exemption
change or the beneficial owner ceases to be the beneficial owner, both in the form prescribed by the
Commissioner for the South African Revenue Services (SARS).
If resident shareholders have not submitted the above-mentioned documentation to confirm their
status as a South African resident they are advised to contact their CSDP or broker, as the case may
be, to arrange for the documents to be submitted prior to payment of the cash dividend.
Shareholders are encouraged to consult with their professional advisors should they be in any doubt
as to the appropriate action to take.
The number of shares in issue at the date of this declaration is 266 197 535 and Octodec’s tax
reference number is 9925/033/71/5.
By order of the board
S Wapnick JP Wapnick
Chairman Managing director
20 April 2018notes to the condensed
consolidated interim
financial statements
Basis of preparation
The condensed consolidated interim financial consistent with those applied in the
statements are prepared in accordance with preparation of the previous consolidated
the JSE Listings Requirements and the financial statements.
requirements of the Companies Act, 71 of
These results have been prepared under the
2008 of South Africa. The interim report has
historical cost convention, except for investment
been prepared in accordance with IAS 34:
properties, which are measured at fair value,
Interim Financial Reporting, the SAICA
and certain financial instruments, which are
Financial Reporting Guides as issued by the
measured at either fair value or amortised cost.
Accounting Practices Committee and Financial
Pronouncements as issued by the Financial These condensed consolidated interim financial
16 Reporting Standards Council. The accounting statements were prepared under the
policies applied in the preparation of the supervision of Mr AK Stein CA (SA), in his
condensed consolidated interim financial capacity as group financial director and have
statements are in accordance with International not been reviewed or reported on by the
Financial Reporting Standards (IFRS) and are company’s auditors.
Fair value measurement
The fair value of investment properties is investment properties resulted in an increase in
arrived at on the basis of a valuation technique profit of R54.7 million in the statement of profit
using the net income capitalisation method and loss and other comprehensive income.
carried out on 28 February 2018, by taking into In terms of the JSE Listings Requirements, all
account prevailing market rentals, occupation the properties are valued at least once over a
levels and capitalisation rates. The other key rolling three-year period by external
input used in the valuation calculation is the independent valuation experts.
expected long-term net operating income
Financial instruments measured at fair value
margin, of which the expense ratio and long
include derivatives. The fair values of the
range vacancy factor is the significant
interest rate swaps are determined on a
unobservable input. There have been no mark-to-market valuation calculated by the
changes in judgements or estimates of various financial institutions with whom the
amounts or valuation techniques as reported in swaps are held, by discounting the estimated
previous reporting periods. The directors value future cash flows based on the terms and
the entire property portfolio bi-annually. The maturity of each contract and using the market
effect of the fair value measurement on interest rate indicated on the SA swap curve.Octodec | interim results 2018
Fair value measurement continued
Fair value hierarchy
The fair value hierarchy reflects the significance • Level 3: Input for the asset or liability that is
of the inputs used in making fair value not based on observable market data
measurements. The level within which the fair (unobservable input).
value measurement is categorised in its
Investment properties and derivative financial
entirety is determined on the basis of the
instruments have been categorised as Level 3
lowest level input that is significant to the fair
and Level 2, respectively, and there have been
value measurement in its entirety.
no significant transfers made between Levels
The different levels have been defined as: 1, 2 and 3 during the period. There have been
no material changes in judgements or
• Level 1: Quoted prices (unadjusted) in active
estimates of amounts or valuation techniques
markets for identical assets or liabilities
as reported in previous reporting periods.
• Level 2: Input other than quoted prices
included within Level 1 that are observable
for the asset or liability, either directly (i.e. as
prices) or indirectly (i.e. derived from prices)
Fair value measurements using significant unobservable inputs
Investment property, 17
plant and equipment
R’000
Balance as at 31 August 2017 12 598 899
Total fair value changes for the period included in profit and loss 54 733
Straight-line rental income accrual 1 268
Depreciation and amortisation (8 214)
Acquisitions, disposals and other movements:
• Developments and subsequent expenditure 125 670
• Disposals (41 450)
Balance as at 28 February 2018 12 730 906
Included in profit and loss for the period:
Changes in fair value of investment property 54 733n tes t t e c n ense c ns li ate inte im financial statements | continued
Relationship of unobservable increase in the carrying amount of investment
inputs to fair value property of R1.6 billion.
The significant unobservable inputs used in the An increase/(decrease) of 1% in the weighted
fair value measurement of the group’s average expense ratio used to calculate the
investment properties are the capitalisation long-term net operating income margin, while all
rates, the expense to income ratios as well as other variables remain constant, would result in
the long range vacancy factor. Significant an increase/(decrease) in the carrying amount of
increases/(decreases) in any of these inputs in investment property of R170.7 million.
isolation would result in a significantly lower/ The third key input used in the valuation
(higher) fair value measurement. calculation is the long range vacancy factor.
An increase of 1% in the capitalisation rate, The expected long range vacancy factor takes
while all other variables remain constant, would into account historic and future expected
result in a decrease in the carrying amount of vacancy trends. The long range vacancy factor
investment property of R1.3 billion. A decrease indicates the expected vacancy to be applied
of 1% in the capitalisation rate, while all other over the long term that best approximates the
variables remain constant, would result in an actual experience. The range of long range
vacancy factors used was from 0.0% to 30.0%.
Stated capital, basic and diluted
earnings per share
During the period, the company repurchased 666 784 shares in the open market for a total
18 consideration of R11.3 million or R17.01 per share. The shares were de-listed from the JSE on 23
February 2018.
28 February 2018 31 August 2017
Shares in issue (‘000) 266 198 266 864
Weighted shares in issue (‘000) 266 586 261 207
Basic and diluted earnings per share (cents) 123.8 263.3
Events after the reporting date
There have been no material subsequent events that require reporting.
Commitments
The group has approved capital commitments in the amount of R56.4 million, relating to various
redevelopments, upgrades of properties and committed tenant installations. These will be funded
out of existing unused banking facilities.
Related party transactions
Octodec and City Property are related parties in that Jeffrey Wapnick and Sharon Wapnick are
directors of Octodec and City Property, and the Wapnick family are shareholders of both
companies.
Total payments made to City Property amount to R70.7 million. This included fees for collections,
leasing, property management, asset management, commission on acquisitions and disposals as
well as upgrades and developments.
At 28 February 2018, an amount of R1.1 million was owing to City Property.financial statements
Condensed consolidated
statement of financial position
Unaudited Reviewed Audited
28 February 28 February 31 August
2018 2017 2017
R’000 R’000 R’000
ASSETS
Non-current assets 12 739 824 12 605 157 12 568 875
Investment property 12 331 263 12 169 639 12 153 834
Plant and equipment 4 530 6 140 5 300
Straight-line rental income accrual 111 998 115 353 110 864
Tenant installation and lease costs 40 315 50 962 44 550
Other financial assets 75 000 69 275 75 000
Derivative financial instruments 3 281 18 024 1 847
Investment in joint ventures 173 437 175 764 177 480
Current assets 457 949 332 559 560 397
Trade and other receivables 134 827 144 076 143 342
19
Derivative financial instruments 708 42 293 1 736
Other financial assets 1 491 – 213
Bank and cash 78 123 – 130 756
215 149 186 369 276 047
Non-current assets held for sale 242 800 146 190 284 350
TOTAL ASSETS 13 197 773 12 937 716 13 129 272
EQUITY AND LIABILITIES
Equity 7 884 600 7 736 852 7 828 229
Stated capital 4 210 134 4 101 286 4 221 477
Non-distributable reserve 3 327 048 3 281 786 3 269 053
Retained earnings 347 418 353 780 337 699
Non-current liabilities 4 218 706 4 278 762 3 381 370
Interest bearing borrowings 4 093 637 4 170 344 3 253 517
Derivative financial instruments 44 591 27 955 47 421
Deferred taxation 80 478 80 463 80 432
Current liabilities 1 094 467 922 102 1 919 673
Interest bearing borrowings 739 050 564 503 1 572 817
Non-interest bearing borrowings 354 215 331 526 342 548
Bank overdraft – 24 715 –
Derivative financial instruments 1 202 1 358 4 308
TOTAL EQUITY AND LIABILITIES 13 197 773 12 937 716 13 129 272financial statements | continued
Condensed consolidated
statement of comprehensive income
Unaudited Reviewed Audited
6 months 6 months 12 months
28 February 28 February 31 August
% 2018 2017 2017
Change R’000 R’000 R’000
Revenue 930 924 897 190 1 831 346
earned on contractual basis 3.5 929 656 897 813 1 836 251
straight-line rental income accrual 1 268 (623) (4 905)
Property operating costs 2.2 (410 790) (402 130) (843 636)
Net rental income from properties 5.1 520 134 495 060 987 710
Administrative costs 38.7 (52 238) (37 660) (77 813)
Operating profit 2.3 467 896 457 400 909 897
Fair value changes 61 075 170 853 158 096
20 investment property 54 733 211 003 235 106
interest rate derivatives 6 342 (40 150) (77 010)
Profit on sale of investment property 1 051 2 566 2 943
Interest income 9 498 8 404 18 094
Finance costs 7.5 (213 869) (198 901) (408 702)
interest paid (223 035) (217 647) (439 201)
interest capitalised 9 166 18 746 30 499
Share of income from joint ventures 4 437 9 567 14 810
share of after tax profit 4 026 1 969 1 582
fair value changes – investment property (4 085) 2 956 2 572
interest and management fees 4 496 4 642 10 656
Profit before taxation (26.6) 330 088 449 889 695 138
Taxation charge – deferred (46) (7 474) (7 443)
Profit for the period (25.4) 330 042 442 415 687 695
Other comprehensive income for the period
items that will not be reclassified to
profit and loss – – –
Total comprehensive income for the
period attributable to equity holders (25.4) 330 042 442 415 687 695
Basic and diluted earnings per
share (cents) (27.8) 123.8 171.5 263.3Octodec | interim results 2018
Condensed consolidated statement of
changes in equity
Non-
Stated distributable Retained
capital reserve earnings Total
R’000 R’000 R’000 R’000
Balance at 31 August 2016 (audited) 3 958 207 3 112 885 342 708 7 413 800
Total comprehensive income for the period – – 442 415 442 415
Issue of new shares 143 079 – – 143 079
Dividends paid – – (262 442) (262 442)
Transfer to non-distributable reserve
Profit on sale of investment property – 2 566 (2 566) –
Deferred tax – (7 539) 7 539 –
Fair value changes
investment property – 211 003 (211 003) –
joint ventures – 2 956 (2 956) –
interest rate derivatives (net of
21
deferred tax) – (40 085) 40 085 –
Balance at 28 February 2017 (reviewed) 4 101 286 3 281 786 353 780 7 736 852
Total comprehensive income for the period – – 245 280 245 280
Issue of new shares 120 191 – – 120 191
Dividends paid – – (274 094) (274 094)
Transfer to non-distributable reserve
Profit on sale of investment property – 377 (377) –
Deferred tax – 96 (96) –
Fair value changes
investment property – 24 103 (24 103) –
investment property – joint ventures – (384) 384 –
interest rate derivatives (net of
deferred tax) – (36 925) 36 925 –
Balance at 31 August 2017 (audited) 4 221 477 3 269 053 337 699 7 828 229
Total comprehensive income for the period – – 330 042 330 042
Issue of new shares – – – –
Shares repurchased (11 343) – – (11 343)
Dividends paid – – (262 328) (262 328)
Transfer to non-distributable reserve
Profit on sale of investment property – 1 051 (1 051) –
Fair value changes
investment property – 54 733 (54 733) –
investment property – joint ventures – (4 085) 4 085 –
interest rate derivatives (net of
deferred tax) – 6 296 (6 296) –
Balance at 28 February 2018 (unaudited) 4 210 134 3 327 048 347 418 7 884 600financial statements | continued
Condensed consolidated statement of
cash flows
Unaudited Reviewed Audited
6 months 6 months 12 months
28 February 28 February 31 August
2018 2017 2017
R’000 R’000 R’000
Cash flow from operating activities
Net rental income from properties 467 896 457 400 909 897
Adjusted for:
straight-line rental income accrual (1 268) 623 4 905
depreciation and amortisation 8 214 11 341 20 536
working capital changes 20 182 1 185 12 987
Cash generated from operations 495 024 470 549 948 325
Interest income 9 498 8 404 18 094
Finance costs (223 035) (217 647) (439 201)
Payment of distribution to equity holders (262 328) (262 396) (536 536)
22
Net cash inflow/(outflow) from operating
activities 19 159 (1 090) (9 318)
Cash flow from investing activities
Investing activities (109 293) (199 938) (316 812)
Proceeds from disposal of investment property 42 491 50 598 77 200
Net cash outflow used in investing activities (66 802) (149 340) (239 612)
Cash flow from financing activities
Shares repurchased (11 343) – –
Buy back / issue of new shares – 143 079 263 270
Proceeds from interest bearing borrowings 1 037 471 597 798 3 488 910
Repayment of interest bearing borrowings (1 031 118) (641 978) (3 441 603)
Net cash (utilised)/generated from financing
activities (4 990) 98 899 310 577
Net (decrease)/increase in bank and
cash balance (52 633) (51 531) 61 647
Bank and cash balance at beginning of period 130 756 69 109 69 109
Bank and cash balance at end of period 78 123 17 578 130 756Octodec | interim results 2018
Reconciliation of comprehensive income to
headline earnings
Unaudited Reviewed Audited
6 months 6 months 12 months
28 February 28 February 31 August
2018 2017 2017
R’000 R’000 R’000
Total comprehensive income attributable to
equity holders 330 042 442 415 687 695
Headline earnings adjustments
Profit on sale of investment properties (1 051) (2 566) (2 943)
Fair value changes
investment property (54 733) (211 003) (235 106)
investment property – joint ventures 4 085 (2 956) (2 572)
Headline earnings attributable to equity holders 278 343 225 890 447 074
Headline earnings per share (cents) 104.4 87.6 171.2
23
Condensed consolidated segmental
information
The group earns revenue in the form of property rentals. On a primary basis the group is organised
into six major operating segments:
Unaudited Reviewed
6 months 6 months
28 February 28 February
2018 2017
Rental income by sector R’000 % R’000 %
Offices 152 069 21.0 148 141 21.1
Retail – shops 194 257 26.8 189 975 27.1
Shopping centres 74 569 10.3 69 838 10.0
Industrial 56 388 7.8 57 560 8.2
Parking 32 186 4.4 28 982 4.1
Residential 214 450 29.7 206 023 29.5
Total rental income 723 919 100.0 700 519 100.0
Recoveries and other income 207 005 196 671
Revenue 930 924 897 190
Further segment results cannot be allocated on a reasonable basis due to the “mixed use” of
certain of the properties. It is the company’s philosophy to invest predominantly in properties
situated in the Gauteng area, and therefore the company has not reported on a
geographical basis.financial statements | continued
Reconciliation of earnings
to distributable earnings
Unaudited Reviewed Audited
6 months 6 months 12 months
28 February 28 February 31 August
2018 2017 2017
% R’000 R’000 R’000
Total comprehensive income attributable to
equity holders 330 042 442 415 687 695
Profit on sale of investment properties (1 051) (2 566) (2 943)
Fair value changes
investment property (54 733) (211 003) (235 106)
investment property – joint ventures 4 085 (2 956) (2 572)
Straight-line rental income accrual (1 268) 623 4 905
Fair value changes of interest rate derivatives (6 342) 40 085 77 010
Deferred tax 46 7 539 7 443
Distributable earnings attributable to
24
equity holders 270 779 274 137 536 432
Represented by:
Revenue
earned on contractual basis 3.5 929 656 897 813 1 836 251
Property operating costs 2.2 (410 790) (402 130) (843 636)
Net rental income from properties 4.7 518 866 495 683 992 615
Administrative costs 38.7 (52 238) (37 660) (77 813)
Operating profit 1.9 466 628 458 023 914 802
Interest income 9 498 8 404 18 094
Share of income from joint ventures 8 522 6 611 12 238
Distributable profit before finance costs 484 648 473 038 945 134
Finance costs 7.5 (213 869) (198 901) (408 702)
Distributable income before taxation (1.2) 270 779 274 137 536 432
Taxation – – –
Equity holders distributable earnings (1.2) 270 779 274 137 536 432Octodec Investments Limited Incorporated in the Republic of South Africa Registration number: 1956/002868/06 Share code: OCT ISIN: ZAE000192258 REIT status approved Registered address CPA House, 101 Du Toit Street, Tshwane 0002 Tel: 012 319 8781, Fax: 012 319 8812, E-mail: info@octodec.co.za Directors S Wapnick (Chairman)1, JP Wapnick (Managing director)2, AK Stein (Financial director)2, DP Cohen3, GH Kemp4, AA Koranteng4, MZ Pollack1, PJ Strydom4 1 Non-executive director 2 Executive director 3 Lead independent director 4 Independent non-executive director Company secretary City Property Administration Proprietary Limited Contact person: Elize Greeff CPA House, 101 Du Toit Street Tshwane 0002 Tel: 012 357 1564, Email: elizeg@octodec.co.za Sponsor Java Capital Proprietary Limited Contact person: Tanya de Mendonca 6A Sandown Valley Crescent, Sandown, Sandton 2196 PO Box 522606, Saxonwold 2132 Tel: 011 722 3059, Email: sponsor@javacapital.co.za Transfer secretaries Computershare Investor Services Proprietary Limited Contact person: Leon Naidoo Rosebank Towers, 15 Biermann Avenue, Rosebank 2196 PO Box 61051, Marshalltown 2107 Tel: 011 370 5000, Email: leon.naidoo@computershare.co.za Investor relations Instinctif Partners Contact person: Frederic Cornet The Firs, 302 3rd Floor, Cnr Cradock and Biermann Road, Rosebank 2196 Tel: 011 447 3030, E-mail: investorrelations@octodec.co.za www.octodec.co.za
76
You can also read