2 An overview of global counterfeiting and the Swiss economy
←
→
Page content transcription
If your browser does not render page correctly, please read the page content below
18
2 An overview of global counterfeiting
and the Swiss economy
This chapter appraises the damage caused by infringement of Swiss
intellectual property rights in world trade. It identifies who suffers in
particular from this illicit activity, estimates the scope and volume of such
infringements, and presents the top destination and provenance economies
for counterfeit goods that infringe Swiss IPR. The focus then shifts to the
Swiss products that are most susceptible to counterfeiting. This chapter
also pays particular attention to the latest trends in trade in counterfeit
goods infringing Swiss IPR related to the COVID-19 pandemic. Finally, the
negative effects of IPR infringement on the Swiss economy are estimated in
terms of lost sales, lost jobs, and lost government revenue.
COUNTERFEITING, PIRACY AND THE SWISS ECONOMY © OECD 2021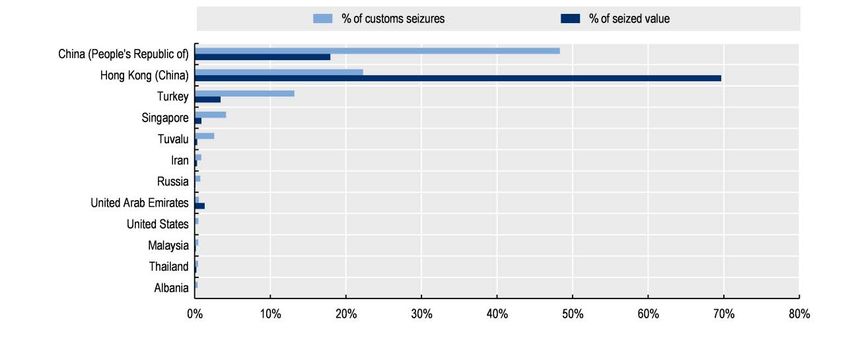
19
The scope and magnitude of the problem
Where do fake Swiss products originate?
Over the 2011-19 period, the largest share of fake Swiss products seized infringing Swiss intellectual
property (IP) originated from the People’s Republic of China (hereinafter China) and Hong Kong (China).
In 2016, these economies represented 52% and 25% of customs seizures respectively. In terms of seized
value, China and Hong Kong (China) also accounted for the largest share of counterfeit Swiss products.
In 2016, China accounted for more than 70% of seized value while Hong Kong (China) represented 19%.
Over the 2017-19 period, China and Hong Kong (China) remained the main provenance countries of fake
Swiss products in terms of both customs seizures and seized value, followed by Turkey and Singapore.
An important observation is the strengthening of the role of Hong Kong (China) as an important transit hub
for fake Swiss products. In 2019, this economy accounted for almost 70% of the total seized value of fake
Swiss products while China accounted for 18% (Figure 2.1).
Figure 2.1. Top provenance economies of fake goods infringing Swiss IP, 2017-19
Note: Tuvalu is a seasonal transit point, misused by traffickers in their operations.
Source: OECD customs seizures database.
Figure 2.2 lists the other top source economies of fake goods infringing Swiss IP excluding China and
Hong Kong (China) (the main provenance countries). This reveals the relative roles of subsidiary
economies as sources of fake Swiss products.
COUNTERFEITING, PIRACY AND THE SWISS ECONOMY © OECD 2021
20
Figure 2.2. Other main provenance economies of fake Swiss goods, excluding China and Hong
Kong (China), 2017-19
% of customs seizures % of seized value
Turkey
Singapore
Tuvalu
Iran
Russia
United Arab Emirates
United States
Malaysia
Thailand
Albania
India
Spain
Chinese Taipei*
Morocco
Viet Nam
0% 2% 4% 6% 8% 10% 12% 14%
Source: OECD customs seizures database.
The list of secondary sources of fake goods that infringe Swiss IP changes very dynamically. It also
includes some small countries that appear as seasonal transit economies for fake products (e.g. Tuvalu).
It reinforces the points made in the OECD/EUIPO studies,1 that the trade routes of fake goods are very
dynamic, as counterfeiters adapt their strategies instantly, quickly responding to enforcement actions taken
by customs. It also points out the great difficulty and complexity involved in countering this scourge.
Which product categories are targeted most?
There are two relevant measures that show the intensity of trade in fakes in different product categories:
number of seizures and value of products seized. Counterfeit products infringing Swiss IP were mostly
watches, representing around 80% of both seized value and customs seizures.
In terms of number of seizures, other than watches, clothing (11.4% of customs seizures), and footwear
(3.2%) were the main counterfeit product categories seized (Figure 2.3).
In terms of value, clothing (3.8%) and articles of leather (2%) were the main categories seized after
watches.
The difference between the seized value and the number of customs seizures can be explained by the
varying unit value of goods (for instance a single luxury product that deceives customers can be of relatively
high value). It can also be attributed to transport modes and the related size of shipment. For tobacco, for
example, the difference comes from some seizures of vessels containing large quantities of cigarettes:
around one-third of seizures of tobacco infringing Swiss IPRs contained more than 16 000 items. Such
quantities tend to increase the seized value, while they still count as a single seizure. Conversely, for
clothing, only a few seizures related to shipment by sea have been made and the size of a single shipment
tends to be small.
Another worrying trend is counterfeit packaging and logos. The number of seizures of these items keeps
growing – in 2019, they accounted for about 3% of total seizures. Counterfeit packaging illustrates a
growing trend when counterfeiters smuggle an unbranded good and a logo separately, to reduce the risk
of a seizure. Even though the good might still violate some IP rights, like patents or designs, the risk of
detection is much smaller than in the case of a counterfeit product. As noted by enforcement officials and
industry experts, this tactic has recently become frequently used by counterfeiters targeting Swiss branded
products.
COUNTERFEITING, PIRACY AND THE SWISS ECONOMY © OECD 2021 21
Figure 2.3. Top Swiss products targeted by counterfeiting, 2017-19
% of customs seizures % of seized value
Watches (91)
Clothing, knitted or crocheted (61)
Footwear (64)
Packaging
Articles of leather; handbags (42)
Perfumery and cosmetics (33)
Jewellery (71)
Label
Tobacco (24)
Plastic and articles thereof (39)
Machinery and mechanical appliances (84)
Optical; photographic; medical apparatus (90)
0% 10% 20% 30% 40% 50% 60% 70% 80% 90% 100%
Note: Figures in parenthesis are Harmonised System (HS) codes as defined by United Nations (UN) Trade Statistics (2017).
Source: OECD customs seizures database.
Figure 2.4. Other Swiss product categories targeted by counterfeiting, excluding watches, 2017-19
% of customs seizures % of seized value
Clothing, knitted or crocheted (61)
Footwear (64)
Packaging
Articles of leather; handbags (42)
Perfumery and cosmetics (33)
Jewellery (71)
Label
Tobacco (24)
Plastic and articles thereof (39)
Machinery and mechanical appliances (84)
Optical; photographic; medical apparatus (90)
0% 2% 4% 6% 8% 10% 12%
Note: Figures in parenthesis are Harmonised System (HS) codes as defined by United Nations (UN) Trade Statistics (2017).
Source: OECD customs seizures database.
What are the main destinations for Swiss fakes?
Fakes infringing Swiss IP were exported to 55 different economies between 2017 and 2019 – though
mainly European countries (Figure 2.5). Germany (48%) and Belgium (14%) were the main destination
economies for these fakes, followed by the Netherlands, the United Kingdom (UK) and Spain.
In terms of seized value, the ranking is different, with the UK being the main destination country,
representing more than 60% of the seized value. The UK was followed by Germany (11.4%) and the
Netherlands (5.5%).
The big differences between the share of seized value and the share of customs seizures can be
explained by the transport mode used to export the fake Swiss goods. Indeed, sea transport was more
often used to export fake Swiss goods to Belgium and the UK, while Swiss fake goods destined for
Germany were mainly shipped by mail. This means that the size of shipments of fake Swiss goods
exported to the UK tend to be big while the size of shipments exported to Germany was smaller.
COUNTERFEITING, PIRACY AND THE SWISS ECONOMY © OECD 202122
Figure 2.5. Top destinations of counterfeit goods infringing Swiss IP, 2017-19
% of customs seizures % of seized value
Germany
Belgium
Netherlands
Spain
United Kingdom
France
Luxembourg
Denmark
Poland
Italy
Portugal
Malta
Ireland
Bulgaria
0% 10% 20% 30% 40% 50% 60% 70%
Source: OECD customs seizures database
The preponderance of European countries as destinations for fake Swiss goods is partly explained by the
nature of the dataset on customs seizures. As indicated in Chapter 1 the data on customs seizures rely on
three sources: the World Customs Office, EC Directorate-General for Taxation and Customs Union (DG
TAXUD), the United States (US) Customs and Border Protection and the US Immigration and Customs
Enforcement (CBP/ICE). The latter source does not provide the name of infringed brands. Consequently,
data relative to counterfeit goods seized in the US are outside the scope of the analysis of Swiss IP
infringement.
In order to address this bias, we need to estimate how many fake Swiss products are destined for the US.
This estimation is done for each product category. To do this we assume that the share of fake Swiss
products worldwide is the same as in the US. Take the example of fake watches: of all fake watches,
around 55% are fakes of Swiss products. We can therefore assume that 55% of fake watches seized by
US customs are fake Swiss products.
Based on these assumptions, the US would be the top destination country of counterfeit Swiss goods:
however, this result is based on strong assumptions and has to be interpreted with caution.
How are fake Swiss goods exported?
Over the whole analysed period, for which robust data are available, i.e. between 2011 and 2018, small
parcels sent by mail were the predominant way of exporting fake “Swiss made” goods.
As presented in Figure 2.6.Figure 2.6, between 2011 and 2016, most fake Swiss goods were sent by mail
(49% of customs seizures), followed by air transport and express courier, at 30% and 14% of seizures
respectively.2 In terms of value, air and sea transport were the main modes of transport for counterfeit
goods infringing Swiss IPRs.
This trend of abuse of small parcels continued over the 2017-19 period when mail (67%) and air transport
(18%) were also the preferred conveyance methods of fake Swiss goods. In terms of value, sea and
express courier were the main modes of transport for counterfeit goods infringing Swiss IPRs as air
transport has declined compared to the 2011-16 period.
COUNTERFEITING, PIRACY AND THE SWISS ECONOMY © OECD 2021 23
Figure 2.6. Modes of transporting counterfeit Swiss products, 2011-16
Share of customs seizures Share of seized value
Road Mail
Road
4% Express courier
1% Express courier 18%
14%
Sea 15%
3%
Mail
49%
Sea
28%
Air
30% Air
38%
Share of customs seizures
Share of seized value
Road transport Sea
3% 1%
Air
9%
Air
18% Sea
32%
Express
Courier Express Courier
11% 35%
Mail Road
67% 2% Mail
22%
Source: OECD customs seizures database
During the analysed period, most shipments of counterfeit Swiss products appear to be small (Figure 2.7).
Almost 70% of customs seizures registered report only 1 item per shipment; 84% of shipments contained
fewer than 6 items.
Over the 2017-19 period, the shipment size of counterfeit Swiss goods was stable compared to 2011-16.
Small shipments dominated the trade in counterfeit Swiss goods: they represented 70% of customs
seizures of Swiss counterfeit products.
COUNTERFEITING, PIRACY AND THE SWISS ECONOMY © OECD 202124
Figure 2.7. Counterfeit goods infringing Swiss IP, by size of shipment, 2011-16
As a % of customs seizures Share of customs seizures
> 10 items
6 - 10 items 8%
6 - 10 items 4%
3% > 10 items
13%
2 - 5 items
2 - 5 items 18%
16%
1 item 1 item
68% 70%
Source: OECD customs seizures database.
COVID-19 and fake “Swiss made”
The COVID-19 pandemic has largely reshaped the dynamics of routes of illicit trade, including illicit trade
in counterfeit “Swiss made” goods. Consequently, some short-term impacts have been already identified
in a set of discussions with enforcement officials and industry delegates. Other lasting results on
counterfeiting are expected to emerge gradually.
As for the short-term effects, trade and enforcement experts highlight that the pandemics has intensified
existing problems and, in terms of volumes, there are some modest effects. Experts also point at several
COVID-19-related factors that have shaped the landscape of illicit trade for fake “Swiss made” products,
such as changing trade routes and distorted supply chains.
Criminal networks have reacted very quickly to the crisis and adapted their strategies to take advantage of
the shifting landscape. In many cases, criminals have foreseen the disruptions of some transport routes
and managed their operations accordingly, for example intensifying supply through small parcels on those
routes where traffic remained open. For example, in the initial stage of the pandemics, Asian countries
were locked down and, consequently, traditional trade routes from Asia to Europe and the US have
experienced disruptions. At that same time, enforcement reported unusual activity of traffickers abusing
new routes, for example through some African and Latin American countries. This was also the case of
fake “Swiss made” products that kept flooding Europe and the US through remaining trade channels.
The dynamic behaviour of criminals running illicit trade networks results in a substantial shift towards
further misuse of the online environment. According to law enforcement authorities, in OECD countries
including Switzerland, e-commerce has become a predominant medium to send counterfeit products to
consumers, as during confinements, people turn to online markets to fulfil their needs. The online boom
also resulted in a considerable growth of new online marketplaces and online platforms offering fake goods.
In addition to online shops, criminals abuse other online channels of communication, for example, social
media platforms or communicators, such as WhatsApp or Facebook Messenger.
In all these channels, there is robust observable growth in the online supply of fake “Swiss made” goods.
This includes watches, products of the mechanical, electrical engineering and metalworking (MEM)
industry, fast-moving consumer goods (FMCG) and pharmaceuticals. It occurs on all types of online
platforms, including those that used to be relatively free from this risk before the COVID-19 crisis. For
example, in 2020, the Federation of the Swiss Watch Industry’s (FH) Internet Enforcement Team closed
more than 1.2 million offers for fake watches on numerous Internet sales platforms.
COUNTERFEITING, PIRACY AND THE SWISS ECONOMY © OECD 2021 25 Finally, due to the pandemic, the demand for pharmaceuticals and personal protective equipment (PPE, for example masks, safety glasses, protective clothing) grew sharply. Very strong demand for these products was met with a strong and diverse reaction for counterfeiters. To improve the appearance of the fake PPE, criminals abuse existing trademarks of trusted Swiss companies and put their brands on fake PPE. This is often the case even when a given Swiss firm does not produce PPE of this particular kind. This clearly illustrates the free-riding of counterfeiters on the goodwill established by Swiss FMCG companies and trust that consumers associate with their brands. In addition to the PPE, criminals also supply counterfeit, substandard equipment to produce PPE or spare machine parts, which in all cases infringe the IP rights of Swiss companies. At the same time, COVID-19 also resulted in changes in customs control priorities (e.g. focus on COVID-19-related products) and labour shortages among law enforcement officials. Unfortunately, these factors reduce enforcement efforts to counter illicit trade in many counterfeit products, The industry continues to combat this scourge actively through many channels. For example, some industry associations offer online training for enforcement authorities to assist them with COVID-19 challenges. Box 2.1. Stop Piracy Stop Piracy is a public-private initiative established to raise awareness and counter IP infringements. It brings together Swiss public authorities and representatives of the Swiss industry. The initiative raises awareness by providing targeted educational consumer campaigns, e.g. before Christmas or Black Friday, highlighting the risk of counterfeits in a factual and objective way. It also provides a platform for dialogue and co-ordination between delegates from the Swiss federal administration (e.g. the Intellectual Property Institute or Swiss Federal Customs Administration) and Swiss industry delegates. Source: https://www.stop-piracy.ch/ Another example of a public-private partnership to counter the threat of counterfeiting aimed at Swiss products is the Stop Piracy initiative (see Box 2.1.). This initiative was established before the pandemic for co-ordination and as awareness-raising. During the COVID-19 crisis, Stop Piracy continued its activities, raising awareness about the scourge of counterfeiting. The value of trade in fake Swiss goods So far, the analysis has relied on descriptive statistics of customs seizures of counterfeit products that infringe Swiss IPRs. The following section is based on econometric analysis and aims at assessing the value of fake Swiss goods as well as determining the shares of primary and secondary markets for counterfeit goods infringing Swiss IPRs. As explained in Annex A, applying the General Trade-Related Index of Counterfeiting for economies (GTRIC-e) and for products (GTRIC-p),3 as well as a fixed point to data on Swiss exports, allows the absolute values to be gauged for trade in counterfeit and pirated goods infringing the IPR owned by Swiss residents. The GTRIC-e and GTRIC-p indices offer an estimate of the probability of each product and trading partner being counterfeited. In the framework of this study, the watches destined for European countries are likely to have the highest probability of being counterfeited relative to other product category- destination couples. To estimate the value of fake trade infringing Swiss IPRs, the share of counterfeit goods in total exports in a selected product category from a given trade partner has to be known. We call COUNTERFEITING, PIRACY AND THE SWISS ECONOMY © OECD 2021
26
this percentage the “fixed point”. Based on customs expertise, the fixed point has been established at 27%
for Harmonised System (HS) code 64 (footwear) from China, which is the product-provenance couple most
likely to be counterfeited. This fixed point has to be considered as the upper limit of counterfeit trade. We
also carried out additional checks to verify if this fixed point was robust. To do so, the empirical application
was based on 3 scenarios, with selected values of 10%, 15% and 20%. Note that all of these scenarios
take much more conservative values of fixed points than the actual fixed points applied to imports in
OECD/EUIPO reports (2016[7]; 2019[11]). For other product-provenance couples, a more conservative fixed
point is used; for product-provenance couples other than footwear from China, these fixed points are
applied. In the text, these fixed points are named “ceiling values”.
Thus, the fixed point is basically multiplied by the relative likelihood included in the GTRIC matrix to obtain
the share of exports of counterfeit products infringing Swiss IPRs. Applying these shares to statistics on
the value of Swiss exports gives the estimated value of goods infringing Swiss IPRs by product category
and destination economy.
Table 2.1 reports the estimated value of global trade in counterfeit products infringing Swiss trademarks
and patents for 2016-19 for these three alternative ceiling values. The best estimates, based on the data
provided by customs authorities worldwide and on the GTRIC methodology, indicate that global trade in
counterfeit and pirated products infringing Swiss trademarks and patents amounted to as much as
CHF 6.97 billion (USD 7 billion) in 2018, equivalent to 2.3% of Swiss genuine exports of goods. The value
of fakes varies from year to year and it reflects customs profiling procedure that may vary over time.
Table 2.1. Estimated value of global trade in counterfeit Swiss products, 2016-19
2016 2017 2018 2019
Value in Share of Value in Share of Value in Share of Value in Share of
USD genuine USD genuine USD genuine USD genuine
billion exports (%) billion exports (%) billion exports (%) billion exports (%)
Ceiling 5.40 1.8% 2.33 0.8% 7.02 2.3% 5.24 1.7%
value 20%
Ceiling 4.06 1.3% 1.75 0.6% 5.26 1.7% 3.93 1.3%
value 15%
Ceiling 2.71 0.9% 1.17 0.4% 3.51 1.1% 2.62 0.8%
value 10%
Note: The value for 2019 is still being refined.
In a previous report that focused on the Italian market (OECD, 2018[12]), the OECD indicated that the value
of global trade in counterfeit Italian products amounted to USD 35 billion in 2016, equivalent to 7.6% of
total Italian goods exports. The same OECD report dedicated to trade in counterfeit goods and the Swedish
economy (OECD, 2019[13]) estimated the value of global trade in counterfeit Swedish products at
USD 3.4 billion or 2.4% of Swedish goods exports.
It should be pointed out that the comparisons of the absolute values in fake trade have to be interpreted
carefully. Indeed, the infringed products differ from country to country. For Switzerland, the most infringed
product is mainly luxury watches while clothing and bearing is the most targeted product for Italy and
Sweden respectively. Such a difference has necessary consequences on the total values of global
counterfeiting trade infringing residents’ IPRs.
Figure 2.8 shows the estimated absolute value in global trade for the main counterfeit product categories.
The Swiss watchmaking industry remained by far the most targeted by counterfeiters over the 2017-19
period. The estimated value of fake Swiss watches accounted for CHF 3.35 billion (USD 3.37 billion) in
2018, which represented almost 50% of the total value of fake trade in counterfeit Swiss goods.
COUNTERFEITING, PIRACY AND THE SWISS ECONOMY © OECD 2021 27
In relative terms, clothing, footwear, leather and related products were again the most often counterfeited
type of products in 2018. The fake products in this category represented almost 17% of all export
categories. As in previous years, they were followed by watches and jewellery (10.2%) and food,
beverages and tobacco (5%).
Figure 2.8. Most faked Swiss product categories in global trade, 2018
In terms of value
Value of trade in Swiss fakes (US mn)
4000
3500
3000
2500
2000
1500
1000
500
0
Watches and Electrical household Machinery, industrial Clothing, footwear, Food, beverages Textiles and other Perfumery and Pharmaceutical and Household cultural Furniture, lighting
jewellery appliances, equipment; leather and related and tobacco intermediate cosmetics medicinal chemical and recreation equipment, carpets
electronic and computers and products products (e.g. products goods; including and other
telecommunications peripheral plastics; rubbers; toys and games, manufacturing n.e.c
equipment equipment; ships paper; wood) books and musical
and aircrafts instruments
Share of sector's genuine exports (%)
18%
16%
14%
12%
10%
8%
6%
4%
2%
0%
Clothing, footwear, Watches and jewellery Food, beverages and Textiles and other Electrical household Household cultural and Perfumery and cosmetics Machinery, industrial
leather and related tobacco intermediate products appliances, electronic and recreation goods; equipment; computers
products (e.g. plastics; rubbers; telecommunications including toys and games, and peripheral equipment;
paper; wood) equipment books and musical ships and aircrafts
instruments
The secondary market
We assume that there are at least two submarkets for counterfeit goods, the primary and secondary
markets. In the primary market, consumers do not know that they are buying fakes, whereas, in the
secondary market, consumers knowingly buy fakes. The two markets are characterised by price
differences. The primary market’s prices are expected to be close to genuine goods while the secondary
market’s prices are expected to be lower. To determine the share of both markets, we analysed the unit
values of fake goods that we consider to be proxies for retail prices (for more detailed information, see
Annex A.1)
In terms of consumer deception, the analysis shows that, in 2016, 47.7% of Swiss fakes traded worldwide
were sold on the primary market, i.e. they were sold to consumers who did not know they were buying fake
products. Conversely, 52.3% of the Swiss counterfeit goods traded worldwide were sold on the secondary
market, i.e. they were sold to consumers who knowingly buy fakes.
COUNTERFEITING, PIRACY AND THE SWISS ECONOMY © OECD 202128
Over the 2017-19 period, the share of secondary markets is quite similar as in 2011-16 (see Table 2.2.).
Indeed, 54.1% of counterfeit goods infringing Swiss IP were sold on the secondary market versus 52.3%
over the 2011-16 period. The share of the secondary market varies considerably from one sector to
another, ranging from almost 65% for the machinery, industrial equipment, computer and peripheral
equipment, ships and aircraft sector to 16.7% for the furniture, lighting equipment, carpets and other
manufacturing sectors. These results are quite logical since the share of the secondary market (i.e. the
share of consumers who knowingly bought fakes) is lower for products that might directly damage health
such as foodstuffs or cosmetics.
Table 2.2. Share of secondary markets for counterfeit Swiss products, 2017-19
Sector Share of secondary
market (%)
Electrical household appliances, electronic and telecommunications equipment 49.5
Clothing, footwear, leather and related products 42.7
Household cultural and recreation goods; including toys and games, books and musical 37.5
instruments
Textiles and other intermediate products (e.g. plastics; rubbers; paper; wood) 34.2
Food, beverages and tobacco 32.7
Perfumery and cosmetics 26.5
Furniture, lighting equipment, carpets and other manufacturing n.e.c* 16.7
Total 54.1
Note: 54.1% of counterfeit goods infringing Swiss IP were sold to consumers who knew they were buying fake products.
* Not elsewhere classified.
Source: OECD customs seizures database
Once the primary and secondary markets have been determined, the rate of consumer deception can be
estimated. Consumers in the primary market, who unwittingly purchase fake Swiss goods, pay an
excessive price for a low-quality product, while consumers in the secondary market who knowingly
purchase fake products are prepared to accept any trade-off between cost and quality. As explained in
Annex A.6, the consumer detriment can be estimated by the difference between the average price on the
primary market and the average price on the secondary market, multiplied by the volume of fake goods
sold on the primary market.
The estimates of consumer detriment caused by Swiss IP infringement are presented in Table 2.3. One
should note that the consumer detriment will not only focus on Swiss consumers – as Switzerland is not
the main destination for counterfeit goods that infringe Swiss IP – but on all consumers located worldwide
that have bought fake Swiss goods. Apart from overpayment, consuming fake goods might be dangerous
for safety or health. However, this is outside the scope of this study, as are other impacts such as long-run
effects due to brand erosion or unemployment burden.
In 2018, the total consumer detriment due to trade in counterfeit goods infringing Swiss IPRs amounted to
CHF 1.98 billion (USD 2 billion). The consumer detriment of fake Swiss watches accounted for almost
CHF 1.79 billion (USD 1.8 billion) and was followed by the electrical household appliances and electronic
and telecommunication equipment CHF 140.2 million (USD 141 million) and clothing, footwear, leather
and related products CHF 127.2 million (USD 128 million).
COUNTERFEITING, PIRACY AND THE SWISS ECONOMY © OECD 2021 29
Table 2.3. Estimate of consumer detriment from counterfeit Swiss goods, 2018’
Sector USD mn
Clothing, footwear, leather and related products 128
Watches and jewellery 1790
Electrical household appliances, electronic and telecommunications equipment 141
Household cultural and recreation goods; including toys and games, books and musical instruments 9.4
Impacts on sales, jobs and government revenue
Following the methodology (steps 2 and 3) introduced in Chapter 1, the subsequent sections are dedicated
to assessing the impacts of Swiss IPR infringements on the Swiss economy.
Impact on sales in the Swiss manufacturing industry
In 2018, the total lost sales due to trade in counterfeit goods infringing Swiss IPRs amounted to
CHF 4.45 billion (USD 4.48 billion). The watch and jewellery sector experienced the highest losses in
absolute terms in 2018 and 2016 as well. In 2018, the sales losses of this industry amounted to
CHF 1.99 billion (USD 2 billion) while they were slightly lower in 2016 at CHF 1.65 billion
(USD 1.66 billion).
In relative terms, the clothing, footwear, leather and related products sector experienced the highest losses
(12.5% of sector’s exports) followed by the watches and jewellery (6.1%) and food, beverages and tobacco
(3.7%) sectors. In 2016, these three sectors were also the most impacted in relative terms. However, this
year the food, beverages and tobacco sector experienced the highest losses in relative terms (9% of
exports), followed by the clothing, footwear, leather and related products sector (8.1%) and the watch and
jewellery sector (5.5%) (see Table 2.4)
Table 2.4. Estimated lost sales for most targeted Swiss manufacturing industries, 2016 and 2018
2016 2018
Sales losses Share of Sales losses Share of
in USD million exports (%) in USD million exports (%)
Food, beverages and tobacco 799.5 9.0 355.4 3.7
Perfumery and cosmetics 56.9 1.9 109.0 2.9
Textiles and other intermediate products (e.g. 63.7 0.8 276.3 3.1
plastics; rubbers; paper; wood)
Clothing, footwear, leather and related products 221.6 8.1 541.7 12.5
Watches and jewellery 1 656.0 5.5 2 014.2 6.1
Electrical household appliances, electronic and 233.9 0.9 751.2 2.5
telecommunications equipment
Machinery, industrial equipment; computers and 130.7 0.5 417.5 1.5
peripheral equipment; ships and aircrafts
Household cultural and recreation goods; including 11.5 1.8 16.1 2.6
toys and games, books and musical instruments
Total sales losses 3 582.9 1.2 4 481.3 1.4
COUNTERFEITING, PIRACY AND THE SWISS ECONOMY © OECD 202130
Impact on jobs in the Swiss manufacturing industry
Lower sales in the manufacturing industry reduce the demand for labour and consequently lead to job
losses. Prior to calculating the job losses for the manufacturing industry, the sales elasticity of employment
was determined for each sector (see Table 1.2). These elasticities represent the extent to which each
sector adjusts employment in response to changes in sales. The number of job losses, as well as the share
of lost jobs within each sector, can be estimated by combining the industry-specific elasticities of
employment with the estimated lost sales detailed in the previous section.
Table 2.5 presents the main results for several sectors of the Swiss manufacturing industry.
In 2018, the total estimated job losses due to trade in counterfeit goods infringing Swiss IPRs amounted
to almost 11 000 people (or 1.7% of total Swiss manufacturing employment). Put it differently, these jobs
would have existed in the absence of counterfeiting and damaging impact on sales. Unsurprisingly, the
highest job losses due to counterfeiting were found in the watch and jewellery sector in absolute terms.
This sector experienced the highest loss with more than 3 700 employees. It was followed by the clothing,
footwear, leather and related products sector (around 1 600 people), and the textiles and other
intermediate products and the electrical household appliances, electronic and telecommunication
equipment sectors (around 1 500 people in each sector).
As a share of employees, the clothing, footwear, leather and related products sector and the watches and
jewellery sector are also the most hit by the trade in counterfeit goods infringing Swiss IPRs since losses
represented 22.7% and 6.7% of total sectors’ employees respectively.
Table 2.5. Estimated job losses in Swiss manufacturing sectors, 2018
Sector Jobs Share of employees*
losses (%)
Food, beverages and tobacco 1 054 1.2
Textiles and other intermediate products (e.g. plastics; rubbers; paper; wood) 1 452 1.5
Clothing, footwear, leather and related products 1 661 22.7
Watches and jewellery 3 786 6.7
Electrical household appliances, electronic and telecommunications equipment 1 477 2.0
Machinery, industrial equipment; computers and peripheral equipment; ships and 1 210 1.1
aircrafts
Household cultural and recreation goods; including toys and games, books and 18 1.0
musical instruments
Total manufacturing industry 10 659 1.7
* The share of employees is based on the number of employees in full-time equivalent positions as detailed in Eurostat’s Annual Detailed
Enterprise Statistics for Industry dataset, which may suffer from data shortage at the detailed level.
Impact on government revenue
Lower sales and lower profits for Swiss infringed rights holders mean they pay less CIT to the government.
Furthermore, fewer jobs imply lower PIT revenues and lower SSC. Finally, lower sales on the Swiss
domestic market reduce the VAT on consumption. However, one can note that only a tiny share of fake
Swiss goods is consumed in Switzerland, most of these fakes being purchased abroad. An estimation of
VAT losses is provided to illustrate what VAT losses could be at a country level. The foregone tax revenues
due to counterfeiting amounted to almost CHF 124.3 million (USD 126.2 million) in 2016. PIT and SSC
revenues experienced the highest loss at CHF 123.1 million (USD 125 million). If all the Swiss fakes were
bought in Switzerland, this would lead to a VAT loss of almost CHF 190.6 million (USD 193.5 million).
COUNTERFEITING, PIRACY AND THE SWISS ECONOMY © OECD 2021 31
In 2018, foregone revenues (labour income tax and CIT) due to infringement of Swiss IPRs amounted to
CHF 157.5 million (USD 158.4 million). It represented less than 0.2% of these 2 tax revenues (Table 2.6.).
If fake Swiss goods were bought in Switzerland, this would lead to CHF 263.4 million (USD 265 million) of
VAT losses.
The foregone taxes revenues are in line with the low taxation profile of Switzerland. Indeed, in 2016,
Switzerland ranked 29th out of 36th OECD member countries with a tax-to-gross domestic product (GDP)
ratio of 27.8%. In 2019, the Swiss tax-to-GDP ratio (28.5%) was still lower than the OECD average (33.8%
of GDP) according to OECD tax revenue statistics (OECD, 2020[14]). Nevertheless, the foregone CIT
revenues may be underestimated since the data on the Swiss manufacturing margin are incomplete.
Consequently, CIT losses must be interpreted carefully.
Table 2.6. Public revenue losses due to Swiss IPR infringements in global trade, 2018
Tax type Value in USD million Share of collected taxes (%)
PIT and SSC 157.8 0.26
CIT 0.555 0.002
Total 158.4 0.19
Note: PIT: Personal income tax; CIT: Corporate income tax; SSC: Social security contribution.
Due to margins data shortages, CIT losses are underestimated.
A similar exercise of quantifying the impacts of counterfeiting infringing residents’ IPRs was carried out by
the OECD for Italy, Sweden and the UK. These reports also rely on the same methodology developed in
Chapter 1 and Annex A of the present study. In relative terms, the Swiss economy experienced sales and
jobs losses lower than those of Italy. Indeed, the sales losses for the manufacturing industry due to
counterfeiting of their residents’ IPRs represented 3% of the Italian manufacturing industry’s sales and job
losses represented 2.3% of the total employees of the manufacturing industry. In terms of job losses, the
UK has been less hit by infringements of their residents’ IPR since job losses experienced by this country
represented 1.3% of their employees. The Swiss government revenue losses were lower than Italian ones
(1.8% of Italian collected taxes) due to its specific taxation profile while they were quite close to the UK
ones (0.31%).
These comparisons must be interpreted carefully since the estimated losses for the Swiss economy rely
on data that may suffer from shortages and are consequently underestimated.
COUNTERFEITING, PIRACY AND THE SWISS ECONOMY © OECD 202132
References
OECD (2020), Tax revenue (indicator), http://dx.doi.org/10.1787/d98b8cf5-en. [14]
OECD (2019), Counterfeiting and Piracy and the Swedish Economy: Making Sure “Made in [13]
Sweden” Always Is, Illicit Trade, OECD Publishing, Paris, https://doi.org/10.1787/eb300f5b-
en.
OECD (2018), Trade in Counterfeit Goods and the Italian Economy: Protecting Italy’s [12]
intellectual property, Illicit Trade, OECD Publishing, Paris,
https://doi.org/10.1787/9789264302426-en.
OECD/EUIPO (2019), Trends in Trade in Counterfeit and Pirated Goods, Illicit Trade, OECD [11]
Publishing, Paris, https://doi.org/10.1787/g2g9f533-en.
OECD/EUIPO (2017), Mapping the Real Routes of Trade in Fake Goods, OECD Publishing, [20]
Paris, https://doi.org/10.1787/9789264278349-en.
OECD/EUIPO (2016), Trade in Counterfeit and Pirated Goods: Mapping the Economic Impact, [7]
OECD Publishing, Paris, http://dx.doi.org/10.1787/9789264252653-en.
Notes
1
OECD/EUIPO (2017[20]); OECD/EUIPO (2019[11]).
2
Of course, many postal and express shipments arrive by air transport. However, customs offices in many economies
distinguish between express/courier seizures (no matter what mode of transport), postal (no matter what mode of
transport) and air transport (all seizures other than express and postal; for example, air cargo). However, for some
economies, in particular non-OECD economies, there is no precise information on seizures of express and postal
shipment; and all the seizures seem to be reported by the actual mode of transport.
3
The indices included in the GTRIC matrix calculate the likelihood that a given type of counterfeit product of a brand
or patent registered in Switzerland will be sold in a given destination economy.
COUNTERFEITING, PIRACY AND THE SWISS ECONOMY © OECD 2021From:
Counterfeiting, Piracy and the Swiss Economy
Access the complete publication at:
https://doi.org/10.1787/1f010fc9-en
Please cite this chapter as:
OECD (2021), “An overview of global counterfeiting and the Swiss economy”, in Counterfeiting, Piracy and
the Swiss Economy, OECD Publishing, Paris.
DOI: https://doi.org/10.1787/3a0d7b1f-en
This work is published under the responsibility of the Secretary-General of the OECD. The opinions expressed and arguments
employed herein do not necessarily reflect the official views of OECD member countries.
This document, as well as any data and map included herein, are without prejudice to the status of or sovereignty over any
territory, to the delimitation of international frontiers and boundaries and to the name of any territory, city or area. Extracts from
publications may be subject to additional disclaimers, which are set out in the complete version of the publication, available at
the link provided.
The use of this work, whether digital or print, is governed by the Terms and Conditions to be found at
http://www.oecd.org/termsandconditions.You can also read