Prediction of urine culture results by automated urinalysis with digital flow morphology analysis
←
→
Page content transcription
If your browser does not render page correctly, please read the page content below
www.nature.com/scientificreports
OPEN Prediction of urine culture
results by automated urinalysis
with digital flow morphology
analysis
Dokyun Kim1,2, Seoung Chul Oh1, Changseung Liu1,2,3, Yoonjung Kim1, Yongjung Park1* &
Seok Hoon Jeong1,2
To investigate the association between the results of urinalysis and those of concurrent urine cultures,
and to construct a prediction model for the results of urine culture. A total of 42,713 patients were
included in this study. Patients were divided into two independent groups including training and
test datasets. A novel prediction algorithm, designated the UTOPIA value, was constructed with the
training dataset, based on an association between the results of urinalysis and those of concurrent
urine culture. The diagnostic performance of the UTOPIA value was validated with the test dataset.
Six variables were selected for the equation of the UTOPIA value: age of higher UTI risk [odds ratio
(OR), 2.069125], female (OR, 1.400648), nitrite (per 1 grade; OR, 3.765457), leukocyte esterase (per 1
grade; OR, 1.701586), the number of WBCs (per 1 × 10⁶/L; OR, 1.000121), and the number of bacteria
(per 1 × 10⁶/L; OR, 1.004195). The UTOPIA value exhibited an area under the curve value of 0.837
when validated with the independent test dataset. The UTOPIA value displayed good diagnostic
performance for predicting urine culture results, which would help to reduce unnecessary culture.
Different cutoffs can be used according to the clinical indication.
Urinary tract infection (UTI) is the most common bacterial infection acquired in the community and in health-
care facilities. The prevalence of UTI is estimated to be 11% of the overall population, and almost half of adult
women suffer from UTI at least once in their lifetime1,2. Clinical manifestations of UTI are mostly mild; however,
the disease could develop serious complications, especially in certain high-risk populations including infants,
pregnant women, and aged population3. Therefore, early diagnosis and empirical antimicrobial treatment is
essential to improve clinical outcomes of patients with UTI4.
The gold standard for definitive diagnosis of UTI is detection of the pathogen by bacterial culture of a urine
specimen5, and an antimicrobial susceptibility profile can be obtained by testing clinical isolates. However,
urine culture is a time-consuming procedure, and the microbial spectrum of causative organisms in UTIs is
narrow. Therefore, routine cultures are often not necessary to manage patients with uncomplicated UTIs, and
only urinalysis either by test strip analysis and/or sediment analysis are recommended for the decision of patient
management6. Among the components of test strip analysis, leukocyte esterase (LE) and nitrite are commonly
used to diagnose UTI in routine clinical practices. Urine LE positive indicates pyuria, and urine nitrite positive
indicates the presence of nitrate-reducing bacteria. However, diagnostic performance of these tests is not suf-
ficiently high to be used alone due to limitations of the test principle7.
Test strip analysis is traditionally done by the dipstick based on physicochemical reactions, and the results
are interpreted using a reflectometer. Automated urinalysis systems including sample preparation, aliquot, and
reading have been introduced to improve test throughput and efficiency and to reduce labor and time. In addition,
microscopic examination of urine sediment is also widely used to diagnose urinary tract diseases by identify-
ing various types of cells, casts, and crystals in a urine sample. However, manual microscopic examination is a
time-consuming procedure and requires expertise to maintain consistency of the result interpretation. Recently,
different types of automated urine sediment analysis systems have been introduced. Among them, the iQ200
(Beckman Coulter Inc., Brea, CA, US) is an automated digital imaging-based system that uses flow morphology
1
Department of Laboratory Medicine, Gangnam Severance Hospital, Yonsei University College of Medicine, 211
Eonju‑ro Gangnam‑gu, Seoul 06273, South Korea. 2Research Institute of Bacterial Resistance, Yonsei University
College of Medicine, Seoul, South Korea. 3Department of Laboratory Medicine, School of Medicine, Kangwon
National University, Chuncheon, South Korea. *email: YPARK119@yuhs.ac
Scientific Reports | (2021) 11:6033 | https://doi.org/10.1038/s41598-021-85404-1 1
Vol.:(0123456789)www.nature.com/scientificreports/
Urine culture-no growth or
contamination Urine culture-positive Total
Variablea 35,421 (82.9%) 7292 (17.1%) P-value 42,713 (100.0%)
Age (year) 55 (24–69) 58 (19–74) < 0.0001 56 (24–70)
Age group with high risk for UTI 12,636 (35.7%) 3883 (53.3%) < 0.0001 16,519 (38.7%)
Male 19,171 (54.1%) 2464 (33.8%) < 0.0001 21,635 (50.7%)
Hospitalization 24,901 (70.3%) 5135 (70.4%) 0.8388 30,036 (70.3%)
Difference in reception time between uri-
0.3 (0.1–18.2) 0.3 (0.1–22.9) 0.5109 0.3 (0.1–19.1)
nalysis and urine culture (minute)
Time to report results of urinalysis (minute) 23.0 (16.0–33.7) 23.5 (16.3–34.7) < 0.0017 23.1 (16.1–33.8)
Difference in report time between urinalysis
36.8 (22.8–56.5) 60.6 (45.5–82.4) < 0.0001 39.8 (23.7–62.7)
and urine culture (hour)
Time to report results of urine culture
36.7 (23.0–56.2) 60.6 (45.6–82.5) < 0.0001 39.8 (23.9–62.6)
(hour)
Test strip analysis
Specific gravity 1.015 (1.010–1.021) 1.013 (1.008–1.018) < 0.0001 1.015 (1.009–1.021)
pH 6.0 (5.0–6.5) 6.0 (5.5–7.0) < 0.0001 6.0 (5.0–6.5)
Protein Trace (Negative–Trace) Trace (Negative–1 +) < 0.0001 Trace (Negative–1 +)
Glucose Negative (Negative–Negative) Negative (Negative–Negative) 0.1894 Negative (Negative–Negative)
Blood/red blood cell Negative (Negative–Trace) Trace (Negative–1 +) < 0.0001 Negative (Negative–Trace)
Nitrite Negative (Negative–Negative) Negative (Negative–1 +) < 0.0001 Negative (Negative–Negative)
Leukocyte esterase Negative (Negative–Negative) 2 + (Negative–3 +) < 0.0001 Negative (Negative–1 +)
Digital flow morphology analysis (× 106/L)
Red blood cell 5 (2–14) 12 (3–53) < 0.0001 5 (2–18)
White blood cell 6 (2–16) 76 (9–573) < 0.0001 7 (3–26)
Epithelial cell 1 (0–3) 2 (0–7) < 0.0001 1 (0–4)
Cast 0 (0–0) 0 (0–0) < 0.0001 0 (0–0)
Bacteria 0 (0–1) 2 (0–13) < 0.0001 0 (0–1)
Urine culture results No growth, 23,454 (66.2%) Single pathogen, 6506 (89.2%)
Single pathogen with possible pathogen
Possible contamination, 8260 (23.3%)
below the threshold, 325 (4.5%)
Single possible pathogen below the thresh- Single pathogen with single normal flora,
old, 1894 (5.3%) 241 (3.3%)
Single normal flora, 1,259 (3.6%) Two pathogens, 220 (3.0%)
Miscellaneous, 554 (1.6%)
Table 1. Patient characteristics and results of urinalysis according to the urine culture results. UTI urinary
tract infection. a Categorical variables and continuous variables are presented by number (%) and median
(1st–3rd quartiles), respectively.
analysis to classify particles in a urine sample based on multiple parameters including size, shape, contrast, and
texture. This instrument has exhibited satisfactory analytical performance for the quantitation of red blood cells
(RBCs), white blood cells (WBCs), and epithelial cells compared with other automated sediment analysis systems
and manual microscopic m ethods8.
Here, we evaluated an association between the results of urinalysis obtained by the iRICELL system including
the iQ200 automated urine sediment analysis instrument with results of concurrent urine cultures. We also aimed
to construct a simple but practical prediction model for the positive urine culture with the results of urinalysis
including automated urine sediment analysis.
Results
Patient characteristics and urine culture results. The median (1st–3rd quartiles) age of the 42,713
patients was 56 (24–69), and 38.7% (n = 16,519) of the patients were included in the high-risk age group (Table 1).
Almost half (50.7%, n = 21,635) of the subjects were male, and two thirds (70.3%, n = 30,036) of the subjects were
hospitalized patients. The median (1st–3rd quartiles) difference in reception time between urinalysis and urine
culture was 0.3 (0.1–19.1) minutes, and the median difference in report time was 39.8 (23.7–62.7) hours. The
results of urine culture were positive for 17.1% (n = 7292) of the patients, and 89.2% (n = 6506) of these were
positive with a single pathogen, 4.5% (n = 325) with a single pathogen and a possible pathogen below the thresh-
old, 3.3% (n = 220) with a single pathogen and a single normal flora, and 3.0% (n = 220) with two pathogens. The
most common pathogen isolated in this study was Escherichia coli (54.9%, n = 4121 among 7512) followed by
Enterococcus faecalis (11.7%, n = 878), Klebsiella pneumoniae (6.5%, n = 491), and Enterococcus faecium (5.3%,
n = 400) (Supplementary Table 1). Patients in the urine culture-positive group exhibited a significantly higher
Scientific Reports | (2021) 11:6033 | https://doi.org/10.1038/s41598-021-85404-1 2
Vol:.(1234567890)www.nature.com/scientificreports/
Factor Odds ratio (95% confidence interval) P value
Age of higher risk 1.967 (1.848–2.095) < 0.0001
Female 1.483 (1.389–1.584) < 0.0001
Hospitalized patient 1.174 (1.096–1.259) < 0.0001
Test strip analysis
SG (per 0.001 increase) 0.979 (1.025–1.098) < 0.0001
pH (per 1.0 increase) 1.061 (1.025–1.098) 0.0007
Protein (per 1 grade increase) 0.979 (0.918–1.043) 0.5127
Glucose (per 1 grade increase) 1.021 (0.984–1.06) 0.2675
Blood (per 1 grade increase) 0.935 (0.894–0.978) 0.0035
Nitrite (per 1 grade increase) 3.952 (3.679–4.246) < 0.0001
Leukocyte esterase (per 1 grade increase) 1.736 (1.691–1.782) < 0.0001
Digital flow morphology analysis
RBC (per 1 × 10⁶/L increase) 1.000 (1.000–1.000)a < 0.0001
6
WBC (per 1 × 10 /L increase) 1.000 (1.000–1.000)b < 0.0001
Epithelial cell (per 1 × 10⁶/L increase) 0.996 (0.995–0.998) < 0.0001
Cast (per 1 × 10⁶/L increase) 1.001 (0.994–1.008) 0.7592
Bacteria (per 1 × 10⁶/L increase) 1.006 (1.005–1.007) < 0.0001
Table 2. The results of multivariate analysis by logistic regression for the prediction of positive urine culture
with 42,713 patients. a 1.000028 (1.000015–1.000041). b 1.000115 (1.000086–1.000145).
proportion of high-risk age group (53.3% vs 35.7%, P < 0.0001) and lower proportion of males (33.8% vs 54.1%,
P < 0.0001) than the urine culture-no growth or contamination group (Table 1 and Supplementary Table 2).
The results of urinalysis according to the culture results. The results of test strip and sediment anal-
yses according to the urine culture results are summarized in Table 1. Except for urine glucose, all parameters
were significantly different between the two groups. By the multivariate binary logistic regression, three patient
factors including high-risk age [odds ratio (OR), 1.967], female (OR, 1.483), and hospitalization (OR, 1.174)
were significantly associated with positive results of the urine culture (P < 0.0001 for each) (Table 2). Among the
test strip results, pH (OR, 1.061 per 1.0 increase; P = 0.0007), nitrite (OR, 3.952 per 1 grade increase; P < 0.0001),
and LE (OR, 1.736 per 1 grade increase; P < 0.0001) were independent risk factors for positive urine culture.
Among the parameters of automated sediment analysis, the numbers of RBCs (OR, 1.000 per 1 × 10⁶/L increase),
WBCs (OR, 1.000 per 1 × 10⁶/L increase), epithelial cells (OR, 1.001 per 1 × 10⁶/L increase), and bacteria (OR,
1.006 per 1 × 10⁶/L increase) showed significant associations with positive results of the urine culture (P < 0.0001
for each).
Among the variables exhibiting significant associations with positive urine culture, six variables including
age of higher risk (OR, 2.069125), female (OR, 1.400648), nitrite (OR, 3.765457 per 1 grade increase), LE (OR,
1.701586 per 1 grade increase), the number of WBCs (OR, 1.000121 per 1 × 10⁶/L increase), and the number
of bacteria (OR, 1.004195 per 1 × 10⁶/L increase) were selected considering the effect size of each variable by
multivariable binary logistic regression in the training dataset with 21,522 patients (P < 0.0001 for all variables;
Supplementary Table 3). An equation to predict urine culture results was constructed with the constant and
coefficients of independently significant variables as follows:
1
UTOPIA value = ×100
1 + e(2.803456−0.727126x1−0.336935x2−1.325869x3−0.531561x4−0.000121x5−0.004186x6)
where,
• x1 = 1, if a **patient is at high-risk age (≤ 1 or ≥ 70 years old), otherwise x1 = 0
• x2 = 1 for female; x2 = 0 for male
• x3 = grade of nitrite by test strip analysis (0.5 when the result is trace or weak positive)
• x4 = grade of LE by test strip analysis (0.5 when the result is trace or weak positive)
• x5 = number of WBCs by digital flow morphology analysis (1 × 10⁶/L)
• x6 = number of bacteria by digital flow morphology analysis (1 × 10⁶/L).
Diagnostic performance of the UTOPIA value. To validate the diagnostic performance of the UTO-
PIA value for predicting results of urine culture, ROC curves were constructed with the independent test data-
set composed of 21,191 patients from different periods, and the AUC of the UTOPIA value was 0.837 (95%
CI = 0.829–0.845), which is significantly higher than that of nitrite (AUC = 0.645; 95% CI = 0.637–0.653), LE
(AUC = 0.758; 95% CI = 0.749–0.767), the number of bacteria (AUC = 0.753; 95% CI = 0.743–0.762), and the
Scientific Reports | (2021) 11:6033 | https://doi.org/10.1038/s41598-021-85404-1 3
Vol.:(0123456789)www.nature.com/scientificreports/
Diagnostic performance (95% CI) for the prediction of urine culture positive % Estimated culture reductiona/% false negativeb at a
results in the test dataset given culture positive prevalence of
Cutoff for
UTOPIA value Youden’s index Sensitivity Specificity PPVc NPVc 5.0% 10.0% 15.8%c 20.0% 25.0%
0.972 (0.966– 0.232 (0.226– 0.192 (0.191– 0.978 (0.973–
> 5.72 0.204 22.2/0.6 21.1/1.3 20.0/2.2 19.1/2.9 18.1/3.8
0.977) 0.238) 0.194) 0.982)
0.950 (0.942– 0.330 (0.323– 0.210 (0.208– 0.972 (0.968–
> 6.54 0.279 31.6/0.8 30.2/1.7 28.6/2.8 27.4/3.7 26.0/4.9
0.956) 0.337) 0.212) 0.976)
0.904 (0.893– 0.490 (0.482– 0.250 (0.246– 0.964 (0.961–
> 7.86 0.394 47.0/1.0 45.0/2.1 42.7/3.6 41.1/4.7 39.1/6.1
0.913) 0.497) 0.253) 0.968)
0.661 (0.644– 0.862 (0.857– 0.473 (0.462– 0.931 (0.928–
> 15.11 0.522 83.6/2.0 81.0/4.2 77.9/6.9 75.7/9.0 73.1/11.6
0.676) 0.867) 0.484) 0.934)
0.596 (0.579– 0.901 (0.897– 0.531 (0.518– 0.922 (0.919–
> 23.03 0.497 87.6/2.3 85.1/4.7 82.3/7.8 80.2/10.1 77.7/13.0
0.612) 0.905) 0.544) 0.925)
0.498 (0.481– 0.950 (0.947– 0.651 (0.635– 0.910 (0.907–
> 34.21 0.448 92.8/2.7 90.5/5.6 87.9/9.0 86.0/11.7 83.8/15.0
0.515) 0.953) 0.668) 0.912)
0.118 (0.107– 0.998 (0.997– 0.900 (0.868– 0.857 (0.856–
> 92.61 0.115 99.2/4.5 98.6/8.9 97.9/14.3 97.5/18.1 96.9/22.8
0.129) 0.998) 0.924) 0.859)
Table 3. Possible cutoffs and the utility of the UTOPIA value. CI confidence interval, PPV positive predictive
value, NPV negative predictive value. a Assuming that the UTOPIA values are determined to be negative based
on a given cutoff value and thus subsequent urine cultures are not carried out. b Proportion of cases with urine
culture positive results among subjects showing negative by the UTOPIA value, i.e., 1—NPV at a given cutoff
and culture positive prevalence. c The prevalence of positive urine culture in the test dataset was 15.8%.
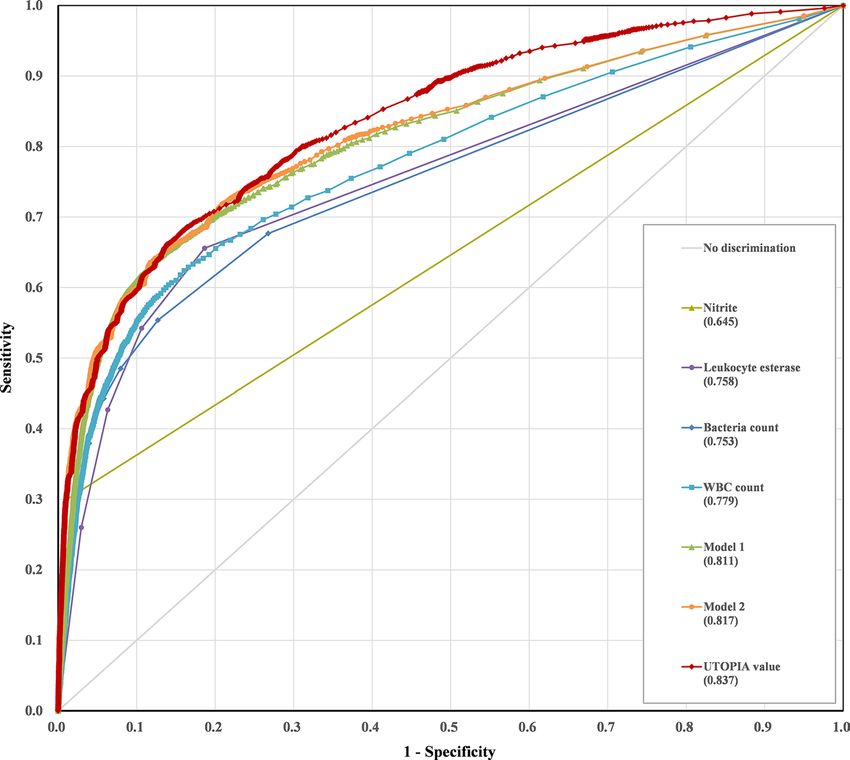
Figure 1. Receiver operating characteristics (ROC) curve analysis of the urinalysis in the prediction of urine
culture positive results in the test dataset. The area under the curve (AUC) of the model 2 (combination of
nitrite, leukocyte esterase, and WBC and bacteria counts) was higher than that of the model 1 (combination of
WBC and bacteria counts) (P = 0.0002), and the UTOPIA value showed the highest AUC value among those of
other tests (P < 0.0001).
Scientific Reports | (2021) 11:6033 | https://doi.org/10.1038/s41598-021-85404-1 4
Vol:.(1234567890)www.nature.com/scientificreports/
number of WBCs (AUC = 0.779; 95% CI = 0.769–0.789) (P < 0.0001 for all comparison, Fig. 1). In addition, the
UTOPIA value also exhibited higher AUC value than the other models including the Model 1 (AUC = 0.811;
95% CI = 0.802–0.820) which consisted of WBCs and bacteria counts by automated sediment analysis, and the
Model 2 (AUC = 0.817; 95% CI = 0.808–0.826) which was composed with LE, nitrite, and the variables of Model
1 (Fig. 1).
When using > 15.11 as a cutoff for the UTOPIA value, which showed the highest Youden’s index, the sensitiv-
ity, specificity, positive predictive value (PPV), and negative predictive value (NPV) were 0.661, 0.862, 0.473, and
0.931, respectively (Table 3). A cutoff value of > 6.54 exhibited sensitivity of 0.950 and specificity of 0.330, while
a cutoff value of > 34.21 showed specificity of 0.950 and sensitivity of 0.498.
Discussion
Microscopic examination of urine particle is a useful tool for diagnosing UTI, although the gold standard for
diagnosis is urine culture. To date, three different types of automated urine sediment analyzers have been intro-
duced. Sysmex UF-1000i (Sysmex Corporation, Kobe, Japan) utilizes the flow cytometric method. This analyzer
measures numbers of cells, bacteria, and casts by electrical impedance per flow sample volume, sizes the com-
ponents by forward light-scatter, and nuclear and cytoplasmic characteristics using fluorescent dye9. Another
instrument the cobas u701 (Roche Diagnostics International, Rotkreuz, Switzerland), which was first introduced
as UriSed (77 Elektronika, Budapest, Hungary)10, takes 15 microscopic images per urine sample prepared in
cuvettes that mimic glass slides used in manual microscopic examination, and the result images are analyzed
by particle recognition s oftware11. The iQ200 investigated in this study is an automated digital imaging-based
system that uses flow morphology analysis. In previous studies, the iQ200 system showed reliable performance
in counting RBCs, WBCs, and epithelial cells in terms of imprecision and linearity and showed good correlation
with manual microscopic sediment analysis and other automated a nalyzers8,12,13.
There have been several studies to evaluate possible associations between the results of microscopic urine
sediment examinations and those of urine culture. A meta-analysis for predicting positive urine culture by the
results from the Sysmex UF-1000i or UF-100 systems showed good sensitivity, using the number of WBCs
(pooled sensitivity, 0.87) and bacteria (pooled sensitivity, 0.92) counted by flow cytometry as indicators14. The
number of bacteria in urine specimens obtained by Accuri C6 (BD Biosciences, San Jose, CA, US) showed good
correlation with the results of urine culture when a cutoff value for urine culture positive was ≥ 105 CFU/mL15. A
recent interlaboratory study exhibited that the absence of microorganisms in the iQ200 screen was the strongest
solitary predictor for a negative culture result with a sensitivity of 90.5%, and higher sensitivity (95.2%) could
be obtained by the algorithm based on the presence of microorganisms and the number of W BCs16. Another
study with the iQ200 system exhibited an acceptable NPV of 97.7% and approximately 50% reduction of urine
culture when using WBC ≥ 4/HPF as a cutoff in predicting urine culture results, but the PPV was only 24.5% in
the same s tudy17. The scoring system suggested by Foudraine et al., which was composed of clinical symptoms
including dysuria and urgency and the number of WBCs obtained by the iQ200 analyzer, gave good diagnostic
performance with a high AUC value of 0.950 for predicting positive blood cultures18. However, the diagnostic
performance of a test could vary according to the characteristics and composition of cases and controls included
in each study, thus it would be difficult to directly compare diagnostic performance among the studies. In addi-
tion, the definition of significant growth in urine culture in each study was different, thus it is also difficult to
generalize the diagnostic performance of a test in the literature.
The UTOPIA value was designed to predict the positive urine culture with the variables including demo-
graphic conditions including age of higher risk for UTI and sex, results of urinalysis including nitrite, LE, and the
numbers of WBCs and bacteria, and was validated with an independent dataset consisting of 21,191 patients in
a different time period from the subjects in the training dataset. The distribution of the prevalence of UTI along
with age was a J-shape with a higher frequency among the very young and a gradual increase with age, and the
prevalence was significantly higher for women than men, as previously described19. By simply adding these two
risk factors as variables of the prediction algorithm, the UTOPIA value exhibited better diagnostic performance
than the other models those are consisted of only the variables from urinalysis (Fig. 1). This work provides a
novel approach to predict the result of urine culture with the patients’ risk factors and the results of urinalysis.
In addition, the UTOPIA value was designed with easy-to use data in order to incorporate into a laboratory
information system easily, and thus can be automatically calculated immediately after urinalysis.
When validated with the independent test dataset, the UTOPIA value provided a good AUC value of 0.837
in the prediction of positive urine culture with high NPVs regardless of applied cutoffs. With the prevalence of
our dataset (15.8%), the NPV was 0.978 (95% CI = 0.973–0.982) when applying a cutoff for the UTOPIA value
of > 5.72, and 20.0% of total culture cases was estimated to be reduced at the expense of 2.2% of false negative
results, i.e. 1—NPV based on the UTOPIA value (Table 3). Since the prevalence of the urine culture positive
results can vary depending on factors such as the country, region, and patient age, appropriate cutoffs for the
UTOPIA value would need to be applied for each clinical laboratory. The cost of urine culture according to the
countries would be also considered. Using different cutoffs according to the allowable false negatives in each
laboratory, the UTOPIA value would be utilized to reduce unnecessary urine cultures. Meanwhile, the utility of
the UTOPIA value would be low if it is used for determining whether to start early empirical antibiotic treatment
before the culture results are reported. In this instance, PPV of the UTOPIA value was 0.900 even when applying
a high cutoff of > 92.61. Consequently, it can be applied to only 2.1% of the total patients because there would
be only small number of patients showing positive results by the UTOPIA value with that high cutoff, and there
would be false positive cases of 10.0%, i.e. 1—PPV, among the 2.1% of total patients as well.
In our data, the proportion of urine culture contamination cases was 28.0%, and they included in the con-
trol group to make a practical and accurate model for predicting the results of urine culture in actual clinical
Scientific Reports | (2021) 11:6033 | https://doi.org/10.1038/s41598-021-85404-1 5
Vol.:(0123456789)www.nature.com/scientificreports/
Figure 2. Study design and classification of cases. Solid lines indicate cases included in the analysis, while
dotted lines represent excluded subjects.
microbiology laboratories. In addition, the contamination group exhibited intermediate characteristics when
comparing with urine culture negative and positive groups (Supplementary Table 2). If contamination cases were
excluded from the regression model, the 1diagnostic performance of UTOPIA value would be over-estimated.
One limitation of our study is that it was performed with the retrospective design, and 19.1% of total cases
were excluded due to inaccurate quantitative results obtained by iQ200. Therefore, possible selection bias would
be considered when interpreting our results. However, a large number of patients was included to minimize
unpredictable bias and to enhance the statistical power with narrow CIs for the results in this study, and the
study population was divided into two independent datasets including training and test datasets to improve the
reliability and external validity of our results. Despite this effort, the validation of diagnostic performance of the
UTOPIA value in a single hospital would be another limitation of this study, even though the independent dataset
from a different time period was used in the validation. Multicenter evaluation for the diagnostic performance
of the UTOPIA value calculated by the equation in this study would be helpful in the generalized application
of the UTOPIA value. Additionally, we investigated the results from a single type of test strip analyzer and flow
morphology analyzer among several automated urinalysis systems each utilizing different test principles and
showing different semi-quantitative results for chemical parameters including LE. Separate prediction algorithms
according to the type of urinalysis systems could also be developed by applying a similar approach to our study.
In conclusion, we designed a novel prediction algorithm for urine culture results based on the results of
urine test strip analysis and digital flow morphology analysis, namely the UTOPIA value. The UTOPIA value
showed good diagnostic performance with possibility of reducing unnecessary urine culture and flexibility to
apply different cutoff values. This prediction algorithm can be used to predict urine culture results 1 to 3 days
before the culture results are reported, and also has the advantage of being easily incorporated electronically into
a laboratory information system. Further evaluation on the usefulness of the UTOPIA value in various clinical
settings should be considered.
Materials and methods
Study design and patients. From July 2015 to April 2020, a total of 62,656 patients were subjected to
urine cultures for suspected UTIs in a tertiary hospital in South Korea. Among them, 52,772 patients were sub-
jected to urinalyses within 6 h before or after urine culture, and 10,059 patients were excluded due to incomplete
or inaccurate automated urine sediment analysis results. Finally, 42,713 patients were enrolled in this study
(Fig. 2). Patients included in this study were divided into two datasets by the time of receipt: (1) a training dataset
with 21,522 patients: cases requested between July 2015 and December 2017, and (2) a test dataset with 21,191
Scientific Reports | (2021) 11:6033 | https://doi.org/10.1038/s41598-021-85404-1 6
Vol:.(1234567890)www.nature.com/scientificreports/
patients: cases requested between January 2018 and April 2020. This retrospective cross-sectional case–control
study, designated the UTOPIA study (Urinalysis-based Timely and On-the-spot Prediction of Infection Algo-
rithm), was designed to develop a simple and useful algorithm to predict urine culture results using results of
urinalysis. Patient characteristics including demographic information and type of admission were investigated
by reviewing electronic medical records. The protocol of this study was approved by the Institutional Review
Board of Gangnam Severance Hospital (Approval No. 3-2020-0169), and the requirement of an informed con-
sent of the participants was waived by the IRB. All methods used in this study were also performed in accordance
with the relevant guidelines and regulations.
Urine culture. The results of urine culture were retrieved from the electronic medical records. Urine culture
was performed according to the standard protocol of the local microbiology laboratory. Briefly, one microliter of
urine sample was inoculated on MacConkey agar and Blood agar, and the number of colonies was counted after
an 18-h incubation to calculate bacterial load. Bacterial identification was performed using a Matrix-Assisted
Laser Desorption Ionization Time-of-Flight Mass Spectrometer (MALDI-TOF MS). To make an accurate pre-
diction model for positive urine culture, the results of urine cultures were categorized into “Positive” and “No
growth or contamination”.
Automated urinalysis with digital flow morphology analysis. The results of test strip analysis and
sediment analysis by digital flow morphology analysis were retrieved from the electronic medical records. Auto-
mated urinalysis were performed using the iRICELL system (Beckman Coulter Inc., Brea, CA), which consisted
of the iChem VELOCITY urine chemistry analyzer and the iQ200 SPRINT urine microscopy analyzer, follow-
ing the manufacturer’s instructions. For the iQ200 instrument, approximately 1.3 mL of urine passes through
a flow cell, and a digital camera captures 500 images of magnified sample. Then, the Auto-particle Recognition
(APR) software (current version 7.1.4) interprets the captured images. The flow morphology interpretation with
flags for suspicious errors or abnormal results by the APR software were reviewed with on-screen images by
operators. Based on comprehensive consideration with on-screen images, previous urinalysis results of the same
patient, and the test strip results concurrently obtained by iChem, cases with discrepant interpretations between
operators and the analyzing software were subjected to manual microscopic sediment examination. If needed,
the results for these cases were corrected as the number of cells per high-power field by manual microscopic
examination, and were excluded from our study due to inaccurate quantitative values for RBCs, WBCs, and epi-
thelial cells by the iQ200 analyzer in those cases. During the study period, three quality control materials for the
iChem VELOCITY including IRISpec CA, CB, and CC (Beckman Coulter Inc.) and two materials for the iQ200
including iQ positive and negative controls (Beckman Coulter Inc.) were run every eight hours.
Definition. The high-risk age group for UTI was defined as patients younger than 2 years or older than
69 years considering high positive rates of urine culture according to national surveillance s tudy20 and positive
rates of urine culture according to age in our data. A positive urine culture was determined when a single uropath-
ogen (bacterial load ≥ 10,000 CFU/mL) or two uropathogens (bacterial load of each species ≥ 100,000 CFU/mL)
were recovered. Uropathogens include Gram-negative bacilli, Staphylococcus aureus, Candida species, Entero-
coccus species, and Aerococcus urinae, as previously described21. Cases with more than three species recovered
from urine culture were considered as contamination regardless of the quantity of bacterial g rowth21.
Statistical analysis. All statistical analyses were performed by Analyse-it for Microsoft Excel Method
Evaluation Edition version 5.65.3 (Analyse-it Software, Ltd., Leeds, UK) and IBM SPSS Statistics 25 (IBM Corp.,
Armonk, NY, US). Patient characteristics and the results of urinalysis according to the groups classified by the
urine culture results were compared with chi-square tests for categorical variables and Mann–Whitney U tests
for continuous variables. Binary logistic regression with the results of urine culture as the dependent variable
and those of urinalysis and patients’ characteristics as the multivariate independent variables was performed
to determine the coefficient for each independent variable in the regression model. With the regression model
equation, the UTOPIA value for each case in the test dataset was calculated to predict the probability for positive
urine culture, and diagnostic performance of the UTOPIA value for the prediction of urine culture results was
evaluated by calculating the area under the curve (AUC) value. All statistical analyses in this study were consid-
ered significant when the P value was < 0.05.
Received: 3 November 2020; Accepted: 26 February 2021
References
1. Medina, M. & Castillo-Pino, E. An introduction to the epidemiology and burden of urinary tract infections. Ther. Adv. Urol. 11,
1756287219832172 (2019).
2. Chu, C. M. & Lowder, J. L. Diagnosis and treatment of urinary tract infections across age groups. Am. J. Obstet. Gynecol. 219,
40–51 (2018).
3. Flores-Mireles, A. L., Walker, J. N., Caparon, M. & Hultgren, S. J. Urinary tract infections: epidemiology, mechanisms of infection
and treatment options. Nat. Rev. Microbiol. 13, 269–284 (2015).
4. Lee, S. S., Kim, Y. & Chung, D. R. Impact of discordant empirical therapy on outcome of community-acquired bacteremic acute
pyelonephritis. J. Infect. 62, 159–164 (2011).
Scientific Reports | (2021) 11:6033 | https://doi.org/10.1038/s41598-021-85404-1 7
Vol.:(0123456789)www.nature.com/scientificreports/
5. Kang, C. I. et al. Clinical practice guidelines for the antibiotic treatment of community-acquired urinary tract infections. Infect.
Chemother. 50, 67–100 (2018).
6. Meyrier, A. Sampling and evaluation of voided urine in the diagnosis of urinary tract infection in adults. in UpToDate (ed. Post,
T. W.) (2019).
7. Demilie, T., Beyene, G., Melaku, S. & Tsegaye, W. Diagnostic accuracy of rapid urine dipstick test to predict urinary tract infection
among pregnant women in Felege Hiwot Referral Hospital, Bahir Dar, North West Ethiopia. BMC Res. Notes 7, 481 (2014).
8. Linko, S. et al. Analytical performance of the Iris iQ200 automated urine microscopy analyzer. Clin. Chim. Acta Int. J. Clin. Chem.
372, 54–64 (2006).
9. Ben-Ezra, J., Bork, L. & McPherson, R. A. Evaluation of the Sysmex UF-100 automated urinalysis analyzer. Clin. Chem. 44, 92–95
(1998).
10. Zaman, Z. et al. Urine sediment analysis: Analytical and diagnostic performance of sediMAX—a new automated microscopy
image-based urine sediment analyser. Clin. Chim. Acta Int. J. Clin. Chem. 411, 147–154 (2010).
11. Wesarachkitti, B. et al. Performance evaluation and comparison of the fully automated urinalysis analyzers UX-2000 and Cobas
6500. Lab. Med. 47, 124–133 (2016).
12. Wah, D. T., Wises, P. K. & Butch, A. W. Analytic performance of the iQ200 automated urine microscopy analyzer and comparison
with manual counts using Fuchs-Rosenthal cell chambers. Am. J. Clin. Pathol. 123, 290–296 (2005).
13. Lamchiagdhase, P. et al. Urine sediment examination: a comparison between the manual method and the iQ200 automated urine
microscopy analyzer. Clin. Chim. Acta Int. J. Clin. Chem. 358, 167–174 (2005).
14. Shang, Y. J. et al. Systematic review and meta-analysis of flow cytometry in urinary tract infection screening. Clin. Chim. Acta Int.
J. Clin. Chem. 424, 90–95 (2013).
15. Moshaver, B. et al. Fast and accurate prediction of positive and negative urine cultures by flow cytometry. BMC Infect. Dis. 16, 211
(2016).
16. Russcher, A. et al. Interlaboratory collaboration for optimized screening for urinary tract infection. J. Clin. Microbiol. 54, 93–98
(2016).
17. Lee, J. M., Baek, D. J., Park, K. G., Han, E. & Park, Y. J. Clinical usefulness of iQ200/iChem Velocity workstation for screening of
urine culture. BMC Infect. Dis. 19, 531 (2019).
18. Foudraine, D. E. et al. Use of automated urine microscopy analysis in clinical diagnosis of urinary tract infection: defining an
optimal diagnostic score in an academic medical center population. J. Clin. Microbiol. https://doi.org/10.1128/JCM.02030-17
(2018).
19. Foxman, B. The epidemiology of urinary tract infection. Nat. Rev. Urol. 7, 653–660 (2010).
20. Lee, H. et al. Antimicrobial resistance of major clinical pathogens in South Korea, May 2016 to April 2017: first one-year report
from Kor-GLASS. Euro surveillance : bulletin Europeen sur les maladies transmissibles Eur. Commun. Dis. Bull. 23, 1. https://doi.
org/10.2807/1560-7917.ES.2018.23.42.1800047 (2018).
21. Leber, A. L. Clinical Microbiology Procedures Handbook (Wiley, Hoboken, 2016).
Author contributions
D.K.: writing-original draft and data analysis; S.C.O.: data collect and analysis; C.L.: data analysis; Y.K.: writing-
review and editing; Y.P.: conceptualization, supervision, data analysis, and writing-review and editing; S.H.J.:
conceptualization and supervision.
Competing interests
The authors declare no competing interests.
Additional information
Supplementary Information The online version contains supplementary material available at https://doi.
org/10.1038/s41598-021-85404-1.
Correspondence and requests for materials should be addressed to Y.P.
Reprints and permissions information is available at www.nature.com/reprints.
Publisher’s note Springer Nature remains neutral with regard to jurisdictional claims in published maps and
institutional affiliations.
Open Access This article is licensed under a Creative Commons Attribution 4.0 International
License, which permits use, sharing, adaptation, distribution and reproduction in any medium or
format, as long as you give appropriate credit to the original author(s) and the source, provide a link to the
Creative Commons licence, and indicate if changes were made. The images or other third party material in this
article are included in the article’s Creative Commons licence, unless indicated otherwise in a credit line to the
material. If material is not included in the article’s Creative Commons licence and your intended use is not
permitted by statutory regulation or exceeds the permitted use, you will need to obtain permission directly from
the copyright holder. To view a copy of this licence, visit http://creativecommons.org/licenses/by/4.0/.
© The Author(s) 2021
Scientific Reports | (2021) 11:6033 | https://doi.org/10.1038/s41598-021-85404-1 8
Vol:.(1234567890)You can also read