MONTHLY PROPERTY MARKET & ECONOMIC UPDATE - NEW ZEALAND FEBRUARY 2018 - CORELOGIC
←
→
Page content transcription
If your browser does not render page correctly, please read the page content below

Monthly Property Market
& Economic Update
New Zealand
February 2018

Contents
About CoreLogic                                                                                                                                                                                                                      4
       CoreLogic Data and Analytics ..................................................................................................................................................................                               4
       Legal Disclaimer .............................................................................................................................................................................................                4

Macro Economic and Demographic Indicators                                                                                                                                                                                            6
       New Zealand Asset Classes .......................................................................................................................................................................                             7
       New Zealand Population .............................................................................................................................................................................                          8
       Migration ...........................................................................................................................................................................................................         9
       Regional Building Consents .......................................................................................................................................................................                           10
       Population Growth Compared to Building Consents ......................................................................................................................                                                       10
       Consumer Confidence .................................................................................................................................................................................                         11
       Employment ....................................................................................................................................................................................................              12
       Interest Rates ..................................................................................................................................................................................................            13

Housing Overview                                                                                                                                                                                                                    14
       Nationwide Values .........................................................................................................................................................................................                  15
       Sales Volumes .................................................................................................................................................................................................              16
       Rent .....................................................................................................................................................................................................................   17
       Market Activity ...............................................................................................................................................................................................              18
       Valuations Completed...................................................................................................................................................................................                      19
       Listings ...............................................................................................................................................................................................................     20
       Buyer Classification .......................................................................................................................................................................................                 22
       House Price Index ..........................................................................................................................................................................................                 23

Main Cities Housing Market Indicators                                                                                                                                                                                               26
       Auckland Market Activity ...........................................................................................................................................................................                         28
       Auckland Values .............................................................................................................................................................................................                29
       Auckland Suburb Value Change ..............................................................................................................................................................                                  30
       Current Auckland Suburb Values ............................................................................................................................................................                                  32
       Hamilton Market Activity ............................................................................................................................................................................                        34
       Hamilton Values ..............................................................................................................................................................................................               35
       Tauranga Market Activity ............................................................................................................................................................................                        36
       Tauranga Values .............................................................................................................................................................................................                37
       Wellington Market Activity .........................................................................................................................................................................                         38
       Wellington Values ..........................................................................................................................................................................................                 39
       Christchurch Market Activity .....................................................................................................................................................................                           40
       Christchurch Values ......................................................................................................................................................................................                   41
       Dunedin Market Activity ..............................................................................................................................................................................                       42
       Dunedin Values ...............................................................................................................................................................................................               43

                                                                                       CoreLogic Monthly Property Market & Economic Update New Zealand February 2018 | 2

  © Copyright 2018. CoreLogic and its licensors are the sole and exclusive owners of all rights, title and interest (including intellectual property rights) the CoreLogic Data contained in this publication.
                                                                                                                                                                                         All rights reserved.
About CoreLogic

CoreLogic is a leading property information,                                                               Whilst all reasonable effort is made to ensure
analytics and services provider in the                                                                     the information in this publication is current,
United States, Australia and New Zealand.                                                                  CoreLogic does not warrant the accuracy,
CoreLogic helps clients identify and manage                                                                currency or completeness of the data and
growth opportunities, improve performance                                                                  commentary contained in this publication
and mitigate risk, by providing clients with                                                               and to the full extent not prohibited by
innovative, technology-based services and                                                                  law excludes all loss or damage arising in
access to rich data and analytics.                                                                         connection with the data and commentary
                                                                                                           contained in this publication.

Contact
Call us 0800 355 355
Wellington office                                                                                          Auckland office
Level 2, 275 Cuba Street                                                                                   Level 5
PO Box 4072                                                                                                41 Shortland Street
Wellington 6140                                                                                            Auckland 1010

Email: reports@corelogic.co.nz

www.corelogic.co.nz

                                                                            CoreLogic Monthly Property Market & Economic Update New Zealand February 2018 | 3

   © Copyright 2018. CoreLogic and its licensors are the sole and exclusive owners of all rights, title and interest (including intellectual property rights) the CoreLogic Data contained in this publication.
                                                                                                                                                                                          All rights reserved.
CoreLogic Data and Analytics
CoreLogic Buyer Classification                                                                             Suburb scorecard
A unique and flagship product to CoreLogic, Buyer                                                          Detailed housing market indicators at suburb level,
Classification determines the type of buyer for every                                                      with data either in time series or current snapshot, and
purchase of property based on their current and previous                                                   segmented across houses, flats and apartments. The
ownership of NZ property. Created at a record level, this                                                  Suburb Scorecard data includes key housing market
can be matched to other datasets or summarised at any                                                      metrics such as median prices, median values, transaction
geographic area.                                                                                           volumes, rental statistics and market metrics such as
                                                                                                           median selling time.
Our buyer classification is used by financial institutions
and Government agencies at both record and summary
level and overlaid with their own data to assist strategic,                                                To view the latest report online and subscribe to
policy, compliance, risk management and marketing                                                          receive it in your inbox on a monthly basis, visit;
decisions.
                                                                                                           www.corelogic.co.nz/new-zealand-monthly-
                                                                                                           property-market-update
CoreLogic value measures
CoreLogic has a suite of products to measure property
prices. This ranges from simple market measurements                                                        If you would like to know more or obtain tailored
such as median or average sales prices through to                                                          data, analytics and insights for your business, please
stratified medians, various house price indices, and valuing                                               email us at reports@corelogic.co.nz.
groups of properties using Automated Valuation Models
such as E-valuer. The house price indices are available both
quarterly for completeness and monthly for reactivity.

The Quarterly CoreLogic House Price Index has been
specifically designed to track the value of a portfolio of
properties over time and is relied upon by New Zealand
regulators and industry as the most accurate measurement
of housing market performance. These value measures are
available for long time series and for either standard or
custom geographic areas and property types.

Legal Disclaimer
Copyright                                                                                                  Data & Research publications
This publication reproduces materials and content owned                                                    Whilst all reasonable effort is made to ensure the
or licenced by RP Data Pty Ltd trading as CoreLogic                                                        information in this publication is current, CoreLogic does
Asia Pacific (CoreLogic) and may include data, statistics,                                                 not warrant the accuracy, currency or completeness of
estimates, indices, photographs, maps, tools, calculators                                                  the Data and commentary contained in this publication
(including their outputs), commentary, reports and other                                                   and to the full extent not prohibited by law excludes all
information (CoreLogic Data).                                                                              loss or damage arising in connection with the Data and
                                                                                                           commentary contained in this publication.
© Copyright 2018. CoreLogic and its licensors are the
sole and exclusive owners of all rights, title and interest                                                You acknowledge and agree that CoreLogic does not
(including intellectual property rights) the CoreLogic Data                                                provide any investment, legal, financial or taxation
contained in this publication. All rights reserved.                                                        advice as to the suitability of any property and this
                                                                                                           publication should not be relied upon in lieu of appropriate
                                                                                                           professional advice.

 Published date: February 2018

                                                                            CoreLogic Monthly Property Market & Economic Update New Zealand February 2018 | 4

   © Copyright 2018. CoreLogic and its licensors are the sole and exclusive owners of all rights, title and interest (including intellectual property rights) the CoreLogic Data contained in this publication.
                                                                                                                                                                                          All rights reserved.
CoreLogic Monthly Property Market & Economic Update New Zealand February 2018 | 5

© Copyright 2018. CoreLogic and its licensors are the sole and exclusive owners of all rights, title and interest (including intellectual property rights) the CoreLogic Data contained in this publication.
                                                                                                                                                                                       All rights reserved.
Macro Economic and
Demographic Indicators

                                                                          CoreLogic Monthly Property Market & Economic Update New Zealand February 2018 | 6

 © Copyright 2018. CoreLogic and its licensors are the sole and exclusive owners of all rights, title and interest (including intellectual property rights) the CoreLogic Data contained in this publication.
                                                                                                                                                                                        All rights reserved.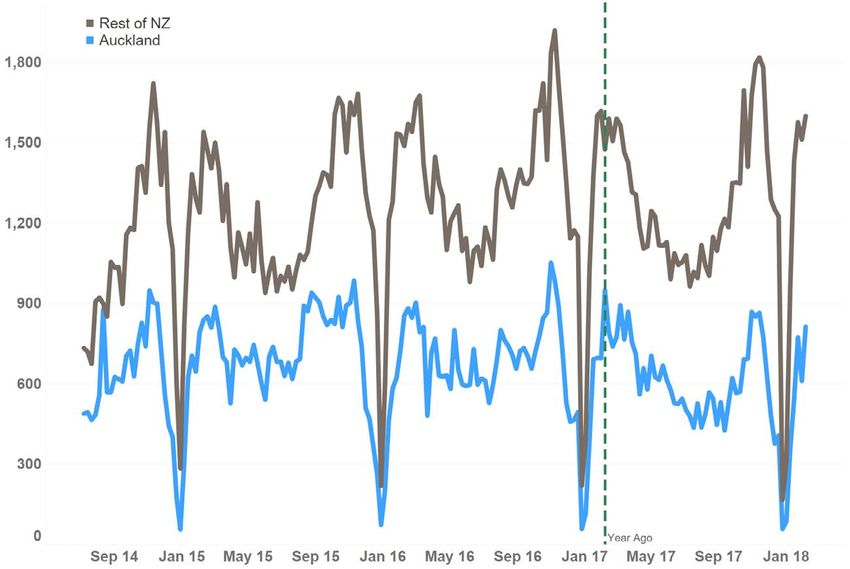
New Zealand Asset Classes

                                             Residential Real Estate

                                             $1.07          trillion
                                             ($247 billion in home loans)

                                             Commercial/Industrial Real Estate

                                             $201 billion

                                             NZ Listed Stocks

                                             $125 billion

                                             NZ Super and KiwiSaver

                                             $79 billion

The value of residential property continues to grow beyond one trillion dollars, outperforming the
value of other asset classes. Residential mortgages secured against 23% of this value.

Over the last month stocks worldwide experienced somewhat of a market correction with the NZX
dropping 3.6% from its early-January high but they have stabilised in mid-February.

                                                 *Source: CoreLogic NZ, Reserve Bank of NZ, NZX, NZ Superfund, Financial Markets Authority

                                                                           CoreLogic Monthly Property Market & Economic Update New Zealand February 2018 | 7

  © Copyright 2018. CoreLogic and its licensors are the sole and exclusive owners of all rights, title and interest (including intellectual property rights) the CoreLogic Data contained in this publication.
                                                                                                                                                                                         All rights reserved.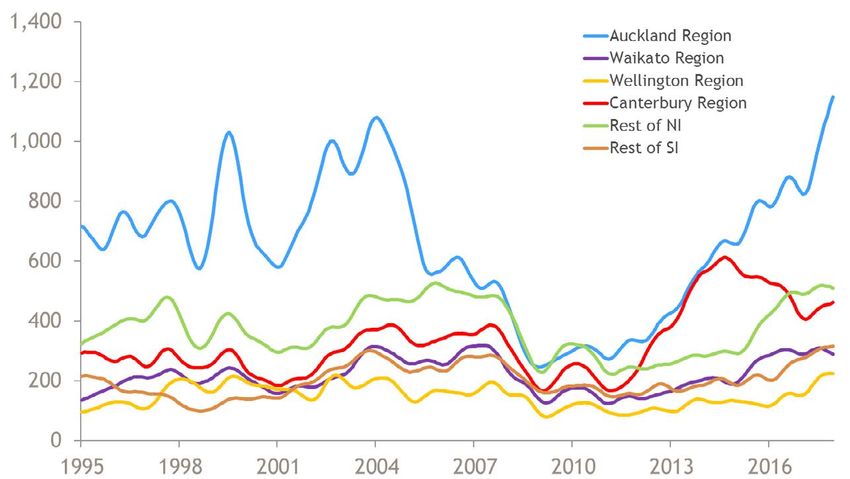
New Zealand Population
Quarterly Change in National Population

                                                                                                                                     Population growth slowed further in Q4
                                                                                                                                     2017, with the moving average continuing
                                                                                                                                     to trend down.

                                                                                                                                     Almost three-quarters of population
                                                                                                                                     growth is due to net migration, which
                                                                                                                                     was 70,000 for the year to the end of
                                                                                                                                     December 2017. This represents a further
                                                                                                                                     fall from the peak of 72,200 to the end of
                                                                                                                                     June 2017.

                                                                                                                                     After hitting a 20 year low, natural
                                                                                                                                     population growth rebounded in Q4 2017,
                                                                                                                                     but the overall trend is flat.

Population Change Composition

Annual Change in Population

                                                                                                                                                          Source: Statistics New Zealand

                                                                           CoreLogic Monthly Property Market & Economic Update New Zealand February 2018 | 8

  © Copyright 2018. CoreLogic and its licensors are the sole and exclusive owners of all rights, title and interest (including intellectual property rights) the CoreLogic Data contained in this publication.
                                                                                                                                                                                         All rights reserved.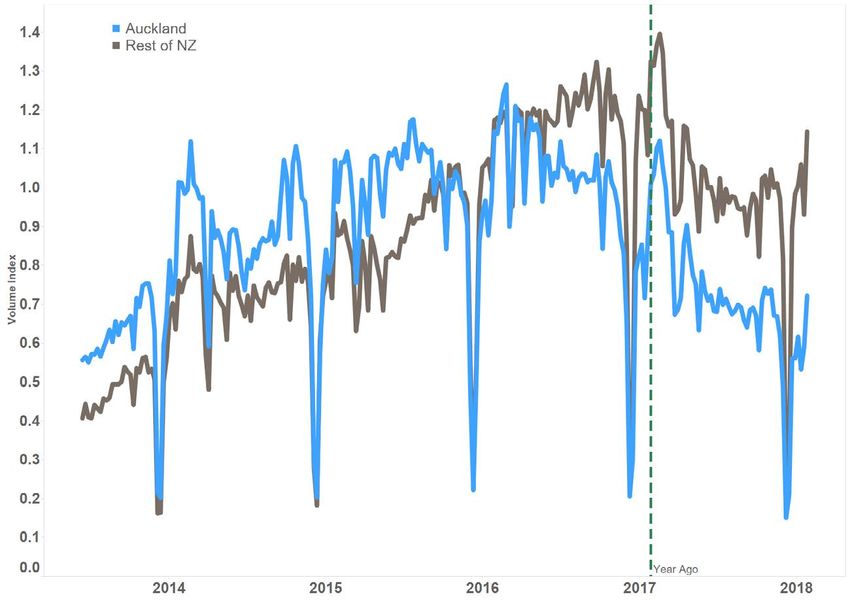
Migration
Long Term Migration
The trend of net migration effectively
plateaued for the last three months of
2017 as both arrivals and departures held
firm.
Immigration continues to be a hot topic
for the Government and the declining
trend in net migration is likely to continue.
This may not be as dramatic as previously
expected, due to the need of skilled labour
in an already tight market.
After a few months of net loss to Australia,
the stats veered back into the positives in
the final months of the year. The expected
strength in the Australian economy is
yet to have a significant impact on Kiwi
migrants yet, and while proposed changes
Monthly Net Migration Between New Zealand and Australia to remove the subsidised tertiary fees for
New Zealanders have now been scrapped,
there are still some concerns about the
visa status of New Zealanders in Australia
restricting them from access to certain
Government schemes.
In 2017, Dunedin saw a 23.7% increase
in net migration (from 2016): the largest
increase of all our main centres. Net
migration to Christchurch continues to
slowly decrease, after peaking in the year
to the end of March 2016.
Net Gain Last Year % Change
TOTAL ALL AREAS 70,016 -0.8%
Auckland Region 36,152 6.6%
Hamilton City 1,875 12.3%
Tauranga City 1,052 0.5%
Wellington 3,593 10.9%
Christchurch City 5,403 -4.0%
Dunedin City 1,024 23.7%
Main Urban Area (Other) 5,239 -5.9%
Rural Centres 4,798 8.6%
Not applicable/Not stated 10,880 -23.8%
Source: Statistics New Zealand
CoreLogic Monthly Property Market & Economic Update New Zealand February 2018 | 9
© Copyright 2018. CoreLogic and its licensors are the sole and exclusive owners of all rights, title and interest (including intellectual property rights) the CoreLogic Data contained in this publication.
All rights reserved.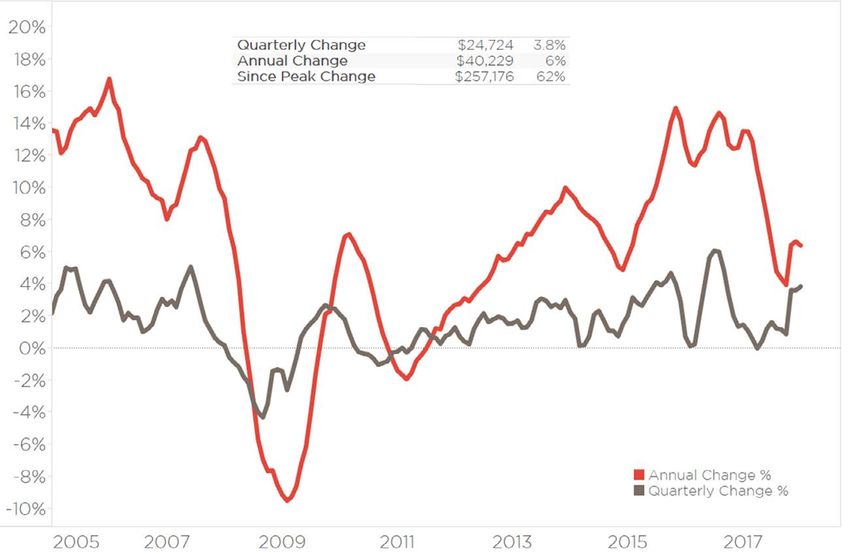
Regional Building Consents
New Dwelling Consents Trend

                                                                                                                                     Building consents issued in Auckland
                                                                                                                                     continues a strong upwards trend but
                                                                                                                                     there are consistent reports of the
                                                                                                                                     construction industry being very close to
                                                                                                                                     capacity.

                                                                                                                                     A recent Government commissioned
                                                                                                                                     ‘Stocktake’ report detailed three key
                                                                                                                                     barriers to housing supply: planning,
                                                                                                                                     infrastructure and the development sector.
                                                                                                                                     This foreshadows the Government’s
                                                                                                                                     challenge in implementing KiwiBuild: the
                                                                                                                                     commitment to delivering 100,000 quality
                                                                                                                                     affordable homes in the next ten years,
                                                                                                                                     half of which will be in Auckland.

                                                                                                                                     Elsewhere in NZ consents are now
                                                                                                                                     trending sideways as similar constraints
                                                                                                                                     affect other centres as well.

Population Growth Compared
to Building Consents
Quarterly Population Change and Building Consents Nationwide

                                                                                                                                     With population growth slowing and
                                                                                                                                     building consents continuing to increase,
                                                                                                                                     the gap between the two is reducing.

                                                                                                                                     The gap is calculated by assuming 80%
                                                                                                                                     of dwellings consented translate into an
                                                                                                                                     actual increase in the number of dwellings
                                                                                                                                     (which may be generous given our results
                                                                                                                                     of consent to stock change analysis), and
                                                                                                                                     that each of those dwellings will house
                                                                                                                                     the current average number of people (2.7
                                                                                                                                     people per dwelling).

                                                                                                                                     For example, over the year to December
                                                                                                                                     2017 there were 31,127 dwellings consented
                                                                                                                                     (able to house 67,234 people), and an
                                                                                                                                     increase in population of 97,000, leaving
                                                                                                                                     a difference of almost 30,000 too many
                                                                                                                                     people for dwellings.

                                                                                                                                                          Source: Statistics New Zealand

                                                                         CoreLogic Monthly Property Market & Economic Update New Zealand February 2018 | 10

  © Copyright 2018. CoreLogic and its licensors are the sole and exclusive owners of all rights, title and interest (including intellectual property rights) the CoreLogic Data contained in this publication.
                                                                                                                                                                                         All rights reserved.
Consumer Confidence
ANZ-Roy Morgan Confidence Consumer
Consumer confidence lifted in January
with people remaining happy with their
current financial situation.
Consumer perception of the economic
outlook also lifted, perhaps due to a ‘solid’
start for the Labour-NZ First Government
combining with a relatively stable housing
market and a strong labour market.
The gap in confidence between Australia
and NZ was significantly reduced in
December with the economic outlook in
Australia improving.
Source: ANZ NZ, Roy Morgan
Trans-Tasman Consumer Confidence Index
Source: Westpac NZ, McDermott Miller
CoreLogic Monthly Property Market & Economic Update New Zealand February 2018 | 11
© Copyright 2018. CoreLogic and its licensors are the sole and exclusive owners of all rights, title and interest (including intellectual property rights) the CoreLogic Data contained in this publication.
All rights reserved.Employment
Annual Change in Employment, Full Time and Part Time
The rate of part-time employment lifted
however the rate of growth in full-time
employment eased off for the fourth
quarter in a row (albeit only marginally
last quarter). The total number of people
actually employed has continued to rise.
The labour force participation rate eased
slightly to 71.0% in Q4 2017 after peaking
in Q3 2017 at 71.1% and the unemployment
rate dropped further to 4.5% - the lowest
since 2008.
For an employment lead significant
correction in the housing market to occur,
Labour Force Participation Rate there would have to be a turnaround in
employment with people unable to pay
mortgages or rent.
Unemployment Rate
Source: Statistics New Zealand
CoreLogic Monthly Property Market & Economic Update New Zealand February 2018 | 12
© Copyright 2018. CoreLogic and its licensors are the sole and exclusive owners of all rights, title and interest (including intellectual property rights) the CoreLogic Data contained in this publication.
All rights reserved.Interest Rates
Mortgage Interest Rates - %
Retail banks are competing strongly for
mortgages, with interest rates again taking
a noticeable dip in January.
The Official Cash Rate (OCR) remained
on hold in February and is projected to
remain below 2.00% until the end of 2019,
which is good news for new borrowers
and those coming off fixed rates.
The new loan-to-value ratio (LVR)
restrictions are now in place. They are only
a minor change from previous restrictions
with the deposit requirement for investors
dropping from 40% to 35% and the share
Projected Official Cash Rate - % of high LVR lending (above 80% LVR) to
owner occupiers increasing from 10% to
15%.
The expected impact on the market is
minimal, although it will contribute to
a small lift in demand from those who
were previously unable to satisfy the LVR
requirements.
Average Two Year Fixed Rates - %
Source: Reserve Bank of New Zealand
CoreLogic Monthly Property Market & Economic Update New Zealand February 2018 | 13
© Copyright 2018. CoreLogic and its licensors are the sole and exclusive owners of all rights, title and interest (including intellectual property rights) the CoreLogic Data contained in this publication.
All rights reserved.Housing Overview
CoreLogic Monthly Property Market & Economic Update New Zealand February 2018 | 14
© Copyright 2018. CoreLogic and its licensors are the sole and exclusive owners of all rights, title and interest (including intellectual property rights) the CoreLogic Data contained in this publication.
All rights reserved.Nationwide Values
Average Value of Housing Stock - New Zealand
Nationwide value growth moderated
over the summer holiday after a relatively
significant lift in November.
Three month value growth hit 3.8% at
the end of January. This was the fastest
rate for over a year, perhaps due to
post-election jitters calming and buyers
returning to the market - taking advantage
of still-low interest rates.
Annual and Quarterly Change in Value
CoreLogic Monthly Property Market & Economic Update New Zealand February 2018 | 15
© Copyright 2018. CoreLogic and its licensors are the sole and exclusive owners of all rights, title and interest (including intellectual property rights) the CoreLogic Data contained in this publication.
All rights reserved.Sales Volumes
Nationwide Sales Volumes
Sales volumes in December were flat year-
on-year, but January volumes were more
subdued (6% down year-on-year).
Once again sales volumes were very
weak in Auckland. High prices and a re-
balancing of demand/supply have reduced
the fear of missing out, and as a result
the ‘days to sell’ measure has begun to
lengthen.
Christchurch experienced a late-spring
and summer resurgence in sales volumes
with November, December and January all
up on the (admittedly weak) prior year.
Nationwide Annual Change in Sales Volumes
Regional Sales Volumes Year-on-Year
CoreLogic Monthly Property Market & Economic Update New Zealand February 2018 | 16
© Copyright 2018. CoreLogic and its licensors are the sole and exclusive owners of all rights, title and interest (including intellectual property rights) the CoreLogic Data contained in this publication.
All rights reserved.Rent
Nationwide Annual Change in Value and Rent
Annual rental growth stabilised at 4.9%
in December and January, illustrating a
similar trend to value growth after both
bottomed out in October 2017.
Gross rental yield continues to hover
along just over 3.0% (as it has done for 18
months+).
Christchurch rent continues to drop,
although the rate of -2.8% is not as great
as the drop witnessed through most of the
second half of 2017.
Meanwhile the growth in median rent in
Dunedin is now trending downwards after
peaking at greater than 10% growth in the
middle of 2017.
Tauranga’s annual rent increase of 12.1%
is slightly misleading because it’s being
compared to an anomaly of a month last
January. Actual annual change in Tauranga
Gross Rental Yield - Nationwide is realistically closer to 7%, which is still
rather high – similar to Wellington (7.6%),
where we’ve seen and heard plenty about
the rental squeeze in the nation’s capital.
Median Weekly Rent Annual Change in Rent Gross Yield
Auckland $511 4.7% 2.1%
Hamilton $365 7.4% 3.5%
Tauranga $436 12.1% 3.2%
Wellington $466 7.6% 3.2%
Christchurch $345 -2.8% 3.6%
Dunedin $340 -5.6% 4.5%
CoreLogic Monthly Property Market & Economic Update New Zealand February 2018 | 17
© Copyright 2018. CoreLogic and its licensors are the sole and exclusive owners of all rights, title and interest (including intellectual property rights) the CoreLogic Data contained in this publication.
All rights reserved.Market Activity
Market Activity Index
We’re still waiting for the market to
properly swing back into action, after
the prevalence of public holidays in
January and early February impacted
both demand and subsequent activity.
Nonetheless, relative to the same time last
year all major centres are experiencing
reduced activity, with Auckland the
farthest back.
Latest 3 Weeks Year-on-Year Percentage change
Auckland -29%
Hamilton City -6%
Tauranga City -5%
Wellington Region -19%
Christchurch City -19%
Dunedin City -11%
This market activity is based on the number of automated valuations run by bank staff using our systems each week. This
number of valuations correlates very closely to the number of sales that will subsequently occur so this is an extremely
timely measure of buyer demand, more than any measure of sales. We can also track across any geographic area.
CoreLogic Monthly Property Market & Economic Update New Zealand February 2018 | 18
© Copyright 2018. CoreLogic and its licensors are the sole and exclusive owners of all rights, title and interest (including intellectual property rights) the CoreLogic Data contained in this publication.
All rights reserved.Valuations completed
Market Activity Year-on-Year
This map shows activity in the latest three
weeks compared to the same three weeks
last year.
New Plymouth has picked up where it
finished last year with a sustained increase
in market activity, 24% up on the same
time last year. Elsewhere there are only
a handful of smaller districts across the
country experiencing a lift in activity.
*Size of bubble represents the level of activity for the period 29 January – 18 February 2018
CoreLogic Monthly Property Market & Economic Update New Zealand February 2018 | 19
© Copyright 2018. CoreLogic and its licensors are the sole and exclusive owners of all rights, title and interest (including intellectual property rights) the CoreLogic Data contained in this publication.
All rights reserved.Listings
New Listings
Similar to the demand measure of market
activity, the supply measure of new listings
takes a few weeks to get back to ‘normal’
levels as holiday makers drift back to
work.
The one month change measure is
effectively meaningless because it’s
comparing to Christmas-New Year period
(when listings are scarce). The one year
change however can be informative,
with Wellington listings relatively weak
and not doing much to alleviate already
constrained supply.
New Listings Average last 3 weeks 1 month change 1 year change
New Zealand 2,295 254% -2%
Auckland 732 334% -6%
Waikato 243 169% 4%
Bay of Plenty 156 186% -11%
Wellington 218 330% -12%
Canterbury 361 378% 2%
Otago 101 256% 16%
CoreLogic Monthly Property Market & Economic Update New Zealand February 2018 | 20
© Copyright 2018. CoreLogic and its licensors are the sole and exclusive owners of all rights, title and interest (including intellectual property rights) the CoreLogic Data contained in this publication.
All rights reserved.Total Listings
Total listings have begun to trend
upwards again in Auckland, with new
listings starting to lift and ‘days to sell’
lengthening.
The same is true around the rest of the
country but at a reduced rate. Wellington
continues to experience a significant
shortage, only 2% up on the prior year
(which was already a low point for that
time of the year).
Total Listings Latest week 1 month change 1 year change
New Zealand 29,147 4% 9%
Auckland 9,125 5% 23%
Waikato 3,063 4% 15%
Bay Of Plenty 2,092 3% 14%
Wellington 1,571 18% 2%
Canterbury 4,723 7% 8%
Otago 1,097 3% 9%
CoreLogic Monthly Property Market & Economic Update New Zealand February 2018 | 21
© Copyright 2018. CoreLogic and its licensors are the sole and exclusive owners of all rights, title and interest (including intellectual property rights) the CoreLogic Data contained in this publication.
All rights reserved.Buyer Classification
Buyer Classification - New Zealand
First home buyers finished 2017 strongly,
accounting for 22.2% of sales in the final
quarter of the year but haven’t started off
2018 quite so well, with 21.7% of sales in
January.
Movers have bounced back from their
Q4 2017 slump, while multiple property
owners remained consistent with 37.5%
of sales. We have previously noted the
reducing share of mortgaged multiple
property owners among this group but
they actually had a stronger month in
January: accounting for almost two-
thirds (66%) of multiple property owners
purchases (up from 62%), perhaps
benefitting from lower interest rates
enabling larger loans.
CoreLogic Monthly Property Market & Economic Update New Zealand February 2018 | 22
© Copyright 2018. CoreLogic and its licensors are the sole and exclusive owners of all rights, title and interest (including intellectual property rights) the CoreLogic Data contained in this publication.
All rights reserved.House Price Index
Average Dwelling Value
Values increased across most of the
country in January, with 3.8% growth
witnessed nationwide in the three months
to the end of January. Auckland values
continued a slight resurgence after
spending most of 2017 in gradual decline.
A similar trend is evident in Tauranga,
however values in Hamilton have remained
flat for almost six months.
Wellington has seen consistent value
growth over the same period after they
stalled briefly in winter last year.
The growth in values in Dunedin has been
more modest but consistent, with 9.3%
growth over the last 12 months.
January 2018
Current Value 3 months 12 months Since 2007 peak
New Zealand $671,531 3.8% 6.4% 62%
Auckland $1,054,974 1.6% 0.7% 93%
Hamilton $544,935 0.3% 2.6% 51%
Tauranga $698,875 1.7% 3.9% 45%
Wellington $634,811 4.0% 9.0% 39%
Christchurch $494,459 0.8% -0.6% 30%
Dunedin $392,512 2.6% 9.3% 37%
Source: CoreLogic NZ QV Monthly House Price Index
CoreLogic Monthly Property Market & Economic Update New Zealand February 2018 | 23
© Copyright 2018. CoreLogic and its licensors are the sole and exclusive owners of all rights, title and interest (including intellectual property rights) the CoreLogic Data contained in this publication.
All rights reserved.House Price Index
Annual Value Change
The greatest growth in values over the last
year has been in the districts of Hawke’s
Bay, Horowhenua and Masterton.
Much of Canterbury has seen little growth
over the last 12 months, with Timaru
and MacKenzie the exceptions. Further
south, the Southland District (main towns
Winton, Te Anau and Riverton) saw the
greatest growth in the year to the end of
January 2018.
*Size of bubble represents the number of properties in the Territorial Authority
CoreLogic Monthly Property Market & Economic Update New Zealand February 2018 | 24
© Copyright 2018. CoreLogic and its licensors are the sole and exclusive owners of all rights, title and interest (including intellectual property rights) the CoreLogic Data contained in this publication.
All rights reserved.Three Month Value Change
Three month value change by each of
the Council areas is patchier and shows
a few areas in the top half of the North
Island where values have decreased (blue
dots). These include Thames Coromandel,
Hauraki and Western BOP.
The greatest growth witnessed over this
period in the North Island is in Central
Hawke’s Bay at 8.0%.
Three month growth also remains very
high in the MacKenzie District, however it’s
always best to treat these smaller areas
(smaller dots) with caution due to fewer
sales occurring in these areas.
*Size of bubble represents the number of properties in the Territorial Authority
CoreLogic Monthly Property Market & Economic Update New Zealand February 2018 | 25
© Copyright 2018. CoreLogic and its licensors are the sole and exclusive owners of all rights, title and interest (including intellectual property rights) the CoreLogic Data contained in this publication.
All rights reserved.Main Cities Housing
Market Indicators
CoreLogic Monthly Property Market & Economic Update New Zealand February 2018 | 26
© Copyright 2018. CoreLogic and its licensors are the sole and exclusive owners of all rights, title and interest (including intellectual property rights) the CoreLogic Data contained in this publication.
All rights reserved.CoreLogic Monthly Property Market & Economic Update New Zealand February 2018 | 27
© Copyright 2018. CoreLogic and its licensors are the sole and exclusive owners of all rights, title and interest (including intellectual property rights) the CoreLogic Data contained in this publication.
All rights reserved.Auckland Market Activity
Buyer Demand - Auckland
Demand in Auckland has been very weak
so far this year, in part due to the number
of public holidays but this is not the sole
reason. The weakness in demand may be
a sign of further fatigue in the market. The
latest week (up to 18 February) did see a
lift but it’s too early to know if this will be
sustained.
Multiple property owners appear to
have found their new level in Auckland,
consistently accounting for around 40%
of sales. We must note that each quarter
between 25% and 33% of these are making
their purchase without a mortgage,
unaffected by LVRs or serviceability
criteria (and subsequently excluded from
RBNZ reporting).
First home buyers also remain consistently
active at around 23% of the market - we’ve
previously noted this groups’ willingness
to sacrifice location/property type to enter
the property market and this remains true.
Buyer Classification - Auckland
CoreLogic Monthly Property Market & Economic Update New Zealand February 2018 | 28
© Copyright 2018. CoreLogic and its licensors are the sole and exclusive owners of all rights, title and interest (including intellectual property rights) the CoreLogic Data contained in this publication.
All rights reserved.Auckland Values
Average Value of Housing Stock - Auckland
Values in Auckland are now up 1.6% over
the last three months, the fastest rate
since December 2016, but with a back
drop of continually reducing volumes, this
growth is unlikely to be sustained.
Papakura continues to experience a
strong recovery in values (up 5.1%) since
August 2017 after seeing a 3.9% drop
after peaking in April 2017. The rest of the
city appears to making a slightly more
restrained recovery after values plateaued
or dropped throughout 2017, with
Waitakere the only area to still be behind
values from a year ago.
Annual and Quarterly Value Change - Auckland
January 2018
Current Value 3 months 12 months Since 2007 peak
Rodney $947,856 1.5% 1.5% 62%
North Shore $1,228,920 2.3% 1.2% 90%
Waitakere $822,871 0.5% -1.6% 94%
Auckland City $1,245,682 1.8% 1.7% 100%
Manukau $904,158 1.2% 0.3% 98%
Papakura $700,283 2.3% 2.4% 95%
Franklin $673,514 1.2% 2.0% 70%
CoreLogic Monthly Property Market & Economic Update New Zealand February 2018 | 29
© Copyright 2018. CoreLogic and its licensors are the sole and exclusive owners of all rights, title and interest (including intellectual property rights) the CoreLogic Data contained in this publication.
All rights reserved.Auckland Suburb Value Change
Annual Value Change
CoreLogic Monthly Property Market & Economic Update New Zealand February 2018 | 30
© Copyright 2018. CoreLogic and its licensors are the sole and exclusive owners of all rights, title and interest (including intellectual property rights) the CoreLogic Data contained in this publication.
All rights reserved.The 12 month map of value change in
Auckland details variance across the
city. Parts of Central Auckland and in the
Eastern Suburbs are seeing up to 10%
growth, while out West and South of the
city there are a greater number of suburbs
where values have decreased in the last
year.
Parts of the North Shore are now showing
a bit more sustained growth than
previously witnessed.
*Size of bubble represents the number of
properties in the suburb.
Based on CoreLogic Median E-valuer
CoreLogic Monthly Property Market & Economic Update New Zealand February 2018 | 31
© Copyright 2018. CoreLogic and its licensors are the sole and exclusive owners of all rights, title and interest (including intellectual property rights) the CoreLogic Data contained in this publication.
All rights reserved.Current Auckland Suburb Values
Median Value of Housing Stock
20 km
10 km
Slight drops in value have not changed a picture of widespread unaffordability in Auckland.
There are currently still 106 suburbs where the average value of the housing stock is over one million dollars.
*Based on CoreLogic Median E-valuer
CoreLogic Monthly Property Market & Economic Update New Zealand February 2018 | 32
© Copyright 2018. CoreLogic and its licensors are the sole and exclusive owners of all rights, title and interest (including intellectual property rights) the CoreLogic Data contained in this publication.
All rights reserved.CoreLogic Monthly Property Market & Economic Update New Zealand February 2018 | 33
© Copyright 2018. CoreLogic and its licensors are the sole and exclusive owners of all rights, title and interest (including intellectual property rights) the CoreLogic Data contained in this publication.
All rights reserved.Hamilton Market Activity
Buyer Demand - Hamilton
Buyer demand in Hamilton started strong
but hasn’t been sustained and while other
main centres saw a significant lift in the
week ending 18 February, Hamilton did
not.
Multiple Property Owner activity, including
those from Auckland, bottomed out in
Hamilton in the middle of last year but
they are working their way back, with 43%
of sales going to multiple property owners
in January.
Over three quarters of these secured
finance for the purchase. This is interesting
considering the tighter Loan to Value
Ratio limits for investors, and while these
have now been slightly loosened by the
Reserve Bank, it’s too soon for the change
to have had any real effect on sales.
Meanwhile first home buyers had a quieter
month in January
Buyer Classification - Hamilton
CoreLogic Monthly Property Market & Economic Update New Zealand February 2018 | 34
© Copyright 2018. CoreLogic and its licensors are the sole and exclusive owners of all rights, title and interest (including intellectual property rights) the CoreLogic Data contained in this publication.
All rights reserved.Hamilton Values
Average Value of Housing Stock - Hamilton
Hamilton values have flattened out since
August 2017 after gradually growing for
most of 2017. Due to the dip in values a
year ago, values are only 2.6% up over the
last year though.
Hamilton South West has continued to
grow recently, however Central & North
West has experienced 4 months of falling
values.
Out East both the Northern and Southern
areas have seemingly plateaued with less
than 0.5% three month growth in each.
Annual and Quarterly Value Change - Hamilton
January 2018
Current Value 3 months 12 months Since 2007 peak
Hamilton Central & North West $494,164 -0.9% 1% 38%
Hamilton North East $692,145 0.5% 2% 54%
Hamilton South East $494,488 0.3% 3% 41%
Hamilton South West $492,551 1.8% 6% 44%
CoreLogic Monthly Property Market & Economic Update New Zealand February 2018 | 35
© Copyright 2018. CoreLogic and its licensors are the sole and exclusive owners of all rights, title and interest (including intellectual property rights) the CoreLogic Data contained in this publication.
All rights reserved.Tauranga Market Activity
Buyer Demand - Tauranga
A strong start to the year for market
activity in Tauranga has since been
followed up with the strongest single week
of activity since March 2017, for the week
ending 18 February, suggesting sales for
February could be relatively strong.
Multiple Property owners from Auckland
remain a weakening presence in the
Tauranga market, however other multiple
property owners are holding firm,
including those requiring mortgages.
Buyer Classification - Tauranga
CoreLogic Monthly Property Market & Economic Update New Zealand February 2018 | 36
© Copyright 2018. CoreLogic and its licensors are the sole and exclusive owners of all rights, title and interest (including intellectual property rights) the CoreLogic Data contained in this publication.
All rights reserved.Tauranga Values
Average Value of Housing Stock - Tauranga
Values have once again started to grow in
Tauranga (1.7% over the last three months),
although the annual rate of 3.9% remains
near the low point from the last four years.
January saw the average value reach
$698,875, the highest on record.
Annual and Quarterly Value Change - Tauranga
CoreLogic Monthly Property Market & Economic Update New Zealand February 2018 | 37
© Copyright 2018. CoreLogic and its licensors are the sole and exclusive owners of all rights, title and interest (including intellectual property rights) the CoreLogic Data contained in this publication.
All rights reserved.Wellington Market Activity
Buyer Demand - Wellington
Market activity in Wellington is following
the typical seasonal pattern - starting
slowly but finally kicking into action
from late January. The upward trend
witnessed since early spring appears to be
continuing.
First home buyers continue to go from
strength to strength in the capital,
accounting for 34% of sales in January
2018. In Lower Hutt they were responsible
for 42% of sales. Access to KiwiSaver
funds and grants are assisting these
buyers, while low interest rates are
helping to keep mortgage repayments
manageable.
Meanwhile movers and to a lesser degree
multiple property owners have kept their
activity in check.
Buyer Classification - Wellington
CoreLogic Monthly Property Market & Economic Update New Zealand February 2018 | 38
© Copyright 2018. CoreLogic and its licensors are the sole and exclusive owners of all rights, title and interest (including intellectual property rights) the CoreLogic Data contained in this publication.
All rights reserved.Wellington Values
Average Value of Housing Stock – Wellington
Values in Wellington have continued
an upward trajectory that began in
September last year, increasing 4.0% over
the last three months. The annual rate of
growth however remains below 10% as the
muted period over winter holds it back.
Upper Hutt’s recent exceptional growth
has hit a speed bump, with only 1.1%
growth over the last three months while
Porirua (4.0%) and Wellington (3.5%)
show no signs of slowing down.
Annual and Quarterly Change in Value - Wellington
January 2018
Current Value 3 months 12 months Since 2007 peak
Porirua $548,889 4.0% 13% 44%
Upper Hutt $470,511 1.1% 9% 34%
Lower Hutt $523,344 0.6% 8% 33%
Wellington City $764,560 3.5% 9% 44%
CoreLogic Monthly Property Market & Economic Update New Zealand February 2018 | 39
© Copyright 2018. CoreLogic and its licensors are the sole and exclusive owners of all rights, title and interest (including intellectual property rights) the CoreLogic Data contained in this publication.
All rights reserved.Christchurch Market Activity
Buyer Demand - Christchurch
Market activity in Christchurch has
remained muted following a similar end to
2017, although the latest week of activity
(ending 18 February) shows signs of a lift.
Not much changed in terms of the types
of buyers active between Q4 2017 and
January 2018, with movers remaining less
active participants and first home buyers
remaining near their all-time share levels.
While there appeared to be a lift in
multiple property owner activity late last
year in the Garden City, this is almost
wholly attributable to those buyers not
requiring a mortgage. They’re unaffected
by lending criteria and interest rates and
have maintained their activity while all
other buyers have dropped away.
Buyer Classification - Christchurch
CoreLogic Monthly Property Market & Economic Update New Zealand February 2018 | 40
© Copyright 2018. CoreLogic and its licensors are the sole and exclusive owners of all rights, title and interest (including intellectual property rights) the CoreLogic Data contained in this publication.
All rights reserved.Christchurch Values
Average Value of Housing Stock - Christchurch
Values remain very subdued in
Christchurch, as growth of only 0.8% over
the last three months means values are
still 0.6% below the same time last year.
This is evident across the City; however
values in the Hills have finally begun to
make some ground back after the average
value dropped to below $650k in October
2017.
Over the longer term, Christchurch
Southwest has seen the greatest growth
since the previous peak at the end of 2007
(39%).
Annual and Quarterly Value Change - Christchurch
January 2018
Current Value 3 months 12 months Since 2007 peak
Banks Peninsula $510,268 -1.0% -1% 6%
Christchurch Central & North $584,136 0.9% -1% 32%
Christchurch East $372,005 0.6% 0% 20%
Christchurch Hills $667,870 2.9% 0% 21%
Christchurch Southwest $471,587 0.4% -1% 39%
CoreLogic Monthly Property Market & Economic Update New Zealand February 2018 | 41
© Copyright 2018. CoreLogic and its licensors are the sole and exclusive owners of all rights, title and interest (including intellectual property rights) the CoreLogic Data contained in this publication.
All rights reserved.Dunedin Market Activity
Buyer Demand - Dunedin
2018 market activity has started off
relatively positively for Dunedin, with
gradually increasing volumes leading to a
strong week ending 18 February 2018.
There has been a lift in mortgaged
multiple property owners in Dunedin,
including those from Auckland. This
is a surprise considering the generally
accepted lower level of rental stock in
the student city and the fact that the
policy spotlight is currently on the need
to improve rental quality. Many were
expecting that areas like Dunedin would
become a less attractive investment
option. It may be too early to draw this
connection yet, but it’s certainly one to
keep an eye on.
Buyer Classification - Dunedin
CoreLogic Monthly Property Market & Economic Update New Zealand February 2018 | 42
© Copyright 2018. CoreLogic and its licensors are the sole and exclusive owners of all rights, title and interest (including intellectual property rights) the CoreLogic Data contained in this publication.
All rights reserved.Dunedin Values
Average value of stock – Dunedin
The growth in values in Dunedin has been
modest but consistent, with 2.8% growth
in the last three months and 9.3% growth
over the last 12 months.
Values across the Peninsula and Coastal
areas have been volatile with values
dropping dramatically over winter and
quickly regaining those losses in spring
and now showing signs of stalling again
(although retaining 3.2% growth in the last
three months due to prior growth).
In Taieri, values have again started to rise,
albeit at a slower rate than other parts of
the City.
Annual and quarterly change in value - Dunedin
January 2018
Current Value 3 months 12 months Since 2007 peak
Dunedin Central & North $410,278 3.2% 10% 36%
Dunedin South $373,189 2.0% 9% 31%
Peninsula and Coastal $360,397 3.5% 13% 33%
Taieri $402,502 1.8% 7% 37%
CoreLogic Monthly Property Market & Economic Update New Zealand February 2018 | 43
© Copyright 2018. CoreLogic and its licensors are the sole and exclusive owners of all rights, title and interest (including intellectual property rights) the CoreLogic Data contained in this publication.
All rights reserved.For more information contact us 0800 355 355
© Copyright 2018. CoreLogic and its licensors are the sole and exclusive owners of all rights, title and interest
corelogic.co.nz (including intellectual property rights) the CoreLogic Data contained in this publication. All rights reserved.You can also read