The Parable of Google Flu: Traps in Big Data Analysis
←
→
Page content transcription
If your browser does not render page correctly, please read the page content below
The Parable of Google Flu: Traps in Big Data
Analysis
David Lazer,1,2* Ryan Kennedy,1,3,4 Gary King,3 Alessandro Vespignani5

1Lazer  Laboratory, Northeastern University, Boston, MA 02115, USA. 2Harvard Kennedy School, Harvard University, Cambridge, MA 02138, USA.
3Institutefor Quantitative Social Science, Harvard University, Cambridge, MA 02138, USA. 4University of Houston, Houston, TX 77204, USA. 5Laboratory
for the Modeling of Biological and Sociotechnical Systems, Northeastern University, Boston, MA 02115, USA.
*Corresponding author. E-mail: d.lazer@neu.edu.
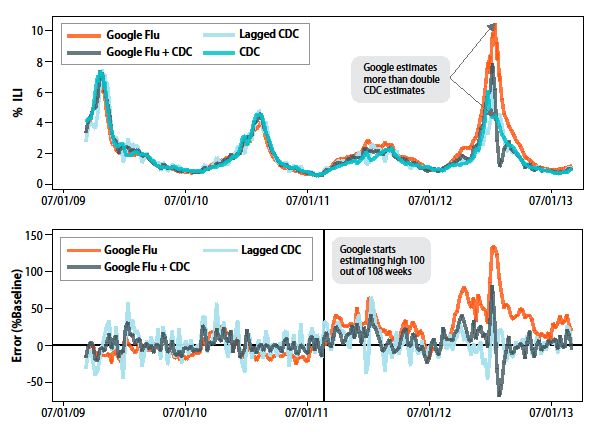
In February 2013, Google Flu Trends (GFT) made headlines but not for a reason that Google
executives or the creators of the flu tracking system would have hoped. Nature reported that GFT
was predicting more than double the proportion of doctor visits for influenza-like illness (ILI)
than the Centers for Disease Control and Prevention (CDC), which bases its estimates on
surveillance reports from laboratories across the United States (1, 2). This happened despite the
fact that GFT was built to predict CDC reports. Given that GFT is often held up as an exemplary
use of big data (3, 4), what lessons can we draw from this error?

The problems we identify are not limited to GFT. Research on whether search or social media
can predict x has become commonplace (5–7) and is often put in sharp contrast with traditional
methods and hypotheses. Although these studies have shown the value of these data, we are far
from a place where they can supplant more traditional methods or theories (8). We explore two
issues that contributed to GFT’s mistakes, big data hubris and algorithm dynamics, and offer
lessons for moving forward in the big data age.

Big Data Hubris

“Big data hubris” is the often implicit assumption that big data are a substitute for, rather than a
supplement to, traditional data collection and analysis. We have asserted that there are enormous
scientific possibilities in big data (9–11). However, quantity of data does not mean that one can
ignore foundational issues of measurement, construct validity and reliability, and dependencies
among data (12). The core challenge is that most big data that have received popular attention
are not the output of instruments designed to produce valid and reliable data amenable for
scientific analysis.

The initial version of GFT was a particularly problematic marriage of big and small data.
Essentially, the methodology was to find the best matches among 50 million search terms to fit
1152 data points (13). The odds of finding search terms that match the propensity of the flu but
are structurally unrelated, and so do not predict the future, were quite high. GFT developers, in
fact, report weeding out seasonal search terms unrelated to the flu but strongly correlated to the
CDC data, such as those regarding high school basketball (13). This should have been a warning
that the big data were overfitting the small number of cases, a standard concern in data analysis.

This ad hoc method of throwing out peculiar search terms failed when GFT completely missed
the nonseasonal 2009 influenza A–H1N1 pandemic (2, 14). In short, the initial version of GFT
was part flu detector, part winter detector. GFT engineers updated the algorithm in 2009, and this
model has run ever since, with a few changes announced in October 2013 (11, 15).

Although not widely reported until 2013, the new GFT has been persistently overestimating flu
prevalence for a much longer time. GFT also missed by a very large margin in the 2011–2012 flu
season and has missed high for 100 out of 108 weeks starting with August 2011 (see the chart)
(Fig. 1). These errors are not randomly distributed. For example, last week’s errors predict this
week’s errors (temporal autocorrelation), and the direction and magnitude of error varies with the
time of year (seasonality). These patterns mean that GFT overlooks considerable information
that could be extracted by traditional statistical methods.
Even after GFT was updated in 2009, the comparative value of the algorithm as a stand-alone flu
monitor is questionable. A study in 2010 demonstrated that GFT accuracy was not much better
than a fairly simple projection forward using already available (typically on a 2-week lag) CDC
data (4). The comparison has become even worse since that time, with lagged models
significantly outperforming GFT (see the chart). Even 3-week-old CDC data do a better job of
projecting current flu prevalence than GFT [see supplementary materials (SM)].

Considering the large number of approaches that provide inference on influenza activity (16–19),
does this mean that the current version of GFT is not useful? No, greater value can be obtained
by combining GFT with other near–real time health data (2, 20). For example, by combining
GFT and lagged CDC data, as well as dynamically recalibrating GFT, we can substantially
improve on the performance of GFT or the CDC alone (see the chart). This is no substitute for
ongoing evaluation and improvement, but, by incorporating this information, GFT could have
largely healed itself and would have likely remained out of the headlines.

Algorithm Dynamics

All empirical research stands on a foundation of measurement. Is the instrumentation actually
capturing the theoretical construct of interest? Is measurement stable and comparable across
cases and over time? Are measurement errors systematic? At a minimum, it is quite likely that
GFT was an unstable reflection of the prevalence of the flu because of algorithm dynamics
affecting Google’s search algorithm. Algorithm dynamics are the changes made by engineers to
improve the commercial service and by consumers in using that service. Several changes in
Google’s search algorithm and user behavior likely affected GFT’s tracking. The most common
explanation for GFT’s error is a media-stoked panic last flu season (1, 15). Although this may
have been a factor, it cannot explain why GFT has been missing high by wide margins for more
than 2 years. The 2009 version of GFT has weathered other media panics related to the flu,
including the 2005–2006 influenza A/H5N1 (“bird flu”) outbreak and the 2009 A/H1N1 (“swine
flu”) pandemic. A more likely culprit is changes made by Google’s search algorithm itself.

The Google search algorithm is not a static entity—the company is constantly testing and
improving search. For example, the official Google search blog reported 86 changes in June and
July 2012 alone (SM). Search patterns are the result of thousands of decisions made by the
company’s programmers in various subunits and by millions of consumers worldwide.

There are multiple challenges to replicating GFT’s original algorithm. GFT has never
documented the 45 search terms used, and the examples that have been released appear
misleading (14) (SM). Google does provide a service, Google Correlate, which allows the user to
identify search data that correlate with a given time series; however, it is limited to national level
data, whereas GFT was developed using correlations at the regional level (13). The service also
fails to return any of the sample search terms reported in GFT-related publications (13, 14).

Nonetheless, using Google Correlate to compare correlated search terms for the GFT time series
to those returned by the CDC’s data revealed some interesting differences. In particular, searches
for treatments for the flu and searches for information on differentiating the cold from the flu
track closely with GFT’s errors (SM). This points to the possibility that the explanation for
changes in relative search behavior is “blue team” dynamics—where the algorithm producing the
data (and thus user utilization) has been modified by the service provider in accordance with
their business model. Google reported in June 2011 that it had modified its search results to
provide suggested additional search terms and reported again in February 2012 that it was now
returning potential diagnoses for searches including physical symptoms like “fever” and “cough”
(21, 22). The former recommends searching for treatments of the flu in response to general flu
inquiries, and the latter may explain the increase in some searches to distinguish the flu from the
common cold. We document several other changes that may have affected GFT (SM).

In improving its service to customers, Google is also changing the data-generating process.
Modifications to the search algorithm are presumably implemented so as to support Google’s
business model—for example, in part, by providing users useful information quickly and, in part,
to promote more advertising revenue. Recommended searches, usually based on what others
have searched, will increase the relative magnitude of certain searches. Because GFT uses the
relative prevalence of search terms in its model, improvements in the search algorithm can
adversely affect GFT’s estimates. Oddly, GFT bakes in an assumption that relative search
volume for certain terms is statically related to external events, but search behavior is not just
exogenously determined, it is also endogenously cultivated by the service provider.

Blue team issues are not limited to Google. Platforms such as Twitter and Facebook are always
being re-engineered, and whether studies conducted even a year ago on data collected from these
platforms can be replicated in later or earlier periods is an open question.

Although it does not appear to be an issue in GFT, scholars should also be aware of the potential
for “red team” attacks on the systems we monitor. Red team dynamics occur when research
subjects (in this case Web searchers) attempt to manipulate the data-generating process to meet
their own goals, such as economic or political gain. Twitter polling is a clear example of these
tactics. Campaigns and companies, aware that news media are monitoring Twitter, have used
numerous tactics to make sure their candidate or product is trending (23, 24).

Similar use has been made of Twitter and Facebook to spread rumors about stock prices and
markets. Ironically, the more successful we become at monitoring the behavior of people using
these open sources of information, the more tempting it will be to manipulate those signals.

Transparency, Granularity, and All-Data

The GFT parable is important as a case study where we can learn critical lessons as we move
forward in the age of big data analysis.

Transparency and Replicability. Replication is a growing concern across the academy. The
supporting materials for the GFT-related papers did not meet emerging community standards.
Neither core search terms were identified nor larger search corpus provided. It is impossible for
Google to make its full arsenal of data available to outsiders, nor would it be ethically
acceptable, given privacy issues. However, there is no such constraint regarding the derivative,
aggregated data. Even if one had access to all of Google’s data, it would be impossible to
replicate the analyses of the original paper from the information provided regarding the analysis.
Although it is laudable that Google developed Google Correlate ostensibly from the concept
used for GFT, the public technology cannot be utilized to replicate their findings. Clicking the
link entitled “match the pattern of actual flu activity (this is how we built Google Flu Trends!)”
will not, ironically, produce a replication of the GFT search terms (14). Oddly, the few search
terms offered in the papers (14) do not seem to be strongly related with either GFT or the CDC
data (SM)—we surmise that the authors felt an unarticulated need to cloak the actual search
terms identified.

What is at stake is twofold. First, science is a cumulative endeavor, and to stand on the shoulders
of giants requires that scientists be able to continually assess work on which they are building
(25). Second, accumulation of knowledge requires fuel in the form of data. There is a network of
researchers waiting to improve the value of big data projects and to squeeze more actionable
information out of these types of data. The initial vision regarding GFT—that producing a more
accurate picture of the current prevalence of contagious diseases might allow for life-saving
interventions—is fundamentally correct, and all analyses suggest that there is indeed valuable
signal to be extracted.

Google is a business, but it also holds in trust data on the desires, thoughts, and the connections
of humanity. Making money “without doing evil” (paraphrasing Google’s motto) is not enough
when it is feasible to do so much good. It is also incumbent upon academia to build institutional
models to facilitate collaborations with such big data projects—something that is too often
missing now in universities (26).

Use Big Data to Understand the Unknown. Because a simple lagged model for flu prevalence
will perform so well, there is little room for improvement on the CDC data for model projections
[this does not apply to other methods to directly measure flu prevalence, e.g. (20, 27, 28)]. If you
are 90% of the way there, at most you can gain that last 10%. What is more valuable is to
understand the prevalence of flu at very local levels, which is not practical for the CDC to widely
produce, but which, in principle, more finely granular measures of GFT could provide. Such a
finely granular view, in turn, would provide powerful input into generative models of flu
propagation and more accurate prediction of the flu months ahead of time (29–33).

Study the Algorithm. Twitter, Facebook, Google and the Internet more generally are constantly
changing because of the actions of millions of engineers and consumers. Researchers need a
better understanding of how these changes occur over time. Scientists need to replicate findings
using these data sources across time and using other data sources to ensure that they are
observing robust patterns and not evanescent trends. For example, it is eminently feasible to do
controlled experiments with Google, e.g., looking at how Google search results will differ based
on location and past searches (34). More generally, studying the evolution of socio-technical
systems embedded in our societies is intrinsically important and worthy of study. The algorithms
underlying Google, Twitter, and Facebook help determine what we find out about our health,
politics, and friends.

It’s Not Just About Size of the Data. There is a tendency for big data research and more
traditional applied statistics to live in two different realms—aware of each other’s existence but
generally not very trusting of each other. Big data offer enormous possibilities for new insights
(especially around networks, spatial and temporal dynamics), for understanding human systems
at the systemic level, and for detecting interactions and nonlinearities in relations among
variables. We contend that these are the most exciting frontiers in studying human behavior.

However, traditional “small data” often offer information that is not contained (or containable) in
big data, and the very factors that have enabled big data are enabling more traditional data
collection. The Internet has opened the way for improving standard surveys, experiments, and
health reporting (35). Instead of focusing on a “big data revolution,” perhaps it is time we were
focused on an “all data revolution,” where we recognize that the critical change in the world has
been innovative analytics, using data from all traditional and new sources, and providing a
deeper, clearer understanding of our world.

References and Notes
1. D. Butler, Nature 494, 155 (2013).
2. D. R. Olson et al., PLOS Comput. Biol. 9, e1003256 (2013).
3. A. McAfee, E. Brynjolfsson, Harv. Bus. Rev. 90, 60, 68, 128 (2012).
4. S. Goel et al., Proc. Natl. Acad. Sci. U.S.A. 107, 17486 (2010).
5. A. Tumasjan et al., in Proceedings of the 4th International AAAI Conference on Weblogs and
Social Media, Atlanta, Georgia, 11 to 15 July 2010 (Association for Advancement of Artificial
Intelligence, 2010), p. 178–185.
6. J. Bollen et al., J. Comput. Sci. 2, 1 (2011).
7. F. Ciulla et al., EPJ Data Sci. 1, 8 (2012).
8. P.T. Metaxas et al., in Proceedings of PASSAT—IEEE Third International Conference on
Social Computing, Boston, MA, 9 to 11 October 2011, (IEEE, 2011), pp. 165–1171.
doi:10.1109/PASSAT/SocialCom.2011.98
9. D. Lazer et al., Science 323, 721 (2009).
10. A. Vespignani, Science 325, 425 (2009).
11. G. King, Science 331, 719 (2011).
12. D. Boyd & K. Crawford, Inf., Comm. & Soc. 15, 662 (2012).
13. J. Ginsberg et al., Nature 457, 1012 (2009).
14. S. Cook et al., PLoS ONE 6, e23610 (2011).
15. P. Copeland et al., Int. Soc. Negl. Trop. Dis. 2013, 3 (2013).
16. C. Viboud et al., Am. J. Epidemiol. 158, 996 (2003).
17. W. W. Thompson et al., J. Infect. Dis. 194 (Suppl. 2), S82 (2006).
18. I. M. Hall et al., Epidemiol. Infect. 135, 372 (2007).
19. J. B. S. Ong et al., PLoS ONE 5, e10036 (2010).
20. J. R. Ortiz et al., PLoS ONE 6, e18687 (2011).
21. Organizing lists of related searches, Google;
http://insidesearch.blogspot.com/2011/06/organizing-lists-of-related-searches_16.html
22. Improving health searches, because your health matters, Google;
http://insidesearch.blogspot.com/2012/02/improving-health-searches-because-your.html
23. E. Mustafaraj, P. Metaxas, in Proceedings of the WebSci10, Raleigh, NC, 26 and 27 April
2010 (Web Science Trust, 2010); http://journal.webscience.org/317/.
24. J. Ratkiewicz et al., in Proceedings of 5th International AAAI Conference on Weblogs and
Social Media, San Francisco, CA, 7 to 11 August 2011 (AAAI, 2011), p. 297–304.
25. G. King, PS Polit. Sci. Polit. 28, 443 (1995).
26. P. Voosen, Chronicle of Higher Education, 13 September 2013;
http://chronicle.com/article/Researchers-Struggle-to-Secure/141591/.
27. R. Lazarus et al., BMC Public Health 1, 9 (2001).
28. R. Chunara et al., Online J. Public Health Inform. 5, e133 (2013).
29. D. Balcan et al., Proc. Natl. Acad. Sci. U.S.A. 106, 21484 (2009).
30. D. L. Chao et al., PLOS Comput. Biol. 6, e1000656 (2010).
31. J. Shaman, A. Karspeck, Proc. Natl. Acad. Sci. U.S.A. 109, 20425 (2012).
32. J. Shaman et al., Nat. Commun. 4, 2837 (2013).
33. E. O. Nsoesie et al., PLoS ONE 8, e67164 (2013).
34. A. Hannak et al., in Proceedings of 22nd International World Wide Web Conference, Rio de
Janeiro, 13 to 17 May 2013 (2013), p. 527–538.
35. A. J. Berinsky et al., Polit. Anal. 20, 351 (2012).

Acknowledgements: This research was funded, in part, by NSF grant no. 1125095 and, in part,
by the Intelligence Advanced Research Projects Activity (IARPA) via Department of Interior
National Business Center (DoI/NBC) contract D12PC00285. We also gratefully acknowledge
the help and support provided by HRL Laboratories, LLC. The views and conclusions contained
herein are those of the authors and should not be interpreted as necessarily representing the
official policies or endorsements, either expressed or implied, of the NSF, IARPA, DoI/NBE,
HRL, or the U.S. government.
Fig. 1. GFT overestimation. GFT overestimated the prevalence of flu in the 2012–2013 season
and overshot the actual level in 2011–2012 by more than 50%. From 21 August 2011 to 1
September 2013, GFT reported overly high flu prevalence 100 out of 108 weeks. (Top)
Estimates of doctor visits for ILI. “Lagged CDC” incorporates 52-week seasonality variables
with lagged CDC data. “Google Flu + CDC” combines GFT, lagged CDC estimates, lagged error
of GFT estimates, and 52-week seasonality variables. (Bottom) Error [as a percentage of CDC
baseline: (estimate by CDC)/CDC data]. Both alternative models have much less error than GFT
alone. Mean absolute error (MAE) during the out-of-sample period is 0.486 for GFT, 0.311 for
lagged CDC, and 0.232 for combined GFT and CDC. All of these differences are statistically
significant at P < 0.05. See SM.
You can also read