EU Emissions Trading System data viewer Background note - European ...
←
→
Page content transcription
If your browser does not render page correctly, please read the page content below
Working Paper - ETC/CME July 2020

                         EU Emissions Trading System data viewer
                         Background note

Authors:
Sabine Gores, Johanna Cludius, Verena Graichen, Sean Healy, Christian Nissen,
Carina Zell-Ziegler (Öko-Institut)

ETC/CME consortium partners: AETHER, Interprofessional Technical Centre for Studies on Air
Pollution (CITEPA), Czech Hydrometeorological Institute (CHMI), Energy and Environmental
Studies and Software Development (EMISIA), Institute for Applied Ecology (ÖKO-INSTITUT),
ÖKO-RECHERCHE, Norwegian Institute for Air Research (NILU), Netherlands Environmental
Assessment Agency (PBL), National Institute for Public Health and the Environment (RIVM),
Environment Agency Austria (UBA), Flemish Institute for Technological Research (VITO)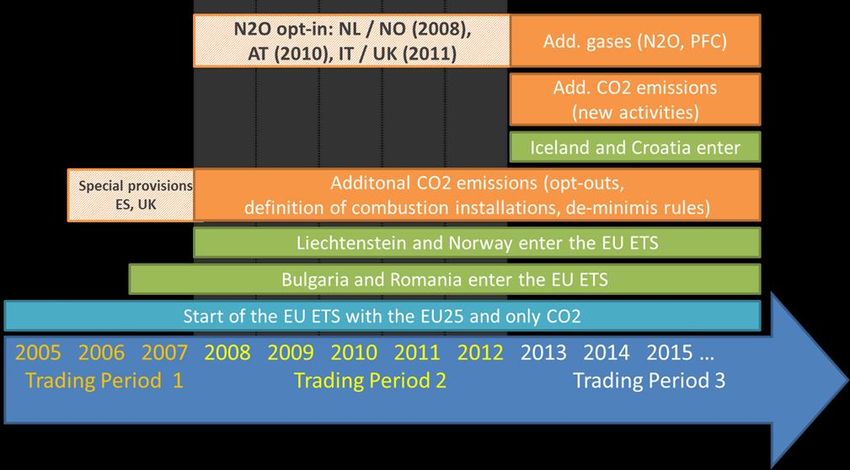
Cover Picture: Image by cwizner from Pixabay - https://pixabay.com/photos/industry-power-energy-industrial-1827884/

Disclaimer
This ETC/CME Working Paper has not been published and therefore no reference can be made to it in any other formal or
published document or document meant for publication. This document has not been subjected to any formal review by the
European Environment Agency (EEA) or EEA’s member countries. It does not represent the formal views of the EEA and its
ETC/CME.

ETC/CME Working paper
European Topic Centre on Climate
change mitigation and energy
Boeretang 200
B-2400 Mol, Belgium
Tel.: +32 14 33 59 77
Email: etccme@vito.be
Contents

Acknowledgements ....................................................................................................................................... 4
       Introduction ........................................................................................................................................... 5
       Data sources .......................................................................................................................................... 6
   2.1.       EUTL ............................................................................................................................................... 6
   2.2.       Other sources ................................................................................................................................ 6
       2.2.1.         Main activity of individual entities ........................................................................................ 6
       2.2.2.         Corrections to freely allocated allowances ........................................................................... 8
       2.2.3.         Auctions ................................................................................................................................. 8
       2.2.4.         Estimates for 2008-2012 to reflect the current scope of EU ETS .......................................... 8
       Regional disaggregation ........................................................................................................................ 9
       Temporal disaggregation ..................................................................................................................... 10
       information.......................................................................................................................................... 10
       Activity ................................................................................................................................................. 12
   6.1.       Translation of activity codes ........................................................................................................ 12
   6.2.       Information on stationary installations covered ......................................................................... 14
   6.3.       Information on aviation operators covered ................................................................................ 16
       Size of entities ..................................................................................................................................... 17
       Number of entities .............................................................................................................................. 17
       Measures ............................................................................................................................................. 19
          Gases ............................................................................................................................................... 19
          Annex I – Correction of freely allocated allowances ....................................................................... 19
   11.1.          Stationary installations ............................................................................................................ 19
   11.2.          Aviation.................................................................................................................................... 20
          Annex II - Auctioning ....................................................................................................................... 22
          Annex III – Estimates to reflect current ETS scope for stationary installations .............................. 26

Working Paper - ETC/CME                                                                                                                                    3
Acknowledgements The EU ETS data viewer is prepared by the European Environment Agency (EEA), with support from the European Topic Centre on Climate change mitigation and energy (ETC/CME). The EEA acknowledges in particular, the input from Sabine Gores, Verena Graichen, Sean Healy, and Christian Nissen from the Öko–Institut, Germany (as ETC/CME partner). Working Paper - ETC/CME 4
Introduction

      The European Union (EU) Emissions Trading System (ETS) is one of the main and most prominent
      measures introduced by the EU to reduce its greenhouse gas emissions and reach its reduction target
      under the Kyoto Protocol, the internal EU-target for 2020. The main source of information on the system
      at EU level is the European Union Transaction Log (EUTL), formerly called Community Independent
      Transaction Log (CITL) (1). The EUTL, which is run by the European Commission, checks and records all
      transactions carried out under the EU ETS. It contains information on each entity covered by the system,
      including its main activity type, the quantity of allocated allowances and verified emissions on an annual
      basis. However, the data is not easily accessible in a user-friendly format.
      The European Environment Agency (EEA) (2) and its European Topic Centre on Climate change mitigation
      and energy (ETC/CME) (3) developed the EU ETS data viewer, a tool to facilitate access to the information
      contained in the EUTL, as well as relevant additional information related to the EU ETS. The EEA’s EU ETS
      data viewer aims to support governments, market players and other stakeholders in their assessment of
      the EU ETS. The EU ETS data viewer is accessible on EEA website at: https://www.eea.europa.eu/data-
      and-maps/dashboards/emissions-trading-viewer-1.
      This viewer enables users to assess the data concerning stationary installations and aircraft operators
      and emissions contained in the EUTL by country or country grouping, activity, size and year. While entity-
      level data are available from the EUTL, the EU ETS data viewer provides aggregated data at national
      level.
      In the first and second trading period (2005–2007 and 2008–2012) the EUTL contained information for
      the nine categories of activities for stationary installations mentioned in Annex I of the Emission Trading
      Directive (4) and an additional category for opt-in installations. For the third trading period (2013-2020)
      new activity categories have been introduced. In total, there are now 28 categories of activities for
      stationary installations, some of which correspond to old categories while others pertain to new
      activities covered by the scheme from the third trading period onwards (see Chapter 7). Information on
      aviation operators (ETS activity type 10) is also included in the EU ETS data viewer
      This manual describes the functionalities and underlying data of the EU ETS data viewer. The latest
      version of the EU ETS data viewer is based on data accessed from the EUTL on 1st July 2020.

(1)   http://ec.europa.eu/environment/ets
(2)   http://www.eea.europa.eu
(3)   https://plone5demo.eionet.europa.eu/etcs/etc-cme
(4)   Directive 2009/29/EC of the European Parliament and of the council of 23 April 2009 amending Directive
      2003/87/EC so as to improve and extend the greenhouse gas emission allowance trading scheme of the
      Community, Official Journal of the European Union, 5.6.2009

      Working Paper - ETC/CME                                                                              5
Data sources
The EU ETS data viewer contains information for all stationary installations included in the EU ETS since
2005, as well as for aircraft operators covered by the EU ETS.
2.1. EUTL
Most of the data included in the EU ETS data viewer originate from the EUTL. The following elements of
the data viewer are based on entity-level data available from the EUTL (see Chapter 6 for further
explanation):
the quantity of allowances allocated to each entity for the years 2005 to 2019 for non-excluded
entities;
the quantity of verified emissions of that entity for the years 2005 to 2019 for non-excluded
entities; and
the amount of total units surrendered: the amounts of EU Allowances (EUAs or EUAAs)
surrendered; for 2008–2012: the amounts of certified reduction units (CERs) and emission
reduction units (ERUs) surrendered (in the third trading period CERs and ERUs are exchanged for
EUAs and EUAAs before being surrendered).
The data contained in the EUTL is undergoing constant changes, for examples due to:
entities entering or leaving the EU ETS;
addition of missing information, e.g. late verified emission reports;
correction of emission reports or inaccurate data in national registries; and
changes of allocated amounts following legal proceedings.
The EU ETS data viewer reflects data as available from the EUTL, including for those entities for which
data may still be incomplete (e.g. in case of missing reports on verified emissions, on-going legal
proceedings on allocation, etc.).
2.2. Other sources
2.2.1. Main activity of individual entities
Main activity type codes are generally available from EUTL.
With the start of the third trading period of the EU ETS (2013-2020) new activity codes (codes 20-47)
have been introduced. All new entities entering the scheme are automatically assigned a new activity
code. However, not all installations that were already part of the scheme before the start of the third
trading period have changed to the new activity codes, but kept the old codes. The ETC/ACM applied a
methodology to map those old codes (1-9) to new codes (20-43) in order to facilitate analysis of the
different activities. The methodology is mainly based on information on NACE codes which have been
published by the European Commission as part of the preparation of the carbon leakage list for 2015-
2019 (5). Details on the translation of activity codes are available in an ETC/ACM technical paper (6). The
(5) https://ec.europa.eu/clima/sites/clima/files/installation_nace_rev2_matching_en.xls
as of 18 December 2017.
(6) http://acm.eionet.europa.eu/docs/ETCACM_EU-
ETS_translation_of_activity_codes_April_2016_for_publication.pdf
Working Paper - ETC/CME 6translation is regularly updated to include country specific information. The most actual translation table
is available as download from the EEA Data Service7.
(7) See Translation of activity codes in the information section at https://www.eea.europa.eu/data-and-
maps/dashboards/emissions-trading-viewer-12.2.2. Corrections to freely allocated allowances
For stationary installations, corrections to freely allocated allowances are provided in the EU ETS data
viewer on country level. These corrections are reflecting information provided directly by countries in
the course of MS consultation cycles for the annual EEA Trends and Projections Reports of last years.
For aviation-related information, a correction for freely allocated allowances in the year 2012 is
provided. As some aviation operators choose to comply only with the reduced aviation scope due to the
“stop the clock decision”, freely allocated allowances exceeding this reduced scope had to be returned.
To a large extent these returns are not reflected in the EUTL. The corrections to freely allocated
allowances due to the change in scope have been provided by the European Commission (8).
Further detailed information on these corrections is provided in Annex I – Correction of freely allocated
allowances.
2.2.3. Auctions
Information on EUAs and EUAAs auctioned or sold by governments has been gathered from various
sources and is available on the country level. For the first and second trading period the number of EUAs
auctioned or sold by governments has been collected from publications from the respective countries, as
well as auction reports published by the trading platforms on which the auctions are carried out, details
on these sources are given in Table 7-1.
From the third trading period onwards, auctioned volumes are derived from auction calendars and
auction reports published by the two exchanges that carry out auctions of allowances for the third
trading period: The European Energy Exchange (EEX) and the Intercontinental Exchange (ICE) (9).
Further detailed information on auctioned amounts is provided in Annex II - Auctioning.
2.2.4. Estimates for 2008-2012 to reflect the current scope of EU ETS
An estimate to reflect current EU ETS scope is necessary in order to compare ETS data on a stable basis
across years and trading periods. Using information from a range of data sources, including the EUTL,
national GHG inventories and EU ETS documentation, an estimate to reflect current ETS scope for
stationary installations has been calculated by the EEA for each year and for each participating country.
This estimate is applied both to verified emissions and allocated allowances. It does not address changes
related to the inclusion or exclusion of individual entities within trading periods (e.g. new entrants and
closures). No estimate was quantified for aviation. The methodology applied by EEA for such estimates is
documented in detail in an ETC/ACM technical paper (10).
A short explanation of the estimates to reflect current ETS scope provided in the EU ETS data viewer is
provided in Annex III – Estimates to reflect current ETS scope for stationary installations.
(8) https://ec.europa.eu/clima/sites/clima/files/transport/aviation/docs/20130926_returns_en.pdf
(9) www.eex.com; www.theice.com
(10) see information section at https://www.eea.europa.eu/data-and-maps/dashboards/emissions-trading-
viewer-1Regional disaggregation
The EU ETS data viewer includes data for all countries participating in the EU ETS. The user can select
individual countries or country groups. Countries are sorted alphabetically followed by the country
groups. Table 3-1 lists all participating countries and indicates to which groups they belong.
Table 3-1 Countries and country groups
EU-28 All countries
Austria x x
Belgium x x
Bulgaria x x
Croatia x x
Cyprus x x
Czech Republic x x
Denmark x x
Estonia x x
Finland x x
France x x
Germany x x
Greece x x
Hungary x x
Iceland x
Ireland x x
Italy x x
Latvia x x
Liechtenstein x
Lithuania x x
Luxembourg x x
Malta x x
Netherlands x x
Norway x
Poland x x
Portugal x x
Romania x x
Slovak Republic x x
Slovenia x x
Spain x x
Sweden x x
United Kingdom x x
In addition, the auctioning of a number of allowances at EU level only, as part of the NER300 program,
made it necessary to include an additional item “NER 300” in the list of countries.
Working Paper - ETC/CME 9Temporal disaggregation
Emission caps under the EU ETS are determined for multiannual trading periods, and operators must
comply with their obligations on an annual basis. The nature of the entities covered under the EU ETS, as
well as allocation rules might differ between trading periods. The first trading period (also called
supplementary program commitment period) covered three years (2005-2007); the second trading
period covered five years (2008-2012), while the third trading period (2013-2020) covers eight years. No
‘banking’ (carry-over) of EUAs was possible between the first and the second trading period.
The user can choose the following settings in the category 'year':
2005, 2006, 2007, 2008, 2009, 2010, 2011, 2012, 2013, 2014, 2015, 2016, 2017, 2018 and 2019: data
for an individual year.
total 1st trading period (2005–2007): sum of the three years (2005 to 2007) of the first trading
period.
total 2nd trading period (2008–2012): sum of the five years (2008 to 2012) of the second trading
period.
total 3rd trading period (2013–2019): sum of the first four years (2013 to 2019) of the third trading
period.
As illustrated in Annex III – Estimates to reflect current ETS scope for stationary installations, the number
of countries participating in the EU ETS has increased over time. For example Bulgaria and Romania only
entered the EU ETS in 2007. If 2005 or 2006 is selected, no data is shown for these two countries. The
same applies to the selection of the years 2005, 2006 or 2007 for Norway and Liechtenstein who joined
the EU ETS in 2008. For Iceland, no data is shown for the years 2005 to 2011 and for Croatia no data is
shown for the years 2005 to 2012.
information
The EU ETS data viewer gives the possibility to visualise data related to one or several types of
information related to the EU ETS (See table below).
Table 5-1 ETS information
Item Description
1. Total allocated allowances Total number of allocated allowances.
(EUAs and EUAAs)
1.1. Freely allocated Total number of allowances received free of charge. This
allowances does not include allowances bought, e.g. through auctioning.
1.1.1 Free allocation to Number of allowances received free of charge by existing
existing entities (Art. 10a(1)) entities under Art. 10a(1) of the ETS Directive.
1.1.2 Free allocation from Number of allowances received free of charge by new
the new entrants reserve entities under Art. 10a(7) of the ETS Directive.
(Art. 10 a(7))
1.1.3 Free allocation for Number of allowances received free of charge for a
modernisation of electricity transitional period by electricity generators under Art. 10c of
generation (Art. 10c) the ETS Directive to help modernise production.1.2. Correction to freely Correction of the number of allowances allocated free of
allocated allowances (not charge, due to:
reflected in EUTL) transfers of allowances in six countries;
adjustment of free allocation for aviation operators in
the year 2012 due to the ‘stop the clock’ decision.
These transfers and adjustments are not reflected in the
EUTL (see further details in Annex I – Correction of freely
allocated allowances).
1.3 Allowances auctioned or Number of EUAs and EUAAs auctioned or sold by
sold (EUAs and EUAAs) participating countries (see further details in Annex II -
Auctioning).
2. Verified emissions Emissions of installations and aviation operators which have
been verified by an independent third party.
3. Estimates to reflect Estimates to reflect current ETS scope in the period 2005 to
current scope for allowances 2012 to be added to allowances and verified emissions for a
and emissions consistent comparison between years and trading periods
(see further details in Annex III – Estimates to reflect current
ETS scope for stationary installations).
4. Total surrendered units Total number of emission trading units (allowances, aviation
allowances and Kyoto project credits) surrendered by
operators to their authorities for compliance under the
EU ETS. Each unit represents one tonne of CO2-eq.
4.1 Surrendered EU Allowances surrendered by operators of stationary
allowances (EUAs and installations, or allowances and aviation allowances
EUAAs) surrendered by aviation operators.
4.2 Surrendered certified CERs (Certified Emission Reductions) originating from Clean
emission reductions (CERs) Development Mechanism projects under the Kyoto Protocol,
i.e. emission reduction projects in non-Annex 1 countries
(countries without an emission reduction target under the
Kyoto-Protocol. In the third trading period, only the total
number of surrendered units is publicly available (no detail
on the type of unit surrendered is publicly available).
4.3 Surrendered emission ERUs (Emission Reduction Units) originating from Joint
reduction units (ERUs) Implementation projects under the Kyoto Protocol, i.e.
emission reduction projects in Annex 1 countries (countries
with an emission reduction target under the Kyoto Protocol).
In the third trading period, only the total number of
surrendered units is publicly available (no detail on the type
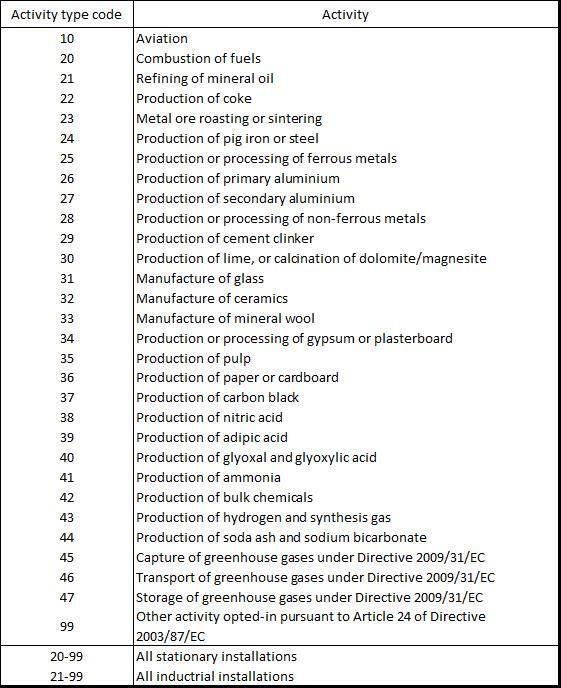
of unit surrendered is publicly available).Activity All entities included in the EUTL are grouped by activity type as shown below. Table 6-1 EUTL activity types 6.1. Translation of activity codes Table 6-1 shows the new activity type codes (codes 20-47) introduced for the third trading period of the EU ETS (2013-2020). All new entities entering the scheme are automatically assigned a new activity code. However, not all installations that were already part of the scheme before the start of the third trading period have changed to the new activity codes, but kept the old codes.
ETC/CME applied a methodology to map those old codes (1-9) to new codes (20-43) in order to facilitate
analysis of the different activities. The methodology is mainly based on information on NACE codes
which have been published by the European Commission as part of the preparation of the carbon
leakage list for 2015-2019 (11). These NACE codes were attributed to installations based on operator
information on NACE rev.1.1 and rev. 2 codes in the National Implementation Measures (NIMs), ETS
activity code and benchmarks used for allocation. Within the carbon leakage list exercise all codes have
been checked for plausibility. Details on the translation of activity codes are available in an ETC/ACM
technical paper (12). The translation is regularly updated to include country specific information.
This mapping from old to new codes is carried out for all activity codes except code 99 “Other activity
opted-in under Art. 24”, if not indicated otherwise by Member States. The reason for keeping this
activity separate is due to the fact that the nature of such activities could be very diverse across the 13
countries that opted-in installations falling into this category. For example, Sweden decided to include all
installations with a thermal input below 20 MW that are nevertheless connected to a district heating
network with a total rated thermal input above 20 MW. In practice, the activity of an installation which is
listed under activity type 99 in the EUTL is rarely clear. In addition, some installations included under the
EU ETS after 2013 used this activity code, too.
For three iron and steel plants with major emissions the main activity type code has been changed from
20 to 24 after an exchange with competent authorities of the respective Member States.
The result of the translation is shown in Table 6-2 with regard to the number of installations and related
verified emissions 2019. The most actual translation table is available as download from the EEA Data
Service13.

(11)   https://ec.europa.eu/clima/sites/clima/files/installation_nace_rev2_matching_en.xls as of 18 December
       2017.
(12)   http://acm.eionet.europa.eu/docs/ETCACM_EU-
       ETS_translation_of_activity_codes_April_2016_for_publication.pdf
( 13 )      see information section at https://www.eea.europa.eu/data-and-maps/dashboards/emissions-trading-
viewer-1
Table 6-2 Allocation of new activity codes to installation with old codes
Percentage of translation to
MAIN_ACTI Before Translation After Translation Conducted Translation
total
VITY_TYPE_
No of No of No of No of
CODE VE 2019 VE 2019 VE 2019 VE 2019
installations installations installations installations
1 2,632 64,158,829
2 38 9,462,486
3 3 -
4 3 -
5 44 4,451,735
6 126 5,724,510
7 104 1,023,412
8 543 888,990
9 268 2,136,253
10 1574 68,172,091 1,574 68,172,091 0 0 0% 0%
20 7561 910,438,803 9824 954,853,173 2,263 44,414,370 23% 5%
21 139 113,274,237 176 122,736,723 37 9,462,486 21% 8%
22 19 10,047,163 29 10,171,963 10 124,800 34% 1%
23 13 2,571,680 13 2,571,680 0 0 0% 0%
24 242 99,085,974 293 118,583,219 51 19,497,245 17% 16%
25 250 12,498,817 287 12,621,754 37 122,937 13% 1%
26 33 8,564,055 40 8,564,055 7 0 18% 0%
27 35 1,275,301 36 1,275,301 1 0 3% 0%
28 92 7,556,372 98 7,556,372 6 0 6% 0%
29 248 116,031,489 333 120,800,956 85 4,769,467 26% 4%
30 272 27,877,062 426 30,204,704 154 2,327,642 36% 8%
31 366 17,113,807 464 18,077,180 98 963,373 21% 5%
32 1192 13,821,390 1741 14,708,596 549 887,206 32% 6%
33 44 1,847,675 65 2,166,988 21 319,313 32% 15%
34 42 1,248,381 42 1,248,381 0 0 0% 0%
35 177 4,993,150 197 5,317,870 20 324,720 10% 6%
36 554 19,083,658 865 21,586,406 311 2,502,748 36% 12%
37 18 1,615,221 18 1,615,221 0 0 0% 0%
38 34 3,484,689 36 3,756,332 2 271,643 6% 7%
39 3 113,963 3 113,963 0 0 0% 0%
40 1 10,099 1 10,099 0 0 0% 0%
41 29 20,490,772 30 20,490,772 1 0 3% 0%
42 355 33,826,806 460 36,138,628 105 2,311,822 23% 6%
43 42 8,891,782 47 9,231,631 5 339,849 11% 4%
44 14 4,153,217 14 4,153,217 0 0 0% 0%
45 2 221 2 221 0 0 0% 0%
46 1 1,451 1 1,451 0 0 0% 0%
99 420 1,805,499 418 1,012,093 -2 -793,406 0% -78%
Group 1-9 3,761 87,846,215 - -
Group 10-99 13,772 1,509,894,825 17,533 1,597,741,040
Total 17,533 1,597,741,040 17,533 1,597,741,040 3,761 87,846,215 21% 5%
Source: EUTL, July 2020; EEA.
The sums for all activity codes (as outlined in Table 6-1), as well as sums for all industrial activities or
sums for all stationary installations can also be shown in the EEA EU ETS data viewer.
6.2. Information on stationary installations coveredThe EU ETS covered 12 074 stationary installations in most industrial sectors in 2019 (14).
The scope of the EU ETS includes all combustion installations exceeding 20 MW and all installations
where activities listed in Annex I of the ETS Directive are carried out (EU, 2003). The total emissions of all
stationary installations covered by the EU ETS in 2019 were equal to 1 530 Mt CO2-eq.
The stationary installations covered by the EU ETS can be grouped into eight main categories, based on
their main activities responsible for GHG emissions:
1. fuel combustion (mainly electricity generation plus various manufacturing industries);
2. refineries;
3. iron and steel, coke, and metal ore production;
4. cement, clinker and lime production;
5. other non-metallic minerals (glass, ceramics, mineral wool and gypsum);
6. production of pulp and paper;
7. production of chemicals;
8. other (opt-ins and capture of GHGs).
The majority of the stationary installations in the EU ETS are fuel combustion plants (63%), and together
they account for the same proportion of total verified emissions from stationary installations (63 %). In
terms of emissions, the cement, clinker and lime production sector is the second largest sector (10% of
emissions), even though it ranks fourth in terms of the number of installations. Both the iron, steel and
coke sector and the refinery sector account each for 9% respectively 8% emissions from stationary
installations, followed by the chemicals sector, responsible for 5 % of emissions. The remaining
installations account for 25 % of the stationary installations covered by the EU ETS, but are only
responsible for 6 % of the total verified emissions of stationary installations (Table 6-3).
(14) This number includes all non-excluded stationary installations with any EU ETS information reported in
2019.Table 6-3 Activities and sectors covered by the EU ETS in 2019
Verified
Number of
Activities Sectors emissions
entities
Mt CO2-eq
20 Combustion of fuels Combustion 7605 955
21 Refining of mineral oil Refineries 140 123
22 Production of coke 20 10
Iron and Steel,
23 Metal ore roasting or sintering 9 3
coke, metal ore
24 Production of pig iron or steel 245 119
25 Production or processing of ferrous metals 254 13
26 Production of primary aluminium Other metals 33 9
27 Production of secondary aluminium (incl. aluminium) 34 1
28 Production or processing of non-ferrous metals 90 8
29 Production of cement clinker Cement and 261 121
30 Production of lime, or calcination of dolomite/magnesite Lime 299 30
31 Manufacture of glass 372 18
32 Manufacture of ceramics Other non- 1092 15
33 Manufacture of mineral wool metallic minerals 53 2
34 Production or processing of gypsum or plasterboard 40 1
35 Production of pulp 180 5
Pulp and Paper
36 Production of paper or cardboard 589 22
37 Production of carbon black 18 2
38 Production of nitric acid 36 4
39 Production of adipic acid 3 0
40 Production of glyoxal and glyoxylic acid 1 0
Chemicals
41 Production of ammonia 29 20
42 Production of bulk chemicals 363 36
43 Production of hydrogen and synthesis gas 42 9
44 Production of soda ash and sodium bicarbonate 14 4
45 Capture of greenhouse gases under Directive 2009/31/EC 2 0
46 Transport of greenhouse gases under Directive 2009/31/EC Other 1 0
99 Other activity opted-in under Art. 24 249 1
Sum of all stationary installations 12,074 1,529.56895
10 Aviation 524 68
Note: Entity is counted if it is not excluded and if it has any ETS information in 2017.
Source: EUTL, July 1, 2020, own calculation.
6.3. Information on aviation operators covered
The EU ETS covered 524 aircraft operators in 2019. The total emissions of aviation covered by the EU ETS
in 2019 were equal to 68 Mt CO2-eq.. Since its inclusion in the EU ETS in 2012, the aviation sector has had
to purchase EUAs from the stationary sector to fully cover aviation emissions. Initially the scope of
aviation covered all flights from, to and within the European Economic Area. However, to allow time for
negotiations within the ICAO on a global market-based measure for aviation, the requirements of the EU
ETS were suspended for flights to and from non-European countries for 2013-2016. The balance
between the supply of and demand for EUAAs changed considerably between 2012 and 2013-2016,
because in 2012 operators were allowed to choose the applicable scope, whereas since 2013 a uniformscope has been applied. For more information see the report “EEA Trends and Projections in the EU ETS
2018” (15).
In light of the adoption of a Resolution by the 2016 ICAO Assembly on the global Carbon Offsetting and
Reduction Scheme for International Aviation (CORSIA) the EU has decided to maintain the geographic
scope of the EU ETS limited to intra-EEA flights from 2017 onwards. The EU ETS for aviation will be
subject to a new review in the light of the international developments related to the operationalisation
of CORSIA. The next review should consider how to implement the global measure in Union law through
a revision of the EU ETS legislation. In the absence of a new amendment, the EU ETS would revert back
to its original full scope from 2024.
Therefore, in December 2017 a regulation has been adopted (16). From 2021 onwards, the same linear
reduction factor as for stationary installations shall apply to aviation operators. In the Regulation it is laid
down that the Commission is required to report to the European Parliament and the Council on the
implementation of the global market-based measure (GMBM) and to consider a revision of the EU ETS
Directive.
Size of entities
In the EU ETS data viewer, it is possible to limit the data to entities of a certain size category. An
overview of the possible choices is presented below.
Table 7-1 Size definitions
Size Emission values
large Entities with verified emissions higher than 500 000 t CO2
medium Entities with verified emissions comprised between 50 000 and 500 000 t CO2
small Entities with verified emissions comprised between 25 000 and 50 000 t CO2
mini Entities with verified emissions lower than 25 000 t CO2
zero Entities with verified emissions equal to 0
unknown Entities where verified emissions are unknown
All sizes All entities
The EUTL does not contain information on the size of an entity. As an approximation, the maximum
emissions of an entity over the time series are used to define its size.
Number of entities
The viewer can show the number of entities. A good indicator of whether an entity is participating in the
system in a given year is that it is not excluded and that it has any ETS information in that year.
Therefore, the number of entities only takes into account entities which are not excluded and for which
(15) https://www.eea.europa.eu/publications/trends-and-projections-in-the
(16) http://eur-lex.europa.eu/legal-content/EN/TXT/PDF/?uri=CELEX:32017R2392&from=ENETS information (emissions, allocations or total surrendered units) are available in the year shown (including the reporting of zero emissions).
Measures
The unit in which the information is downloaded from the EUTL is the tonne of CO2 equivalent and the
emission trading unit — emission allowance or emission credit — one unit being equivalent to one tonne
of CO2.
The EU ETS data viewer also offers the option to change the output values in kilo tonnes of CO2
equivalents or million tonnes of CO2 equivalents.
Gases
By default the ETS covered only CO2 emissions in the first two trading periods (with the exemption of
some smaller opt-ins in the second trading period). Since 2013, N2O from the production of nitric, adipic
and glyoxylic acid and PFC emissions from aluminium production are also included.
As all allowances and verified emissions are reported in CO2 equivalent, it is not possible to distinguish
whether an installation emitted CO2, N2O, PFC or a combination of gases.
Annex I – Correction of freely allocated allowances
11.1. Stationary installations
The amount of freely allocated allowances recorded in the EUTL has been corrected manually for six
countries (see Table 11-1).
Free allocation to installations in Austria and France has been corrected downwards as these
countries have bought EUAs from the market and allocated these to new entrants. Therefore, the
amount of free allocation recorded in the EUTL is higher than the amount of EUAs initially issued by
these two countries.
In Germany, some operators gave back their free allocation and it was not possible to correct this in
the EUTL.
Similarly, an excess of allowances on closed accounts was deleted in Denmark, which was not
recorded in the EUTL.
For Spain, the overall quantity recorded is correct, however, a correction is applied to its distribution
across years.
Finally, the EUTL does not contain any information on free allocation to Bulgarian installations in
2007.
Table 11-1 Corrections to freely allocated allowances for stationary installations2005 2006 2007 2008 2009 2010 2011 2012
million EUA
Austria 0.58 -1.56 -1.56 -1.86 -3.48
Bulgaria 39.70
Denmark -0.08 -0.08 -0.08 -0.08 -0.08
France -5.41 -5.41 -5.41
Germany -0.96 -0.96 -0.96 -0.96 -0.96
Spain 0.26 0.69 -0.95
11.2. Aviation
EUAAs allocated for free for the year 2012 had to be returned by aviation operators if they chose to
account for the reduced scope of the stop the clock decision. For the analysis of verified emissions of
aviation operators in the year 2012, it is therefore necessary to reflect the amount of allowances
returned following this decision, which is not recorded in the EUTL. The amount which had to be
returned is publicly available on operator level. The European Commission has sent the according excel
file with amounts which have to be returned. On the basis of this file and the EUAAs allocated for free as
shown in the EUTL, returned allowances can be calculated on MS level as displayed in the right column in
Table 11-2.Table 11-2 Adjustment to freely allocated allowances for aviation operators in the year 2012
Original allowance Adjusted allowance
Adjustment
Country 2012 2012
EUAA
Austria 1.932.411 682.958 1.249.453
Belgium 3.056.619 1.753.311 1.303.308
Bulgaria 269.245 261.881 7.364
Cyprus 461.758 275.834 185.924
Czech Republic 798.821 798.821 -
Germany 42.770.182 13.521.585 29.248.597
Denmark 1.074.189 1.045.920 28.269
Estonia 58.429 35.249 23.180
Spain 9.488.760 3.802.703 5.686.057
Finland 2.109.537 782.793 1.326.744
France 20.022.081 7.724.503 12.297.578
United Kingdom 54.783.369 12.858.960 41.924.409
Greece 717.685 691.075 26.610
Croatia 66.442 66.442 -
Hungary 1.097.418 1.085.442 11.976
Ireland 7.012.841 7.012.245 596
Iceland 434.617 209.720 224.897
Italy 4.909.375 2.481.235 2.428.140
Liechtenstein
Lithuania 55.953 55.953 -
Luxembourg 2.311.181 2.311.181 -
Latvia 311.520 221.198 90.322
Malta 212.330 197.164 15.166
Netherlands 12.369.053 4.018.267 8.350.786
Norway 1.068.510 1.014.306 54.204
Poland 651.131 254.866 396.265
Portugal 2.111.265 773.001 1.338.264
Romania 380.258 335.568 44.690
Sweden 3.144.641 3.144.575 66
Slovenia 82.534 44.556 37.978
Slovakia 55.051 55.051 -
Total 173.817.206 67.516.366 106.300.840Annex II - Auctioning
EUAs auctioned or sold by governments are not recorded in the EUTL. For the first and second trading
period the number of EUAs auctioned or sold by governments has been collected from publications from
the respective countries, as well as auction reports published by the trading platforms on which the
auctions are carried out. Table 12-1 summarises the amount of EUAs auctioned or sold by countries
during the first and second trading period and includes the relevant sources (17). Some countries
(Belgium, Bulgaria, Czech Republic, Denmark, Hungary, Lithuania, Luxembourg, Norway, Poland and
Romania) sold/auctioned allowances relative to the second trading period in the first months of 2013.
These were mainly EUAs remaining in the new entrants reserve or unused EUAs set aside for UN backed
emission reduction projects. These volumes are added to the 2012 figures (redistributed amounts; see
Table 12-1 below).
Table 12-1 EUAs (1st and 2nd trading period) auctioned or sold, 2005 to 2013
Auctions/sales
Auctions/sales concluded
redistributed
Sources
1st trading phase 2nd trading phase 2nd trad. phase
2005 2006 2007 2008 2009 2010 2011 2012 2013 2012 2013
Austria 0.4 0.4 0.2 1.0 1.0 www.climex.com
Belgium 9.6 9.6 www.eex.com
Bulgaria 0.1 0.1 www.eex.com
Cyprus
Czech Republic 1.0 1.6 2.6 www.eex.com
Denmark 4.4 2.8 2.8 http://greenstream.dev.aucor.fi/content/greenstream-
network-appointed-trustee-sell-2775-million-euas-
behalf-danish-state
Estonia
Finland
France
Germany 49.1 41.1 41.1 40.7 48.1 48.1 www.bmu.de, www.dehst.de
Greece 10.0 8.8 8.8 http://www.helex.gr/index2.php?option=com_content
&task=view&id=2239&pop=1&page=0&Itemid=10554
Hungary 1.2 1.2 2.5 5.2 7.7 www.euets.com; www.eex.com
Iceland
Ireland 1.2 0.2 0.2 0.2 www.pointcarbon.com, www.ec.europa.eu
Italy
Latvia
Liechtenstein
Lithuania 0.6 0.9 1.7 0.8 2.5 www.eex.com
Luxembourg 0.0 0.0 www.eex.com
Malta
Netherlands 8.0 4.0 4.0 4.0 www.eex.com
Norway 12.6 6.3 6.3 9.6 0.1 9.8 Email from Norwegian financial department.
Poland 0.2 0.2 http://www.gpw.pl/wydarzenia_en/?ph_tresc_glowna_
start=show&ph_tresc_glowna_cmn_id=50140
Portugal
Romania 0.6 0.6 www.eex.com
Slovakia
Slovenia
Spain
Sweden
United Kingdom 4.0 25.0 35.8 30.7 27.3 27.3 http://www.dmo.gov.uk/index.aspx?page=ETS/Auctio
nInfo
(17) Auctions in Germany in 2008 include sales of 8.125 million EUA by the KfW to compensate for costs of the
replenishment of the NER in period I. Source (page 69):
http://www.dehst.de/cln_162/SharedDocs/Downloads/Publikationen/Auswertung__1__Handelsperiode,templateId=
raw,property=publicationFile.pdf/Auswertung_1_Handelsperiode.pdf
Working Paper - ETC/CME 22From the third trading period onwards, a much larger share of allowances is auctioned. Volumes can be
derived from auction calendars and auction reports published by the two exchanges that carry out
auctions of allowances for the third trading period: The European Energy Exchange (EEX) and the
Intercontinental Exchange (ICE) (18). However, auctions scheduled for a certain year may take place in an
earlier or later year, due to technical or procedural reasons. To prevent delays to the timing of auctioning
from significantly distorting annual trends, auctioned allowances have partly been redistributed in the
third trading period. The following special cases have to be taken into account:
In 2012 so-called “early auctions” of third trading period EUAs were held. The volumes of these
auctions were equal to 90 million EUA and are added to 2013 auctioning volumes in the data viewer.
Part of the new entrants reserve for the third trading period (NER300: 300 million EUAs in total) was
auctioned to generate financial support for CCS and innovative renewable energy projects. These
NER300 sales were carried out in two tranches; the first tranche of 210.6 million (sold in 2011 and
2012) is attributed to 2013, while the second tranche of 89.5 million EUAs (sold at the end of
2013/beginning of 2014) is attributed to 201419.
In a change from the previous years of reporting, auctioning volumes of both EUAs and EUAAs will no
longer be further redistributed and only the auction sales that have been concluded will now be referred
to in the data viewer. Given that the MSR will start operation in 2019, the decision has been taken to
only refer to auction sales that have been concluded so that the information provided in the data viewer
is aligned to future publications by the Commission on the total number of allowances in circulation,
which is a key parameter influencing the operation of the MSR. The tables below summarise auctioned
or sold amounts of EUAs and EUAAs for the years 2012 to 2019.
(18) www.eex.com; www.theice.com
(19) Summary report on the monetisation of 300 million EU allowances (EUAs), European Investment Bank.
http://www.eib.org/ attachments/ ner_summary_report_en.pdf
Working Paper - ETC/CME 23Table 12-2 Auctions concluded (2012 – 2019) (Mio. EUAs)
Auctions (concluded)
2012 2013 2014 2015 2016 2017 2018 2019
AT Austria 1,6 12,7 8,8 10,0 11,2 13,7 13,5 7,4
BE Belgium 26,1 16,1 18,2 20,4 24,9 24,6 14,4
BG Bulgaria 3,3 12,0 6,1 15,9 16,2 22,6 23,8 17,8
HR Croatia 11,3 3,8 4,7 4,6 2,9
CY Cyprus 0,2 0,1 0,1 1,1 1,6 1,0
CZ Czech Republic 18,6 9,4 14,5 22,4 34,6 37,8 25,6
DK Denmark 0,2 12,7 8,0 9,0 10,1 12,3 12,1 6,6
EE Estonia 4,1 1,2 2,8 4,5 6,8 9,1 5,8
FI Finland 2,0 15,2 10,6 12,0 13,4 16,4 16,2 8,8
FR France 6,4 49,9 34,8 39,3 44,0 53,8 53,1 28,9
DE Germany 23,5 182,6 127,1 143,9 160,8 196,8 172,2 127,6
GR Greece 2,3 33,4 22,0 24,9 27,9 34,1 33,6 20,5
HU Hungary 0,6 7,8 9,5 10,8 12,1 14,8 14,5 9,2
IS Iceland 0,9
IE Ireland 9,6 5,9 6,7 7,5 9,2 9,1 4,9
IT Italy 11,3 87,9 61,2 69,3 77,4 94,7 93,4 51,7
LV Latvia 0,3 2,5 1,7 1,9 2,2 2,6 2,6 1,7
LI Liechtenstein 0,0
LT Lithuania 0,5 4,5 2,9 3,7 3,9 5,4 5,2 3,4
LU Luxembourg 0,1 1,1 0,8 0,9 1,0 1,2 1,2 0,7
MT Malta 0,0 1,0 0,6 0,7 0,8 1,0 1,0 0,6
NL Netherlands 3,9 30,6 21,3 24,1 26,9 32,9 32,5 17,7
NO Norway 18,5
PL Poland 51,2 13,3 17,1 25,6 85,9 78,0 103,9
PT Portugal 1,6 16,5 11,2 12,6 14,1 17,3 17,0 10,3
RO Romania 5,9 27,9 16,5 25,4 36,8 45,2 46,5 30,4
SK Slovakia 1,8 14,0 9,7 11,1 12,4 15,1 14,9 9,9
SI Slovenia 0,5 4,0 2,8 3,2 3,6 4,4 4,3 2,6
ES Spain 10,1 78,8 54,8 62,1 69,3 84,9 83,7 49,8
SE Sweden 1,0 8,1 5,6 6,4 7,1 8,8 8,6 5,0
UK United Kingdom 12,3 95,1 66,2 75,0 80,3 106,0 101,1
NER300 210,6 89,5
EU-28 89,7 808,1 528,4 632,7 715,3 951,2 915,8 588,5
Total 89,7 1018,7 617,8 632,7 715,3 951,2 915,8 588,5Table 12-3 Auctions of aviation allowances concluded (2012 – 2019) (Mio. EUAAs)
Auctions concluded
2012 2013 2014 2015 2016 2017 2018 2019
Austria 0,196 0,336 0,123 0,097 0,115 0,115
Belgium 0,341 0,383 0,140 0,111 0,131 0,131
Bulgaria 0,037 0,130 0,047 0,038 0,044 0,044
Croatia 0,069 0,031 0,025 0,029 0,030
Cyprus 0,050 0,202 0,074 0,058 0,069 0,069
Czech Republic 0,078 0,170 0,062 0,049 0,058 0,058
Denmark 0,194 0,386 0,141 0,111 0,132 0,132
Estonia 0,007 0,022 0,008 0,007 0,008 0,008
Finland 0,136 0,303 0,111 0,087 0,104 0,103
France 1,674 1,731 0,633 0,498 0,591 0,591
Germany 2,500 2,229 0,858 0,676 0,801 0,802
Greece 0,183 0,710 0,260 0,205 0,242 0,243
Hungary 0,048 0,141 0,052 0,041 0,048 0,048
Iceland 0,070
Ireland 0,145 0,305 0,112 0,088 0,104 0,104
Italy 0,873 2,049 0,749 0,590 0,700 0,700
Latvia 0,024 0,076 0,028 0,022 0,026 0,026
Liechtenstein
Lithuania 0,010 0,041 0,015 0,012 0,014 0,014
Luxembourg 0,105 0,032 0,012 0,010 0,011 0,011
Malta 0,017 0,081 0,030 0,024 0,028 0,028
Netherlands 0,911 0,524 0,191 0,151 0,179 0,179
Norway 0,685
Poland 0,434 0,120 0,095 0,112 0,113
Portugal 0,212 0,411 0,150 0,119 0,140 0,140
Romania 0,054 0,227 0,083 0,066 0,077 0,078
Slovakia 0,008 0,028 0,011 0,008 0,010 0,010
Slovenia 0,008 0,020 0,007 0,006 0,007 0,007
Spain 1,093 2,320 0,848 0,669 0,792 0,793
Sweden 0,171 0,517 0,189 0,149 0,177 0,176
United Kingdom 2,708 2,521 0,921 0,726 0,860
Total 2,500 9,278 16,391 5,998 4,731 5,602 5,503
Working Paper - ETC/CME 25Annex III – Estimates to reflect current ETS scope for stationary installations
The EU ETS started in 2005 covering only CO2 emissions from the EU-25 countries. In 2007, Bulgaria and
Romania joined the EU and its ETS. Installations from Liechtenstein and Norway entered the scheme at
the start of the second trading period in 2008. At the same time, additional installations from already
participating countries started to be covered by the scheme, due to the end of opt-outs and to the
clarification of the definition of combustion installations. At the start of the third trading period in 2013,
stationary installations from Croatia and Iceland started to be covered by the EU ETS. At the same time, a
range of new activities (and gases) were included, in particular N2O emissions from the production of
nitric and adipic acid, glyoxal and glyoxylic acid and PFC emissions from the production of aluminium.
Figure 13-1 Scope of the EU ETS since 2005
To reflect these changes in scope, six types of estimates were applied to ETS verified emissions in order
to derive a time-series for stationary installations starting from 2005 consistent with the scope of the
third trading period (see Figure 13-1).
Estimates to reflect the scope of the second trading period:
An estimate for Bulgaria and Romania entering the EU ETS. This is relevant in 2005 and 2006 and was
calculated using inventory emissions and EUTL verified emissions for these countries in 2007-2009.
An estimate for Liechtenstein and Norway entering in 2008. Their historical emissions in 2005 were
taken from the respective NAP and combined with 2008 verified emissions from the EUTL.
An estimate for changes in scope between the first and second trading period related to opt-outs
and the clarification of the definition of combustion installations. This estimate was performed using
information stemming from the process to determine annual allocation allowances (AEAs) under the
ESD.
Estimates to reflect the scope of the third trading period:
o An estimate for Croatia entering the EU ETS in 2013. Data stemming from the process to
determine annual allocation allowances (AEAs) under the ESD was used to estimate for
Working Paper - ETC/CME 26ETC/ACM Technical Paper 2014/7 March 2015
Croatia’s emissions in 2005–2012, combined with 2013 verified emissions data and
inventory emission trends for this country.
o An estimate for non-CO2 gases entering in 2013. For this purpose, historic emissions in
the relevant source categories were taken from GHG inventories and converted to CO2
equivalent units.
o An estimate for CO2 emissions of installations which fell into the scope of the EU ETS
from 2013 onwards.
o Two countries, Norway and Slovenia, have provided the authors with bottom-up
calculated figures to reflect current ETS scope. These are considered to be more accurate
than any top-down approach can be and are thus used in further work of the EEA and
the EEA EU ETS data viewer.
The estimates to reflect current scope (see Table 13-1) is applied both to verified emissions and
allocated allowances. It does not address changes related to the inclusion or exclusion of individual
installations within trading periods (e.g. new entrants and closures). No estimate was quantified for
aviation.
The methodology applied by EEA to quantify the estimates to reflect the current ETS scope by
participating country is documented in detail in an ETC/ACM technical paper20.
(20) see information section at https://www.eea.europa.eu/data-and-maps/dashboards/emissions-trading-viewer-1ETC/ACM Technical Paper 2014/7 March 2015
Table 13-1 Estimates to reflect current ETS scope for stationary installations in the EU ETS data
viewer
1st trading period 2nd trading period
2005 2006 2007 2008 2009 2010 2011 2012
Mt CO2 / Mio. EUAs
Austria 2.7 2.7 2.6 2.3 2.1 1.9 1.9 1.8
Belgium 11.2 10.2 9.5 4.3 4.3 4.6 3.4 3.4
Bulgaria 37.9 37.9 1.9 1.9 1.5 1.5 1.5 1.3
Croatia 12.4 12.5 13.6 12.7 11.1 10.5 10.4 9.5
Cyprus 0.0 0.0 0.0 0.0 0.0 0.0 0.0 0.0
Czech Republic 3.7 3.5 3.3 3.3 3.1 2.9 2.9 2.9
Denmark 0.0 0.0 0.0 0.0 0.0 0.0 0.0 0.0
Estonia 0.2 0.2 0.2 0.0 0.0 0.0 0.0 0.0
Finland 2.5 2.3 2.4 2.1 1.3 0.7 0.6 0.7
France 22.9 22.0 21.3 15.2 14.3 12.3 11.5 11.1
Germany 43.9 43.1 45.3 32.7 32.6 24.1 23.2 22.6
Greece 2.4 2.3 2.3 2.2 2.1 2.2 2.2 2.0
Hungary 3.4 2.8 2.3 0.0 0.0 0.0 0.0 0.0
Iceland 1.8 2.1 2.0 2.1 1.8 1.8 1.6 1.6
Ireland 0.3 0.3 0.3 0.4 0.4 0.4 0.3 0.3
Italy 21.5 16.5 15.7 8.7 8.7 8.0 7.3 7.1
Latvia 0.0 0.0 0.0 0.0 0.0 0.0 0.0 0.0
Liechtenstein 0.0 0.0 0.0 0.0 0.0 0.0 0.0 0.0
Lithuania 4.9 4.9 5.5 5.2 3.0 2.9 3.2 2.8
Luxembourg 0.3 0.3 0.3 0.3 0.3 0.3 0.3 0.3
Malta 0.0 0.0 0.0 0.0 0.0 0.0 0.0 0.0
Netherlands 11.2 11.1 9.8 1.7 1.6 1.6 1.6 1.5
Norway 26.8 26.2 27.5 7.4 5.1 6.2 6.0 6.0
Poland 18.2 18.0 18.0 12.2 9.1 9.0 8.8 8.7
Portugal 2.0 1.9 1.9 1.1 0.9 0.9 0.7 0.6
Romania 72.2 72.1 9.0 7.3 6.8 7.2 7.1 6.8
Slovakia 3.8 4.1 3.9 2.0 1.8 1.6 1.1 1.0
Slovenia 0.0 0.0 0.0 -0.1 -0.1 -0.1 -0.1 0.0
Spain 16.6 9.9 9.6 9.5 9.2 8.6 8.3 8.0
Sweden 4.1 4.0 3.8 2.1 1.8 1.9 1.7 1.5
United Kingdom 32.3 31.7 23.4 2.7 1.4 1.5 0.4 0.2European Topic Centre on Climate change The European Topic Centre on Climate change
mitigation and energy mitigation and energy (ETC/CME) is a consortium of
Boeretang 200 European institutes under contract of the European
Environment Agency.
B-2400 Mol, Belgium
Tel.: +32 14 33 59 77
Email: etccme@vito.beYou can also read


