Predicting Early Detection of Cardiac and Diabetes Symptoms using Data Mining Techniques
←
→
Page content transcription
If your browser does not render page correctly, please read the page content below

2012 2nd International Conference on Computer Design and Engineering (ICCDE 2012)
IPCSIT vol. 49 (2012) © (2012) IACSIT Press, Singapore
DOI: 10.7763/IPCSIT.2012.V49.20
Predicting Early Detection of Cardiac and Diabetes Symptoms using
Data Mining Techniques
Ashwinkumar.U.M1 and Dr Anandakumar.K.R2
1
Reva Institute of Technology and Management, Bangalore
2
S J B Institute of Technology, Bangalore
Abstract. The aim of this paper is to find the symptoms of cardiac and diabetes using data mining
technology by using the method of Decision Tree and Incremental Learning at the early stage. Decision tree
is one kind of inductive learning algorithms that offers an efficient and practical method for generalizing
classification rules from previous concrete cases that already solved by domain experts. Recently, many
researchers have been reported to endow decision trees with incremental learning ability, which is able to
address the learning task with a stream of training instances. The objective of the classification is to assign a
class to find previously unseen records as accurately as possible. If there is a collection of records and each
record contains a set of attributes, then one of the attributes is class. The motive is to find a classification
model for class attributes, where a test set is used to determine the accuracy of the model. The given data set
is divided into training and test sets. The training set used to build the model and test set is used to validate it.
Classification process consists of training set that are analyzed by a classification algorithms and the
classifier or learner model is represented in the form of classification rules. Test data are used in the
classification rules to estimate the accuracy. The learner model is represented in the form of classification
rules, decision trees. We got Ethical clearance from BGS Hospital for using the datasets .These datasets were
gathered from the patient files which were recorded in the medical record section of the BGS Hospital
Bangalore.
Keywords: Id3, C4.5,Datamining
1. Introduction
The role of IT in health care is well established. Knowledge Management in Health care offers many
challenges in creation, dissemination and preservation of health care knowledge using advanced technologies.
Pragmatic use of Database systems, Data Warehousing and Knowledge Management technologies can
contribute a lot to decision support systems in health care. Knowledge discovery in databases is well-defined
process consisting of several distinct steps. Data mining is the core step, which results in the discovery of
hidden but useful knowledge from massive databases. A formal definition of Knowledge discovery in
databases is given as follows: “Data mining is the non trivial extraction of implicit previously unknown and
potentially useful information about data”. Data mining technology provides a user- oriented approach to
novel and hidden patterns in the data. The discovered knowledge can be used by the healthcare
administrators to improve the quality of service. The discovered knowledge can also be used by the medical
practitioners to reduce the number of adverse drug effect, to suggest less expensive therapeutically
equivalent alternatives.
1.1. Classification Techniques in Healthcare.
The objective of the classification is to assign a class to find previously unseen records as accurately as
possible. If there is a collection of records and each record contains a set of attributes, then one of the
attributes is class. The motive is to find a classification model for class attributes, where a test set is used to
determine the accuracy of the model. The given data set is divided into training and test sets. The training set
Corresponding author. E-mail address: ashwinkumar.um@gmail.com.
106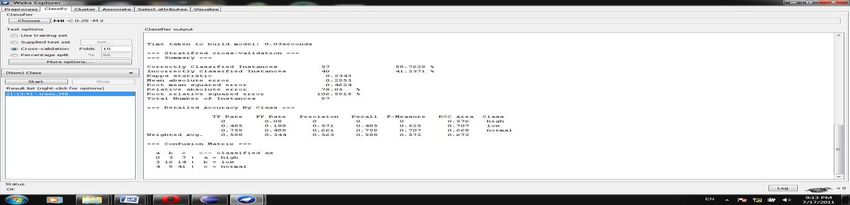
used to build the model and test set is used to validate it. Classification process consists of training set that
are analyzed by a classification algorithms and the classifier or learner model is represented in the form of
classification rules. Test data are used in the classification rules to estimate the accuracy. The learner model
is represented in the form of classification rules, decision trees or mathematical formulae [11].
    Decision trees can be used to classify new cases. They can construct explicit symbolic rules that
generalize the training cases. New cases can then be classified by comparing them to the reference cases.
Classification method can also be applied on Digital mammography images to predict a class of categories.
The concept of Classification method has been applied in the study of Diabetes. Diabetes is a opportune
disease for data mining technology for a number of factors, the huge amount of data is there and diabetes is a
common disease that costs a great deal of money. Diabetes is a disease that can produce terrible complication
such as thus blindness, kidney failure and premature cardiovascular death. Healthcare administers would like
to know how to improve outcomes as much as possible.
     There are two main types of diabetes mellitus. Type-1 occurs before age 30, although it may strike at any
age. The person with this type is usually thin and needs insulin injections to live and dietary modification to
control his or her blood sugar levels. Type-2 occurs in obese adults over age 40. It is treated with diet and
exercise, the blood sugar level is lowered with drugs. Children with insulin-dependent diabetes mellitus of
Type-1 were diagnosed. Type-1 (insulin dependent) diabetes mellitus is a chronic disease of the body
metabolism characterized by an inability to produce enough insulin to process carbohydrates, fat and protein
efficiently. Treatment of this disease requires insulin injection.

1.2 Scope of Data Mining
    There are a lot of applications in data mining fields. Classification and association are most common
problems in data mining for knowledge extraction and machine learning. Regression and classification are
also important tools for estimation and prediction. Because human has very limited viewpoint of intuitive
and visual understandability on problems with large dimension or huge size of databases, the visualization of
data mining is recently emphasized in practices. Some special purposes of data mining are currently
processed such as text mining or web mining, for a new search technique in World Wide Web multimedia or
texture mining for image processing, and spatial mining for the time-series analysis specially the text mining
is one of good approaches for natural language processing. Fig 1.3 shows the scope of data mining fields.
Many techniques or solutions for data mining and knowledge discovery in databases are very widely
provided for classification, association, clustering and regression, search, optimization, etc. In detail top-
down induction of decision trees, CART, fuzzy logic and artificial neural networks, or some statistical
methods are applicable for a classification problem. For association, k-nearest neighbors and radial-based
neural networks are well-known examples. Recently CMAR has been provided for a new association rules.
     For clustering, it is available to use self-organization map, vector quantization, genetic algorithm (GA),
etc. For regression principal component analysis, or support vector machines for regression can be used.

                Problem Category:                                           Environment & Preprocess:
             Classification / Clustering /                                 Database and data Warehousing
               Association / Search /                                          Parallel & Distributed
             Regression / Optimization                                              Techniques
                                                                            Automated discovery agents

                                                   DATA MINING

                    Techniques:                                                     Applications:
                 Statistics /TDIDT                                          Machine learning / Text Mining
               AI or Expert System                                            Estimation and Prediction
             Fuzzy Logic & ANN/PCA                                             Visualization of Mining
            Heuristics (SA,GA,VQ, etc.,                                      Spatial/Texture/Multimedia
                                                                                       Mining
                                         Figure 1.0 The Scope of Data mining

                                                        107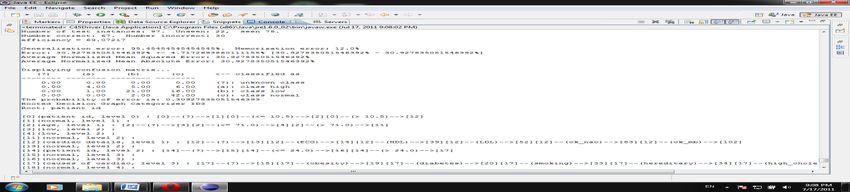
This project framework is designed to predict the early detection of cardiac and diabetics symptoms, improve
performance, availability and reliability of mission critical applications, by increasing data set of the
application. The implementation of this project framework is based on monitoring Java applications.

2.0 WEKA Tool
    Waikato Environment for Knowledge Analysis, called shortly WEKA, is a set of state-of-the art data
mining algorithms and tools to in-depth analyses. The author of this environment is University of Waikato in
New Zealand. The programming language of WEKA is Java and its distribution is based on GNU General
Public License. These complex algorithms may be applied to data set in the aim of detailed analyses and
evaluation of data mining examination. There are three main ways of WEKA use. First is analyzing data
mining methods‟ outputs to learn more about the data; next is generation of model for prediction of new
instances and finally the last but most important for this master‟s thesis feature, comparison of data mining
methods in order to chose the best one as a predictor e.g. in Medical Decision Support System.
     WEKA consists of four user interfaces out of which three are graphical and one command line. The main
interface is called Explorer. It is graphical interface built of menu section and six panels connected to various
data mining methods. It enables data preprocessing, classification, clusterization, and mining associations
among attributes. Furthermore there is a possibility to select attributes with the attribute evaluator and search
method. The last option is visualization plotting the dependencies among attributes. The next graphical
interface, Knowledge Flow is dedicated to selecting components from the tool bar and placing them on the
special canvas, connecting them into directed graph than processing and analyzing. Furthermore the data
stream data processing can be designed and executed with the usage of this interface. To compare
performance of data mining algorithms it is useful to chose third graphical interface called Experimenter.
This module allows one to evaluate how well various data mining methods perform for given datasets. This
process is automated and statistics can be saved. This module is a most important part of the experiment. It
makes in-depth statistics which are useful in case of medical datasets. After the selection of various methods,
their parameters and datasets, it is possible to prepare statistic which are priceless in case of medical
diagnosis support. Experimenter and Explorer are two mainly used interfaces during master‟s thesis
experiments. WEKA allows analyzing the data sets saved in the .arff files what can be easily achieved by
converting .txt files in the way presented in Figure 5.5.1. The file with data has a structure of decision table,
it begins with the name of the table, than names and types of attributes are declared, finally observed
attributes‟ values are typed. This uncomplicated document structure allows one to upload to the environment
prepared in this way own dataset and analyze it.

                                      @ relation diabetes
                                      @attribute pregnant real
                                      @attribute plasma real
                                      @attribute diastolic real
                                      @attribute triceps real
                                      @attribute insuline real
                                      @attribute mass real
                                      @attribute pedigree real
                                      @attribute age real
                                      @attribute diabetes {1,0}

                                      @data

                                      6,148,72,35,0,33.6,0.627,50,1
                                      1,85,66,29,0,26,6,0.351,31,0
                                      8,183,64,0,0,23.3,0.672,32,1
                                      1,89,66,23,94,28.1,0.167,21,0
                                      0,137,40,35,168,43.1,2.288,33,1

                                       Fig 2.1 Sample .arff file for WEKA

                                                      108
3.0 Methods
3.0.1 i+Learning Algorithm
Unlabeled Example
Learning ?
- +
+ -
+ Learner Classifier
- -
+ +
We aim to produce an +/-
accurate classifier
Label
Fig 3.1 Learning Method
i+Learning theory is a new attempt that contributes the incremental learning community by means of
intelligent, interactive, and dynamic learning architecture, which complements the traditional incremental
learning algorithms in terms of performing knowledge revision in multiple dimensions.
The algorithm grows an on-going decision tree with respect to either the new incoming instances or
attributes in two phases:
Primary Off-line (POFC-DT)
Construction of Decision Tree (POFC-DT): a fundamental decision tree construction phase in batch
mode that is based on the existing database, where a C4.5-like decision tree model is produced.
Incremental On-line Revision of Decision Tree (IONR-DT)
An incoming of the new instances or attributes, this phase is responsible for merging the new data into
the existing tree model to learn incrementally the new knowledge by tree revision instead of retraining from
scratch.
3.0.2 C4.5 Algorithm
C4.5 is an algorithm used to generate a decision tree developed by Ross Quinlan. C4.5 is an extension of
Quinlan's earlier ID3 algorithm. The decision trees generated by C4.5 can be used for classification, and for
this reason, C4.5 is often referred to as a statistical classifier. C4.5 starts with large sets of cases belonging to
known classes. The cases, described by any mixture of nominal and numeric properties, are scrutinized for
patterns that allow the classes to be reliably discriminated. These patterns are then expressed as models, in
the form of decision trees or sets of if-then rules that can be used to classify new cases, with emphasis on
making the models understandable as well as accurate. The system has been applied successfully to tasks
involving tens of thousands of cases described by hundreds of properties.
Basic construction of C4.5 decision tree is as follows:
The root nodes are the top node of the tree. It considers all samples and selects the attributes that are
most significant.
The sample information is passed to subsequent nodes, called „branch nodes‟ which eventually
terminate in leaf nodes that give decisions.
Rules are generated by illustrating the path from the root node to leaf node.
109C4.5 builds decision trees from a set of training data in the same way as ID3, using the concept
of information entropy. The training data is a set S = {s_1, s_2, ...} of already classified samples. Each
sample s_i = {x_1, x_2, ...} is a vector where x_1, x_2, represent attributes or features of the sample. The
training data is augmented with a vector C = {c_1, c_2, ...} where c_1, c_2, ... represent the class that each
sample belongs to. C4.5 uses the fact that each attribute of the data can be used to make a decision that splits
the data into smaller subsets. C4.5 examines the normalized information gain (difference in entropy) that
results from choosing an attribute for splitting the data. The attribute with the highest normalized information
gain is the one used to make the decision. The algorithm then recurs on the smaller sub lists.
In pseudo code, the general algorithm for building decision trees is:
1. Check for base cases
2. For each attribute a
3. Find the normalized information gain from splitting on a
4. Let a best be the attribute with the highest normalized information gain
5. Create a decision node that splits on a best
6. Recur on the sub lists obtained by splitting on a best, and add those nodes as children of node.
3.0.2.1 Features of C4.5 Algorithm
There are several features of C4.5. Some features of C4.5 algorithm are discussed below[12].
Continuous Attributes Categorization: Earlier versions of decision tree algorithms were unable to
deal with continuous attributes. „An attribute must be categorical value‟ was one of the preconditions
for decision trees. Another condition is „decision nodes of the tree must be categorical‟ as well.
Decision tree of C4.5 algorithm illuminates this problem by partitioning the continuous attribute value
into discrete set of intervals which is widely known as „discretization‟. For instance, if a continuous
attribute C needs to be processed by C4.5 algorithm, then this algorithm creates a new Boolean
attributes Cb so that it is true if Csequence of attributes‟ values and a decision that is based on these attributes. Such a tree is built of nodes
which specify conditional attributes – symptoms S={s1,s2,……sl} branches which show the values of i.e. the
h-th range for i-th symptom and leaves which present decisions D={d1…….dk} and their binary values Wdk
={0,1}. A sample decision tree is presented in the Fig 3.2.
s1
v1,1 v1,3
v1,2
s2 s3 d3=1
v2,1 v2,2 v3,1 v3,2
d1=1 d1=0 d2=1 d2=0
Fig 3.2 Sample Decision Tree
The algorithm is as follows:
The ID3 algorithm is used to build a decision tree, given a set of non-categorical attributes C1, C2, .., Cn,
the categorical attribute C, and a training set T of records.
function ID3 (R: a set of non-categorical attributes,
C: the categorical attribute,
S: a training set) returns a decision tree.
Begin
If S is empty, return a single node with value Failure.
If S consists of records all with the same value for the categorical attribute, return a single node with
that value.
If R is empty, then return a single node with as value the most frequent of the values of the
categorical attribute that are found in records of S
Let D be the attribute with largest Gain(D,S) among attributes in R.
Let {dj| j=1,2, .., m} be the values of attribute D.
Let {Sj| j=1,2, .., m} be the subsets of S consisting respectively of records with value dj for attribute
D.
Return a tree with root labeled D and arcs labeled d1, d2, .., dm going respectively to the Trees.
ID3(R-{D}, C, S1), ID3(R-{D}, C, S2), .., ID3(R-{D}, C, Sm);
End ID3;
3.0.2.1 The ID3 metrics
The algorithm is based on Occam's razor: it prefers smaller decision trees (simpler theories) over larger
ones. However, it does not always produce the smallest tree, and is therefore a heuristic. Occam's razor is
formalized using the concept of information entropy:
Entropy
Entropy is used to determine which node to split next in the algorithm. The higher the entropy,the higher
the potential to improve the classification here. Entropy of 0 identifies a perfectly classified set.
n
E ( S ) fs ( j ) log 2 fs ( j )..........................................(3.1)
j 1
where:
E(S) is the information entropy of the set S ;
n is the number of different values of the attribute in S (entropy is computed for one chosen
attribute)
fS(j) is the frequency (proportion) of the value j in the set S
log2 is the binary logarithm.
111Gain
Gain is computed to estimate the gain produced by a split over an attribute Gain quantifies the entropy
improvement by splitting over an attribute: higher is better.
m
G( S , A) E ( S ) fs ( Ai) E ( SAi)..................3.2
i 1
where:
G(S,A) is the gain of the set S after a split over the A attribute
E(S) is the information entropy of the set S
m is the number of different values of the attribute A in S
fS(Ai) is the frequency (proportion) of the items possessing Ai as value for A in S
Ai is ith possible value of A
SA is a subset of S containing all items where the value of A is Ai
4.0 Results And Discussions.
On successful execution of the programs, in this project the display of various operations done on
Medical center is shown below. Various data sets are created to show the results.
Fig. 4.1 C4.5 result of cardiac and diabetes data
Fig. 4.2 J48 result of cardiac and diabetes data set
112Fig. 4.3 ID3 result for cardiac symptoms
4.1 Comparison of Efficiency of C4.5 with various Algorithms
Fig 4.4 Comparison of Efficiency of C4.5 with Various Algorithms (Cardiac & Diabetics)
This results represents comparison of c4.5 along with various algorithms like J48, Naï
ve Bayes, and
CART. Data sets are compared in order to find the efficiency of C4.5 algorithm.
Fig 4.5 Comparison of Efficiency of C4.5 with Various Algorithms (Cardiac)
Fig 4.6 Comparison of Efficiency of C4.5 with Various Algorithms (Diabetics)
The above results represents comparison of c4.5 along with various algorithms like J48, Naï
ve Bayes,
and CART. Data sets are compared in order to find the efficiency of C4.5 algorithm.
113Fig 4.7 Comparison of Efficiency of C4.5 with Various Algorithms (Cardiac)
Fig 4.8 Comparison of Efficiency of C4.5 with Various Algorithms (Diabetics)
5.0 Conclusion and Future Work
This Paper has proposed a novel learning algorithm i+Learning as well as i+LRA, which apparently
achieves the highest classification accuracy over ID3 algorithm. The solid evidence manifests that
i+Learning as well as i+LRA do superior to other incremental learning algorithms not only on the
classification accuracy, but also be able to handle the incremental learning regarding the new incoming
attribute other than the new instance only without sacrificing the learning performance. i+Learning can
successfully mimic the learning style in real world, which is real time and dynamic in multiple dimensions
that includes both new input attributes and instances.
In addition, the incremental learning strategy is able to accelerate the training time and meanwhile new
knowledge can be accumulated or revised without forgetting the old one. However, there is no perfect
algorithm, which is also true to i+Learning. The major limitation of our method is the adoption of binary tree
rather than multi-branch tree. Such structure increases the tree size, whereas an attribute can be selected as a
decision node for more than once in a tree. For that reason, binary trees tend to be less efficient in terms of
tree storage requirements and test time requirements, although they are easy to build and interpret.
In the future work of our research, it would be valuable that i+Learning model can be extendable for
classifying multi-label class problem, in which an instance belongs to multiple classes simultaneously.
Moreover, the incremental learning method with respect to new output classes in addition to instances and
attributes is another influential consideration in future i+Learning model.
6.0 References
[1] D. Michie, “Machine Learning and Knowledge Acquisition”, International Handbook of Information
Technology and Automated Office Systems, Elsevier Science Publishers, North-Holland, 1985.
[2] P.E. Utgoff, “ID5: An Incremental ID3”, Proceedings of the 5th International Conference on Machine
Learning, Ann Arbor, MI, pp. 107-120, 1988.
[3] P.E. Utgoff, “Incremental Induction of Decision Trees”, Machine Learning, Vol. 4, No. 2, pp. 161-186,1989.
[4] Kononenko, “Inductive and Bayesian Learning in Medical Diagnosis”, Applied Artificial Intelligence, Vol. 7,
pp. 317-337, 1993.
[5] P.E. Utgoff, “An Improved Algorithm for Incremental Induction of Decision Trees”, Proceedings of the 11th
International Conference on Machine Learning 1994,
114[6] Morgan Kaufmann, New Brunswick, NJ “Efficient Incremental Induction of Decision Trees”, Department of
Computation, UMIST, PO Box 88, Manchester, M60 1QD, U.K., Department of Computation ., pp. 318-325,
1994.
[7] D. Kalles, and T. Morris, “Efficient Incremental Induction of Decision Trees”, Machine Learning, Vol.24, No.
3, pp. 231-242, 1996
[8] P.E. Utgoff, N.C. Berkman, and J.A. Clouse,“Decision Tree Induction Based on Efficient Tree Restructuring”,
Machine Learning, Kluwer Academic Publishers, Vol. 29, pp. 5-44, 1997.
[9] T. Hastie, R. Tibshirani, and J. Friedman, The Elements of Statistical Learning: Data Mining, Inference, and
Prediction, Springer-Verlag, New York, 2001.
[10] D. Kalles, and T. Morris, “Efficient Incremental Induction of Decision Trees”, Machine Learning, Vol. 24,
No. 3, pp. 231-242, 1996. S.U. Guan, and S.C. Li, “Incremental Learning with Respect to New Incoming
Input Attributes”, Neural Processing Letters, Vol. 14, pp. 241-260, 2001
[11] Z.H. Zhou, and Z.Q. Chen, “Hybrid Decision Tree”, Knowledge-Based Systems, Vol. 15, pp. 515-528, 2002.
[12] Y.L. Chen, C.L. Hsu, and S.C. Chou, “Constructing a Multi-Valued and Multi-Labeled Decision Tree”, Expert
Systems with Applications, Vol. 25, pp. 199-209, 2003.
[13] Y. Li, Z.T. Liu, L. Chen, X.J. Shen, and X.H. Xu, “Attribute-based Incremental Formation Algorithm of
Concept Lattice”, Mini-micro Systems, Vol. 25, No.10, pp.1768-1771, 2004.
[14] Harleen Kaur and Siri Krishan Wasan, “ Empirical Study on Applications of Data Mining Techniques in
Healthcare”, Journal of Computer Science 2 (2): 194-200, 2006, ISSN 1549-3636, 2006 Science Publications.
[15] Sam Chao, Fai Wong “An incremental decision tree learning methodology regarding attributes in Medical
Data Mining”, Faculty of Science and Technology, University of Macau, Taipa, Macau,2009.
[16] Mohammed M Mazid, A B M Shawkat Ali, Kevin S Tickle “Input space reduction for Rule Based
Classification” School of Computing Science Central Queensland University AUSTRALIA, Issue 6, Volume
7, June 2010
[17] Kantardzic, Mehmed (2003). Data Mining: Concepts, Models, Methods, and Algorithms. John Wiley & Sons.
[18] Cabena, Peter, Pablo Hadjnian, Rolf Stadler, Jaap Verhees and Alessandro Zanasi (1997) Discovering Data
Mining: From Concept to Implementation.
[19] Y. Yuan and M.J. Shaw, Induction of fuzzy decision trees Fuzzy Sets and Systems 69 (1995), pp. 125–139.
115You can also read


