Aircraft data, Covid-19 and global weather forecasting - ECMWF webinar, 20 January 2021 Bruce Ingleby
←
→
Page content transcription
If your browser does not render page correctly, please read the page content below
Aircraft data, Covid-19 and
global weather forecasting
ECMWF webinar, 20 January 2021

Bruce Ingleby
ECMWF

Bruce.Ingleby@ecmwf.int

                                    2010                    2020

                                 © ECMWF January 21, 2021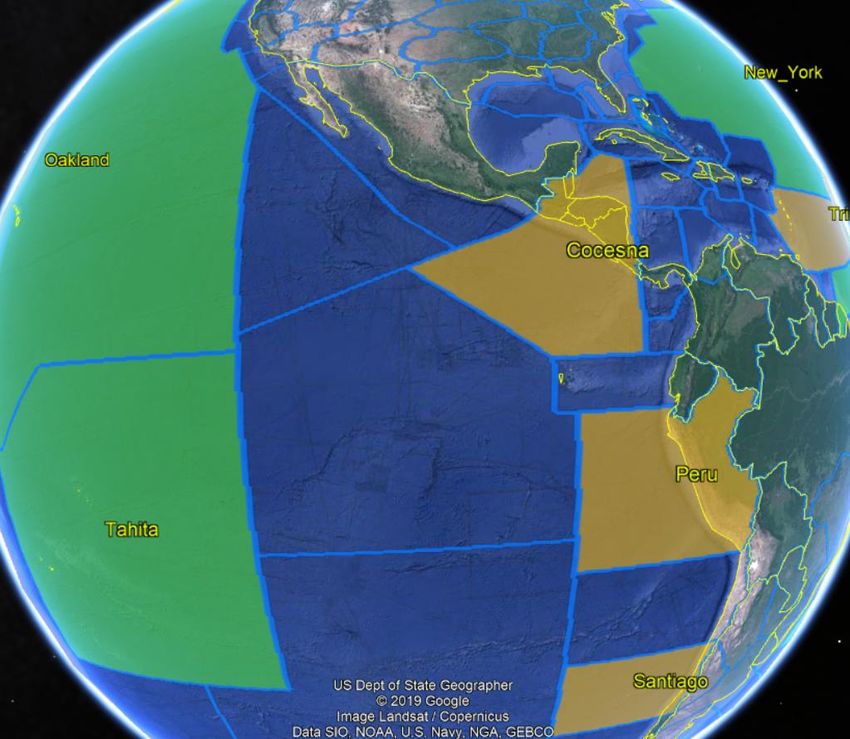
Overview
• Impact of Covid-19 (via drop in aircraft numbers)
   • Impact of aircraft data (data denial experiment)
   • Forecast skill during 2020 (no clear drop)
• Changes to observation usage, mitigation attempts                Part 1
   • Use of European Mode-S aircraft data
• Estimates of aircraft impact from FSOI

• What do aircraft measure?
• Aircraft temperature biases
                                                                   Part 2
• Aircraft metadata
• Filling in the gaps

• Summary
              EUROPEAN CENTRE FOR MEDIUM-RANGE WEATHER FORECASTS            2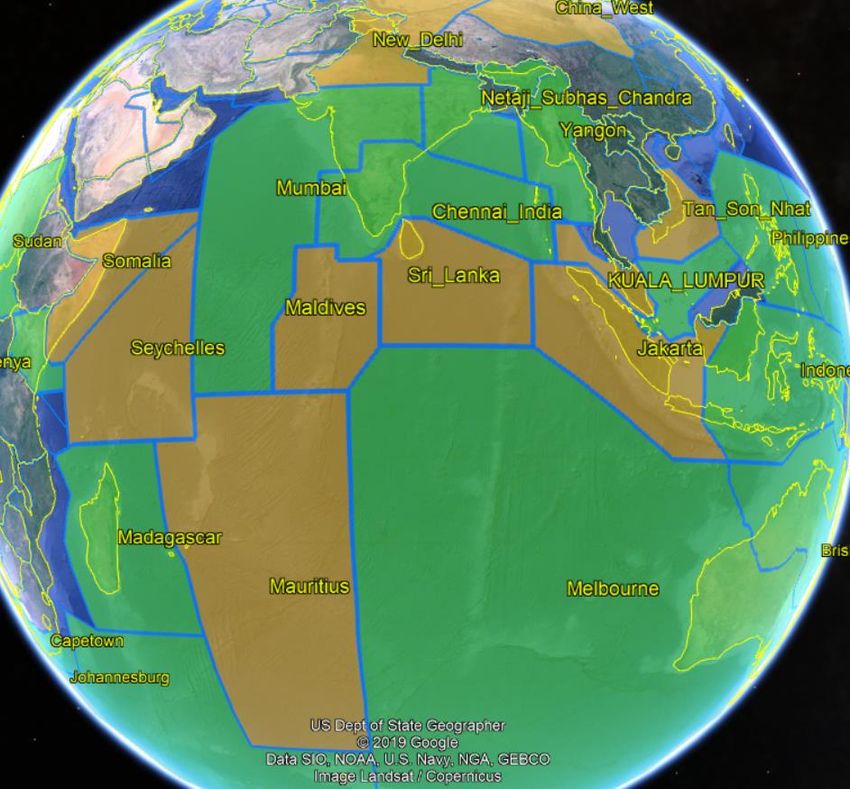
With thanks to
• ECMWF: Lars Isaksen, Mohamed Dahoui, Thomas Haiden, Martin Janouscek, Alan
Geer, Cristiano Zanna, Marijana Crepulja, Tomas Kral
• ESoWC (2019): Mickey Yun Chan
• Met Office (UK): Stewart Taylor, Steve Stringer (E-AMDAR), Brett Candy, John Eyre,
Warrant Tennant
• NOAA/NCEP (US): Chris Hill, Curtis Marshall (US-AMDAR), Daryl Kleist
• BoM (AU): Fiona Smith, Peter Steinle, Chris Tingwell
• KNMI (NL): Siebren de Haan, Jan Sondij (EMADDC Mode-S data), Jitze van der Meulen
• FLYHT (CA/US): Meredith Bell (AFIRS+TAMDAR data)
• Rockwell Collins (US): Alan Williard
• CMC (CA): Yulia Zaiseva
• NRL (US): Pat Pauley
• WMO: Dean Lockett
• Others…
                         EUROPEAN CENTRE FOR MEDIUM-RANGE WEATHER FORECASTS            3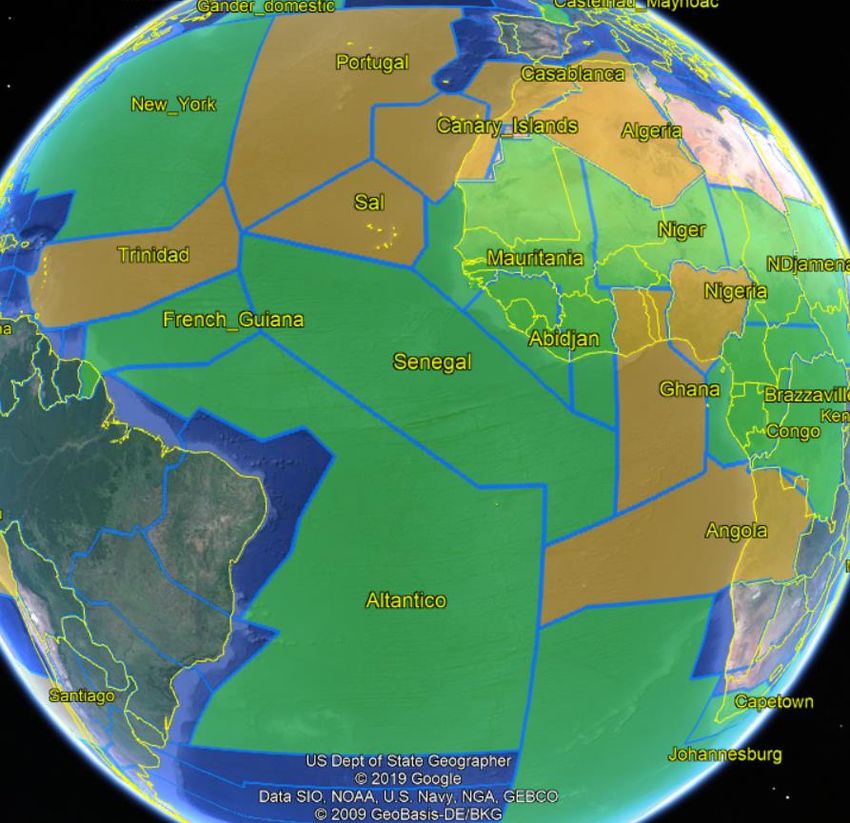
Flavours of aircraft data (use the same measurements)
• AIREP: Aircraft Report (alphanumeric), originally voice report to ATC (Air Traffic Control)
• ADS-C: Automated ‘Contract’ reports to ATC, oceanic/remote regions, from 2014
   • Some are converted to AIREPs, some to AMDAR BUFR format               BUFR ADS-C were
• AMDAR: Aircraft Meteorological Data Relay, coordinated by WMO            separated from AMDARs
                                                                           in July 2020 at ECMWF
   • Started in 1986, 12 programmes now, largest is U.S. program (MDCRS)
   • 43 airlines have agreements with NMSs to provide AMDAR reports
   • Many use ACARS transmission methods to reach the ground
   • GTS: (Older alphanumeric format.) New binary (BUFR) formats.

• TAMDAR: originally NASA+AirDat, then Panasonic, now FLYHT
   • Focus on short/medium-haul aircraft, includes RH sensor

• AFIRS (as AMDAR): satcomms system developed by FLYHT
• Mode-S (EHS): ‘Broadcast’ messages available in some ATC areas
   • All aircraft have to provide data if pinged

                EUROPEAN CENTRE FOR MEDIUM-RANGE WEATHER FORECASTS                         4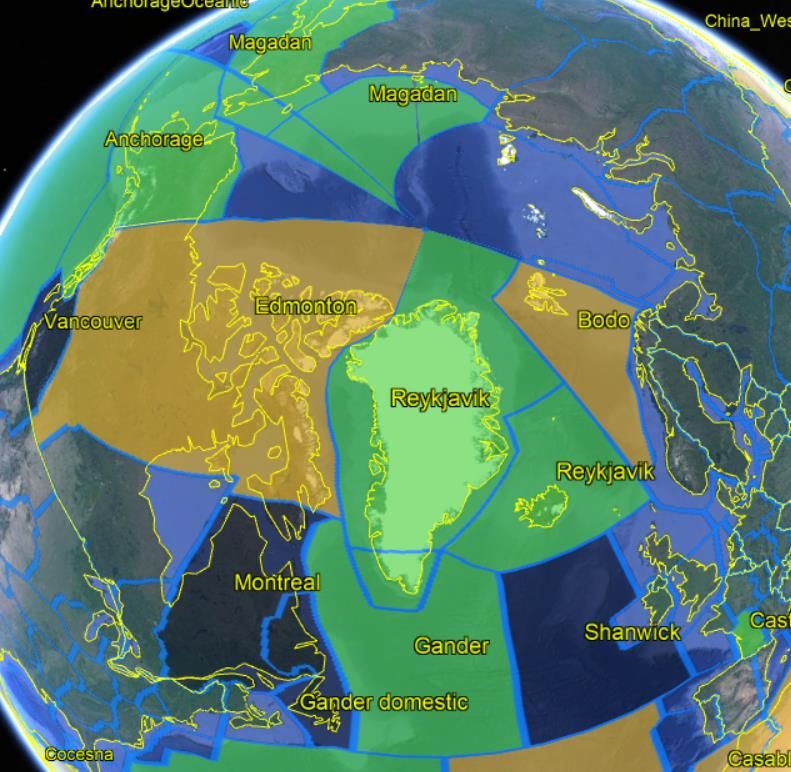
b) March 4
 Impact of Covid-19 on aircraft reports
• Mid-March to Mid-April global numbers of
AMDAR+ADS-C+AIREP dropped by 75%
• Long-haul very badly hit, cargo less so
• Back to almost 50% by July but ~constant since
• ECMWF started using Mode-S winds over Europe
                                                                    c) April 29
(green line below) – only about 5% of those available
• Recent months: European numbers declining again,
numbers in Southern hemisphere increasing

     Mar 4   Apr 29                                Nov 25

                                                                    d) Nov 25

                            EUROPEAN CENTRE FOR MEDIUM-RANGE WEATHER FORECASTS    5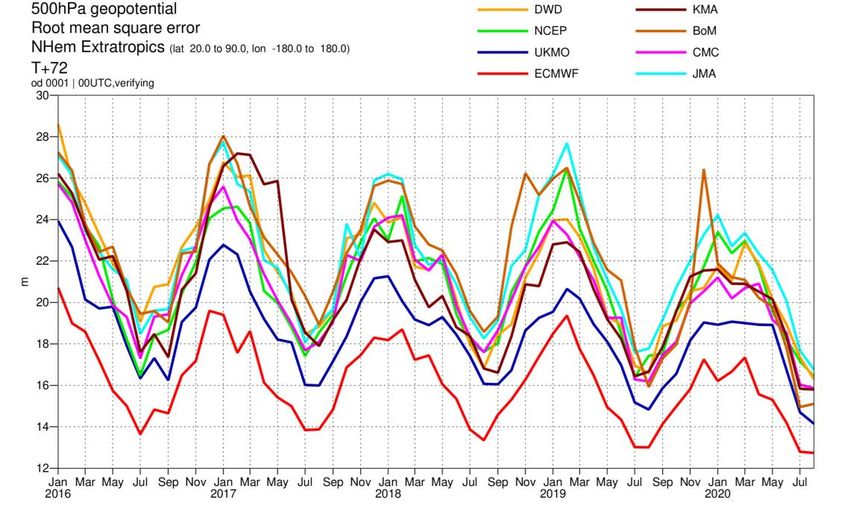
Aircraft reports by region
    • hi                                                               Tropics

 North America

                                                  ECMWF omit 25% of reports due to:
                                                                     Southern
                                                  a) Thinning/duplicate removalHemisphere
                                                  b) Known problems (e.g. near surface)
                                                  c) Real-time QC (disagreement with forecast
Europe (not Mode-S)                                  background)
Europe (not Mode-S)

                 EUROPEAN CENTRE FOR MEDIUM-RANGE WEATHER FORECASTS                             6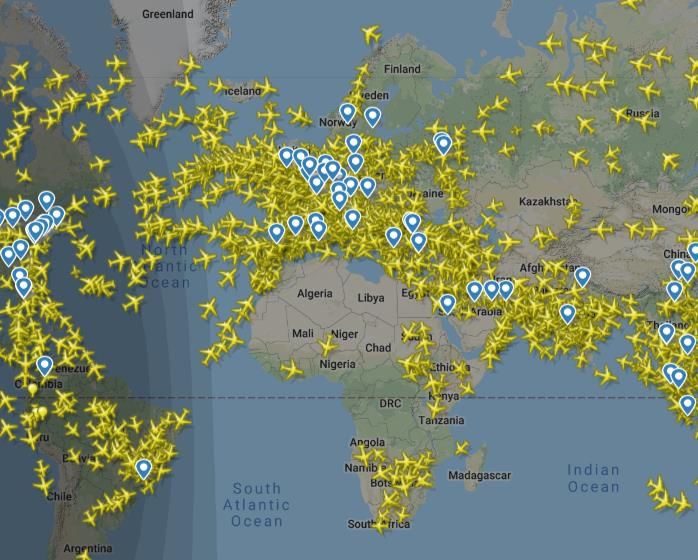
Vs Analyses
 Impact from aircraft data denial                                 T+12                T+72          T+120

• OSE: Observing System Experiment
• ECMWF IFS, 3 months in 2019
• Control – all data
• NoAircraft: top plot and black line in b,c)
                                                                   T+12 vs NH sonde T T+12 vs NH sonde wind
• NoAircraftT(emperature), red line in b,c)

• Biggest impact is ~250 hPa in NH almost
10% worse vs sonde T, 13% vs sonde wind
• Most of the impact (even on T) comes
from the aircraft winds

• Ingleby et al (2020, GRL)

                              EUROPEAN CENTRE FOR MEDIUM-RANGE WEATHER FORECASTS                            7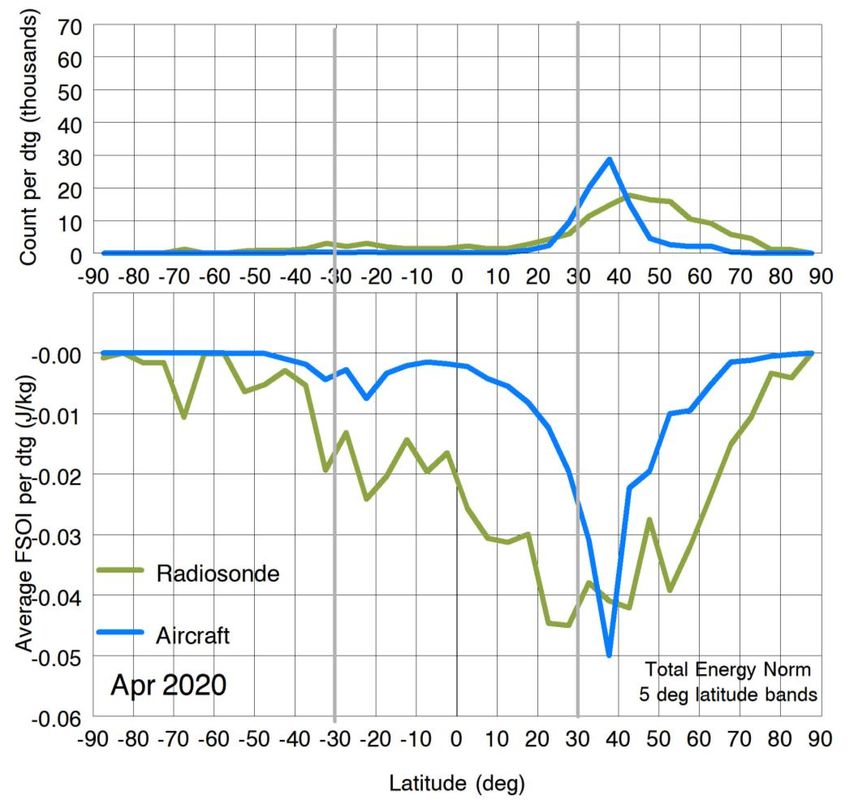
Aircraft numbers drop
Can we see the impact in 2020?                                                                 2020
                                                                 Wind T+24
 • Not really in verification scores!?
    • Partly due to residual aircraft reports

 • T+24 250 hPa NH vector wind rms in red
 • 250 hPa is near jet level, lower errors at                   Mar 1                Apr 5             May 5
 500 hPa and 100 hPa
                                                                                              2019
 • Day-to-day noise plus seasonal/annual
 variations (2019 more predictable in NH?)

         Z500 T+72

                                                                                              2018

                                EUROPEAN CENTRE FOR MEDIUM-RANGE WEATHER FORECASTS                             8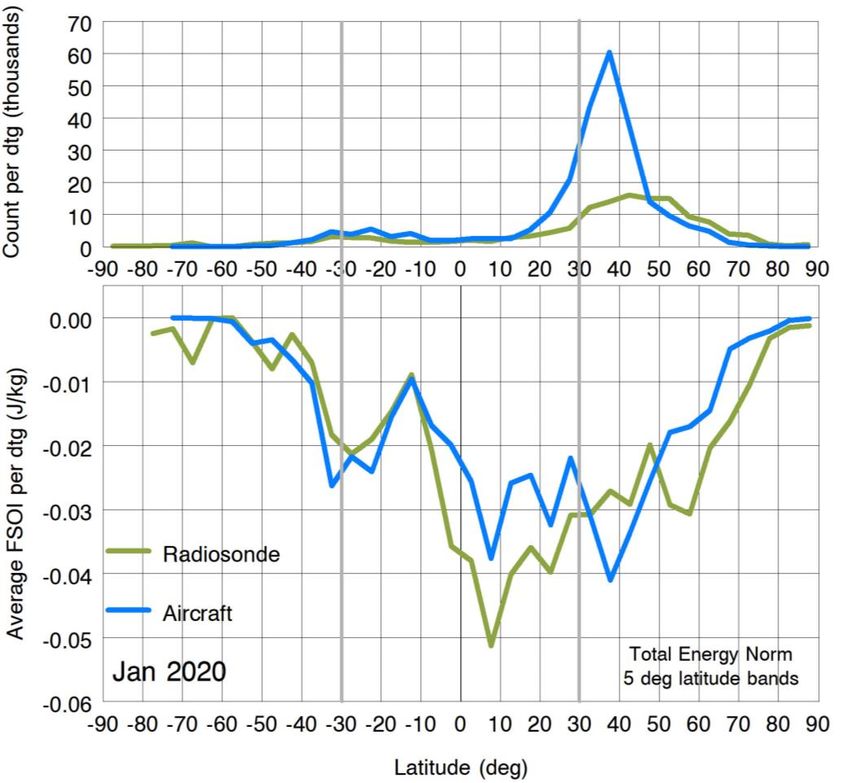
Discussion
• James & Benjamin (2017, MWR): aircraft data most important observations
over North America (Rapid Refresh system)
• James et al (2020, JAMC): 20% of aircraft give >20% of impact of all aircraft
• Chen (2020, GRL) ‘COVID‐19 pandemic imperils weather forecast’
• Ingleby et al (2020, GRL): ‘The impact of Covid-19 …: a balanced view’
   • Authors from ECMWF, Met Office (UK), NCEP (USA), BoM (Australia)
   • Chen’s comparison of 2020 with previous years is ‘oversimplistic’
   • Importance of satellite data, variations in forecast skill

• Riishojgaard (2020, WMO Bulletin, 69 (2)) ‘Impacts of COVID-19 Restrictions’
   • Minor reductions in surface and radiosonde reports in some regions

• Sorenson et al (2021, AMS101) Effects on regional FSOI

• Bauer et al (2015, Nature): ‘quiet revolution’ – improvements in global NWP

                                EUROPEAN CENTRE FOR MEDIUM-RANGE WEATHER FORECASTS   9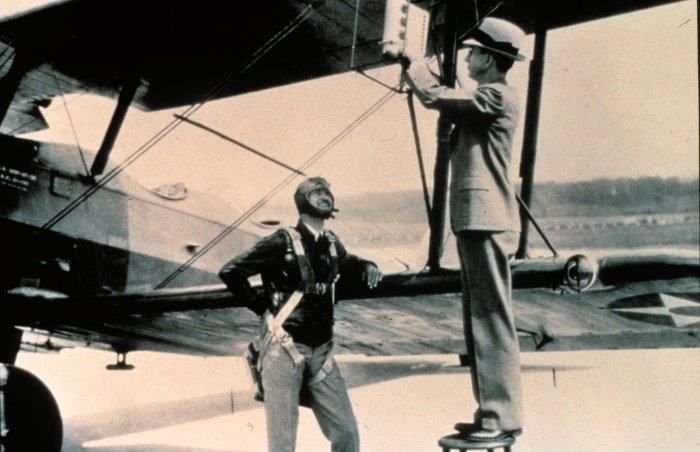
Changes to ECMWF observation usage in 2020
• Mid-January started using Aeolus wind data (Business As Usual)
• 25 March started using COSMIC-2 Radio Occulation (RO) – BAU
• April-August – extra radiosonde ascents from some European stations
• 13 May to end Sept use of Spire RO data
• June started use of FLYHT aircraft data (AFIRS+TAMDAR)
• Mid-June started use of German radiosonde descent data
• 27 July started use of European Mode-S aircraft winds
   • Pan-European ‘test’ product processed by KNMI (NL)
   • Both KNMI and ECMWF accelerated development/implementation
   • Air traffic control messages: De Haan (2011)
   • Wind: similar quality to AMDAR, temperature – more mixed
   • Also included ‘fix’ for ADS-C/AIREP B787 wind direction error

                          EUROPEAN CENTRE FOR MEDIUM-RANGE WEATHER FORECASTS   10
What is Mode-S?
• Mode-S EHS (De Haan, 2011; Sondij, 2020 EUMETNET/ECMWF workshop)
• Some ATC systems ping aircraft for additional information
• All aircraft have to respond (every 4-30 seconds): very dense data
• Mode-S EHS was not designed for meteorological reporting
• Temperature not included, can be derived from Mach number, but the precision is poor
especially at low levels (can be mitigated by clever averaging – De Haan)
• Aircraft heading (needed for winds) is reported wrt magnetic North* not true North (correction
needed, *depends on date of aircraft look-up tables)
• Despite this the wind quality is close to that of AMDAR reports
• Mode-S MRAR
• These were designed as meteorological reports
• Only available from limited number of aircraft in South-East Europe
EUROPEAN CENTRE FOR MEDIUM-RANGE WEATHER FORECASTS 11European coverage including Mode-S
• November 25: 12 hours, used data
• AMDAR samples small % of flights
• Mode-S samples all flights within range
(only 5% of reports used at ECMWF, still too
many? Weighting?)
• Over N Atlantic most data provided by
ADS-C/AIREP
• In last 6 months more Mode-S receivers
have been set up (SE Europe, Norway,
Moscow)
EUROPEAN CENTRE FOR MEDIUM-RANGE WEATHER FORECASTS 12Impact of Mode-S: T+12 fit to European radiosondes
• Largest impact over Europe - expected
• Larger than seen in earlier LAM tests –
partly because Mode-S is being used over
a wider area
• Verification against analyses is ~neutral
• Minor bias effects and/or analysis
increments outside an area with very
dense observations??
• Biggest impact on winds at cruise level
and less impact of T data – as seen for all
aircraft data on hemispheric scale
EUROPEAN CENTRE FOR MEDIUM-RANGE WEATHER FORECASTS 13B787 wind problem
• Error in ADS-C/AIREP wind direction (sign of
v) for B787 winds from certain directions
(details from C Hill, NOAA).
Nasty, frustrating QC problem
• 2018 rejected wind from known B787s
(550+ identifiers) – throws out good data too
• No metadata on aircraft type in reports:
we now know type for a subset of aircraft
• Simple “correction” of v-winds (AIREP and
ADS-C) implemented in 2020 - imperfect
• 90% of bad winds in North Atlantic – but little
impact there – lots of good winds too
• More impact in South Pacific: fewer flights
EUROPEAN CENTRE FOR MEDIUM-RANGE WEATHER FORECASTS 14FSOI % for 2020 • Forecast sensitivity to observation impact: estimate of how important obs subsets are for T+24 forecast • RO: steps from start of COSMIC-2+Spire, Spire stopped end Sept • Aircraft: drop in Mar/Apr then ~level • Recent increase: seasonal or SH? (next) • Aeolus: 3 or 4% (gaps)
Total (-)FSOI by region                                   FSOI/datum by region

• More impact per report in data sparse areas
• Wind data particularly important in the tropics
• Recovery in tropics + southern hemisphere has disproportionate impact

• Mode-S (not included in figures): 12.5% of FSOI from ~50% of aircraft obs
                EUROPEAN CENTRE FOR MEDIUM-RANGE WEATHER FORECASTS                16
Total (-)FSOI by type Sep 2020 FSOI/datum by type
• Biggest contribution from AMDAR7: mainly Americas + Europe (dense)
• 2nd contribution from ADS-C (oceanic cruise data) – largest per datum
• AMDARa (old formats): AU, JP, CN, CA, ZA
• Again impact per report is largest for data sparse regions
EUROPEAN CENTRE FOR MEDIUM-RANGE WEATHER FORECASTS 17Timeliness is vital! Quite good for aircraft ☺
• ECMWF uses 4DVar with a
12 hour assimilation window
• Observations near the end
of the window have more
impact on forecast quality!
See figure (from TM 855)
• This is a real effect, shown
using satellite OSEs by
McNally (2019)
• NWP centres need 00/12 radiosonde
observations as early as data (less impact)
possible ☺
European Centre for Medium-Range Weather Forecasts 18Aircraft and radiosonde FSOI: vertical profiles
• ECMWF data (dry energy norm), Pauley and Ingleby (2021)
• Aircraft (dashed): biggest impact ~250 hPa from winds (as seen in OSEs)
• NOGAPS and Met Office have larger FSOI for radiosondes than aircraft
EUROPEAN CENTRE FOR MEDIUM-RANGE WEATHER FORECASTS 19Aircraft and radiosonde FSOI by latitude
Jan 2020 Apr 2020
Count
FSOI
• Data from NOGAPS (total energy norm), adapted from Pauley & Ingleby (2021)
• Jan 2020: moderate aircraft impact 40°S-20°N despite relatively few obs
• Apr 2020: aircraft numbers and impact collapse South of 25°N (and Arctic)
EUROPEAN CENTRE FOR MEDIUM-RANGE WEATHER FORECASTS 20Part 2
• ‘Economics’ of aircraft observations
• What do aircraft measure?
• Thanks to Steve Stringer (EUMETNET) for slides
• Aircraft temperature biases
• Aircraft metadata
• Filling in the gaps
EUROPEAN CENTRE FOR MEDIUM-RANGE WEATHER FORECASTS 21Economics of Aircraft Based Observations (ABO)
• Aircraft measure wind and temperature for their own purposes
• AMDAR: meteorological services only pay communication costs
• Reports are relatively cheap (especially over land, need satcomms over ocean)
• U.S. takes all reports, Europe/others select e.g. 1 profile per airport per 3 hours
• NMSs have limited control over metadata and quality
• Can block particularly poor data and feedback to airlines
• Airlines benefit from improved weather forecasts:
• Safety aspects (e.g. turbulence, take-off and landing, icing)
• Efficiency: where possible routes are chosen to maximise tail-winds and minimise
head-winds
• 9 Feb 2020: fastest subsonic New York to London flight, 4 h 56 min (80 min early)
• Fuel load chosen to match forecast flight time (+safety margin)
EUROPEAN CENTRE FOR MEDIUM-RANGE WEATHER FORECASTS 22Global ABO: What is actually measured & reported by aircraft?
What is measured: Pressure

Pressure (and speed) is measured by standard aircraft sensors known as
Pitot-static tubes
What is measured: Pressure (Altitude)

• Static pressure is used to calculate pressure altitude (PALT)
• Static pressure (normal air pressure) and dynamic pressure (caused by
  flight) can be used together to calculate the aircraft’s speed as a Mach
  number (M)
• Temperature is measured by a Total Air Temperature (TAT) probe
• Sensor faces into the airflow and brings air to a stop inside the sensor where
  its temperature is measured
What is measured: Temperature

Conversion of kinetic energy causes the air to warm (20° or more).
This warmer value is known as the Total Air Temperature (TAT)

This is then converted into Static Air Temperature (SAT) by onboard
software, which is equivalent to the true external air temperature
(Complications/less accuracy during turns or turbulence)
Static Air Temperature (SAT) is a function of sensor probe and Mach
Number (aircraft speed relative to the speed of sound).
Mach Number is derived from total and static pressures
The measurement of the three-dimensional wind vector from an aircraft is a
complicated problem!
Using the aircraft navigation system and the airspeed system (Pitot-static
tubes) together with the TAT sensors, it is possible to estimate – to a high
enough degree of accuracy:
      – The velocity of the aircraft with respect to the ground below it
          (Vg = ground speed)
      – The velocity of the aircraft with respect to the air around it
          (Va = airspeed).           Wind Vector (V) is then given by: V = Vg – Va.

 Va
                        V
What is measured: Sensor Interdependencies
Water Vapour measurements
•  Unlike T and wind, humidity is not required for aircraft operations
    • Need fast response sensor
• AMDAR: WVSS-II, laser sensor measuring specific humidity
    • Installed on ~150 U.S. aircraft, 9 German aircraft (some currently inactive)
• TAMDAR: capacitive sensor measuring relative humidity

• Petersen et al (2016, BAMS) overview
• Hoover et al (2017, W&F) impact of WVSS-II on NCEP system
• Ingleby et al (2019, EC TM 855) impact of WVSS-II and TAMDAR on ECMWF system

WVSS                                                                                 TAMDAR
Aircraft temperature biases
• Ballish and Kumar (BAMS, 2008), Petersen (BAMS,2016):
aircraft biased warm by 0.3-1.0K on average
• Drüe et al (QJRMS, 2008): bias as fn(aircraft type)? Just part of story?
• De Haan et al (2020, EUFAR meeting): convergence of M and T
• Use of VarBC to “correct” the data: ECMWF: Isaksen et al (2012,
Newsletter), NCEP: Zhu et al (2015, MWR)
• Typical fn each aeroplane: Constant + c1*ascent rate + c2*descent rate
• VarBC works somewhat better for satellite data than in situ observations –
primarily due to much larger data volume for a satellite data channel than for
one aeroplane
• VarBC – Is it the best method?
• Better if NWP centres don’t have to bias correct data
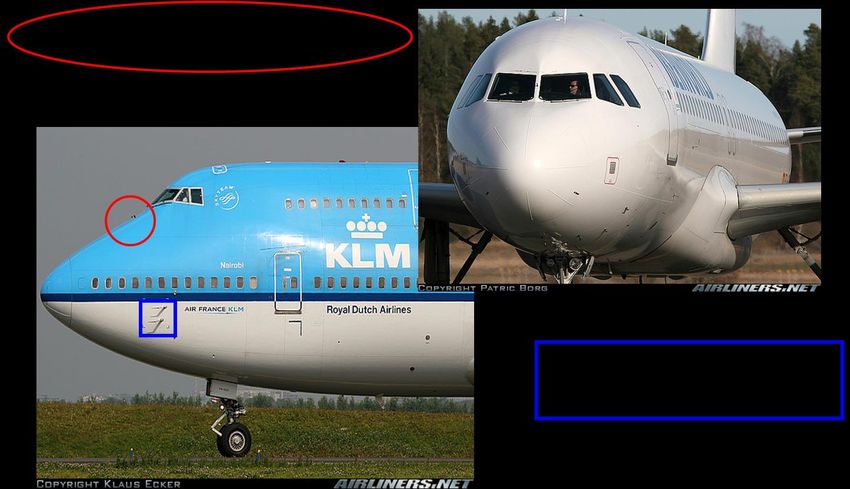
EUROPEAN CENTRE FOR MEDIUM-RANGE WEATHER FORECASTS 32October 2020 ECMWF mean bias correction by type*
*Type information is incomplete but comes from either a) US/EU AMDAR programs or b)
ESoWC 2019 study (with M Chan, M Dahoui) matching flightradar24 to AMDAR tracks.
NOT used in ECMWF VarBC, which uses aircraft identifier, ascent rate and O-B.
Bias is linked to aircraft type (even if the details aren’t clear)
EUROPEAN CENTRE FOR MEDIUM-RANGE WEATHER FORECASTS 33E-AMDAR statistics Apr-Sep 2019 (Jitze van der Meulen)
• T biases: individual
aircraft by type, no QC
• Some differences
between Air France and
other airlines
• AFR: tighter clusters
• Jitze had access to
airline metadata for all
E-AMDAR aircraft
EUROPEAN CENTRE FOR MEDIUM-RANGE WEATHER FORECASTS 34Bias correction methods are useful but imperfect
• Eyre (2015, QJRMS) in the presence of model biases NWP bias correction
schemes work best when there is a large proportion of “anchor” observations
• For temperature radiosondes and GPS-RO form the anchor observations: up to
end of 2019 these data sources were ~constant whereas the data needing bias
correction (satellite soundings and aircraft data) was increasing
• In 2020 the number of aircraft reports crashed and GPS-RO increased significantly
• Even with VarBC assimilation of aircraft data causes a residual bias (next slide)
• Laloyaux et al (2020, QJ) have introduced ‘weak constraint’ in ECMWF stratosphere
• Attempts to use it in troposphere confused aircraft bias with model bias – especially
above (U.S.) airports with lots of reports – slowing forecast improvements
• Can something be done to improve aircraft temperatures “at source”?
• Current accuracy is good enough for airlines but not for NWP and climate
EUROPEAN CENTRE FOR MEDIUM-RANGE WEATHER FORECASTS 35OSE with no aircraft data
200 hPa
• Mean differences between NoAircraft
and Control (T+0 and T+12)
• Largest, most widespread difference at 500 hPa
200 hPa (top) – as expected
• Magnitude ‘only’ 0.15° - but a problem,
despite VarBC
• More localised impacts at lower levels 850 hPa
• Interaction with model bias at low levels
in tropics?
925 hPa
EUROPEAN CENTRE FOR MEDIUM-RANGE WEATHER FORECASTS 36E-AMDAR statistics Apr-Sep 2019 (Jitze van der Meulen)
• Wind direction stats
by aircraft type
• Vector wind shows
some variation by
aircraft type – but less
marked
• Geographic/height
sampling?
• Wind direction very
variable at low speeds
• Scope for lots more
investigation
EUROPEAN CENTRE FOR MEDIUM-RANGE WEATHER FORECASTS 37Aircraft identifiers and anonymisation
• AIREP identifier is flight number (eg BA123 returns as BA124)
• Often the same aircraft type does the same route but not guaranteed
• When AMDAR was set up users wanted aircraft specific ids
• Airlines+pilots didn’t want users to track e.g. delays: anonymisation
• E-AMDAR: EU0001 etc, US-AMDAR/ADS-C: BYBS340A etc (8 characters, end A or Q)
• Over 10000 aircraft identifiers
• One European aircraft can have 3 identifiers (E-AMDAR, ADS-C & Mode-S)
• Anonymisation makes it more difficult to know aircraft type + airline
•
• Since ~2006 the flightaware, flightradar24 etc have provided flight/delay information
openly – nullifying original argument for anonymisation
• Please can airlines provide more metadata (even if not tail numbers)
EUROPEAN CENTRE FOR MEDIUM-RANGE WEATHER FORECASTS 38Improved AMDAR metadata – ESoWC challenge ECMWF Summer of
Weather Code, 2019, with
• AMDAR reports use an anonymised identifier, eg EU0001 Micky Chan and
Mohamed Dahoui
• No information on aircraft type or airline
• A minority of AMDAR reports give departure/arrival airports
• In 2018 ECMWF received E-AMDAR type list + NOAA B787 list
• Can we match online information (eg flightaware.com, available since
~2006) to AMDAR data to provide some of the “missing” metadata?
• We can obtain flight summaries, but only start/end points
• Full flight information N/A unfortunately (could try OpenSky Network)
• AMDAR reports sometimes start/stop in mid-air: makes it difficult or impossible
to deduce the airports (varies by airline/program)
• Extra problems around cities with multiple major airports
• Despite this some progress has been made
• Make AMDAR data look like online lists
• Look at 5-7 days rather than individual flights
EUROPEAN CENTRE FOR MEDIUM-RANGE WEATHER FORECASTS 39DATA SOURCE • FlightRadar24 – on average 200,000 flights are tracked each day Free data for past 7 days with tail number of aircraft. • FlightAware Challenge – We expected to compare en route positions and tried both flightradar24 and flightaware, but had to rely on departure and arrival airport for matching.
Example schematic
• An aircraft operating from Charles De
Gaulle airport, Paris (CDG)
• Long-haul: Singapore, Bombay, …
• Estimated airports: mostly the
ascent/descent is missing so another airport
(eg Brussels) is the closest to first/last
AMDAR
• In some cases it is difficult to determine
from the AMDARs where one flight stops
and another starts
• Know/guess an airline that provides
AMDAR and scrape flight lists for all the
tailnumbers from that airline
• Compare with likely AMDARs
• Visual check for now (automate?)

                           EUROPEAN CENTRE FOR MEDIUM-RANGE WEATHER FORECASTS   42
Preliminary results (for a week in August 2019)
• USA: 1062 aircraft matched (1 wrong – C Hill), ~50% (ADS-C not matched)
• Europe: 505/1186 matched
• Japan: 142/252 matched … (6 other national/regional programs)
• AMDAR: ~50% matched, from 19/19 South Korea (id=tailnumber!) to 0/12
for Canada
• Different matching parameters work best for different programs
• Possible improvements
• Cut down list of airports
• Use machine learning to auto-tune parameters or clever user interface
• Use different sample periods (how to combine results?)
• “Fuzzy matching” of airports round major cities? AI/ML?
EUROPEAN CENTRE FOR MEDIUM-RANGE WEATHER FORECASTS 43Potential uses of metadata
• Quality control (eg B787 wind problem)
• Bias correction (temperature)
• Real time warning systems (ADS-C data missing for 2 days in January 2020,
noted by ECMWF and others, but not by some with ADS-C as subset of AMDAR)
• General monitoring: want meaningful subsets larger than individual aircraft
but smaller than whole AMDAR programme
• Late 2019: realised that ECMWF wasn’t using Hong Kong AMDARs
• Non standard format, now have fix to cope
• ECMWF has just started monitoring regional programmes
• e.g. # of reports from Australian AMDAR programme
EUROPEAN CENTRE FOR MEDIUM-RANGE WEATHER FORECASTS 45Filling in the gaps?
• Global NWP priority (1 report over remote/ocean worth several over USA/Europe)
• 2020: WMO and IATA Collaborative AMDAR Programme (WICAP) established, they
hope to double the numbers of airlines participating
• Early morning gap in flights (some airports considering use of drones during gap)
• In last few years there were short-lived pilot programmes providing AMDAR data
from Papua New Guinea and Leeward Islands, data sparse ☺ – quality OK ☺
• Sadly, both stopped due to lack of funding
• Similar programmes might be supported by new WMO SOFF in future?
• Continued access to TAMDAR+AFIRS?
• Mode-S in remote areas? From satellite??
• ADS-C: globally there are 65 Air Navigation Service Providers (ANSPs)
• 39 provide meteorological reports, 26 do not (Alan Williard, Collins, next slides)
• Technical issues in 5 ANSPs, see Williard presentation (EUMETNET/ECMWF workshop)
EUROPEAN CENTRE FOR MEDIUM-RANGE WEATHER FORECASTS 46Arctic ANSPs supporting ADS-C protocol
ANSP regions with
periodic ADS-C contracts
enabling MET group
ANSP regions with
periodic ADS-C contracts
NOT enabling MET group
Exception regions: ADS-C
present, but not available
to AMDAR
Google Earth
US Dept of State Geographer
Rockwell Collins/ARINC Proprietary http://gis.icao.int/GEOPDF/FIR2013.kml
and Confidential. Collins Aerospace Proprietary. This document contains no export controlled technical data.
478
Pacific Ocean ANSPs supporting ADS-C protocol
ANSP regions with
periodic ADS-C
contracts NOT enabling
MET group
Google Earth
US Dept of State Geographer
http://gis.icao.int/GEOPDF/FIR2013.kml
Rockwell Collins/ARINC Proprietary
and Confidential.9
Indian Ocean ANSPs supporting ADS-C protocol
ANSP regions with
periodic ADS-C
contracts NOT enabling
MET group
Google Earth
US Dept of State Geographer
http://gis.icao.int/GEOPDF/FIR2013.kml
Rockwell Collins/ARINC
Proprietary and Confidential.0
Atlantic Ocean ANSPs supporting ADS-C protocol
ANSP regions with
periodic ADS-C
contracts NOT enabling
MET group
Google Earth
US Dept of State Geographer
http://gis.icao.int/GEOPDF/FIR2013.kml
Rockwell Collins/ARINC Proprietary
and Confidential.A gap in the North Atlantic
• 2 years ago we noticed a gap in N Atlantic west
of Europe
• Tracks started/stopped 30-40°W
• AMDAR problem? No: ADS-C problem.
• At that time ADS-C was treated as AMDAR
• Spoke to EUMETNET, Steve Stringer
• ‘Santa Maria’ flight information region
• Steve spoke to NavPortugal – outcome unclear
• Early October we started getting ADS-C from
that region
• Only 26 more ANSPs to go!
EUROPEAN CENTRE FOR MEDIUM-RANGE WEATHER FORECASTS 51ADS-C+AIREP data for 5 October 2020
• Cases where tracks stop mid-ocean may be due to non-request of MET data
EUROPEAN CENTRE FOR MEDIUM-RANGE WEATHER FORECASTS 52Summary (I)
• Covid-19 reduced the number of aircraft reports by 75% for ~2months
• Partial recovery to ~50% of pre-Covid levels
• Autumn 2020: European reports decreased, S Hem. reports increased
• Aircraft data are valuable for NWP, biggest impact is on wind at ~250 hPa
• Winds give more impact than temperatures
• More impact in N Hem. where most reports are
• Cannot see a decrease in forecast quality in 2020 (multiple centres):
• Satellite data more important – some increases in 2020
• Aircraft data didn’t drop to zero (more impact per report if data are sparse)
• Day-to-day and year-to-year variations in forecast skill complicate the picture
• Mitigation attempts include use of Mode-S aircraft winds at ECMWF
• B787 wind problem – very frustrating issue - partially corrected at ECMWF now
EUROPEAN CENTRE FOR MEDIUM-RANGE WEATHER FORECASTS 53Summary (II)
• Most aircraft have warm temperature bias
• NWP centres apply bias correction (or don’t use the temperatures)
• Would be better if bias was addressed at source
• Some ideas (EUFAR meeting) but need airline involvement
• Metadata: would be useful to know aircraft type and airline
• Found these for 50% of AMDARs but better to get metadata from airlines
• Multiple identifiers for the same aircraft
• Filling in the gaps
• # of reports increased dramatically to 2019
• Hope for further expansion of AMDAR (WICAP)
• Some avoidable gaps in ADS-C; Mode-S expansion?
• Aircraft data are valuable for NWP – could be even more so!
EUROPEAN CENTRE FOR MEDIUM-RANGE WEATHER FORECASTS 54Resources
• WMO overview and description of AMDAR
https://community.wmo.int/activity-areas/aircraft-based-observations
• Petersen (2016, BAMS), “impact and benefits of AMDAR observations”
• Ingleby et al (2020, GRL), “impact of Covid-19 on weather forecasts”
• Pauley and Ingleby (book chapter, soon), “assimilation of in situ data”
• EUMETNET/ECMWF workshop on ‘Aircraft Weather Observations and their
Use’, February 2020, https://www.ecmwf.int/en/learning/workshops/workshop-
aircraft-weather-observations-and-their-use
• EUFAR workshop on aircraft temperature measurement, Nov 2020,
https://www.eufar.net/event/event/atmospheric-temperature-measurement-
from-research-and-operational-aircraft-an-online-workshop-324457/
• ECMWF daily data coverage charts
https://www.ecmwf.int/en/forecasts/quality-our-forecasts/monitoring-
observing-system
EUROPEAN CENTRE FOR MEDIUM-RANGE WEATHER FORECASTS 55You can also read