PowerLogic SMS 4.0 System Manager Software User's Guide - Instruction Bulletin
←
→
Page content transcription
If your browser does not render page correctly, please read the page content below
PowerLogic® SMS 4.0
                         System Manager Software
                         User’s Guide

Instruction Bulletin
Retain for future use.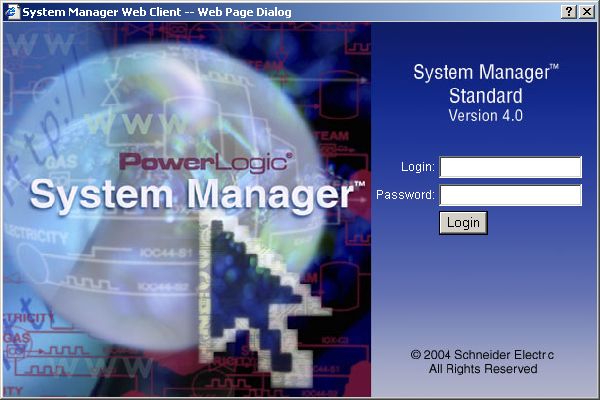
HAZARD CATEGORIES AND   Read these instructions carefully and look at the equipment to become
SPECIAL SYMBOLS         familiar with the device before trying to install, operate, service or maintain it.
                        The following special messages may appear throughout this bulletin or on the
                        equipment to warn of potential hazards or to call attention to information that
                        clarifies or simplifies a procedure.
                        The addition of either symbol to a “Danger” or “Warning” safety label
                        indicates that an electrical hazard exists which will result in personal injury if
                        the instructions are not followed.
                        This is the safety alert symbol. It is used to alert you to potential personal
                        injury hazards. Obey all safety messages that follow this symbol to avoid
                        possible injury or death.

                                                        DANGER
                         DANGER indicates an imminently hazardous situation which, if not
                         avoided, will result in death or serious injury.

                                                       WARNING
                         WARNING indicates a potentially hazardous situation which, if not
                         avoided, can result in death or serious injury.

                                                        CAUTION
                         CAUTION indicates a potentially hazardous situation which, if not
                         avoided, can result in minor or moderate injury.

                                                     CAUTION
                         CAUTION, used without the safety alert symbol, indicates a potentially
                         hazardous situation which, if not avoided, can result in property damage.

PLEASE NOTE             Electrical equipment should be installed, operated, serviced, and maintained
                        only by qualified personnel. No responsibility is assumed by Schneider
                        Electric for any consequences arising out of the use of this material.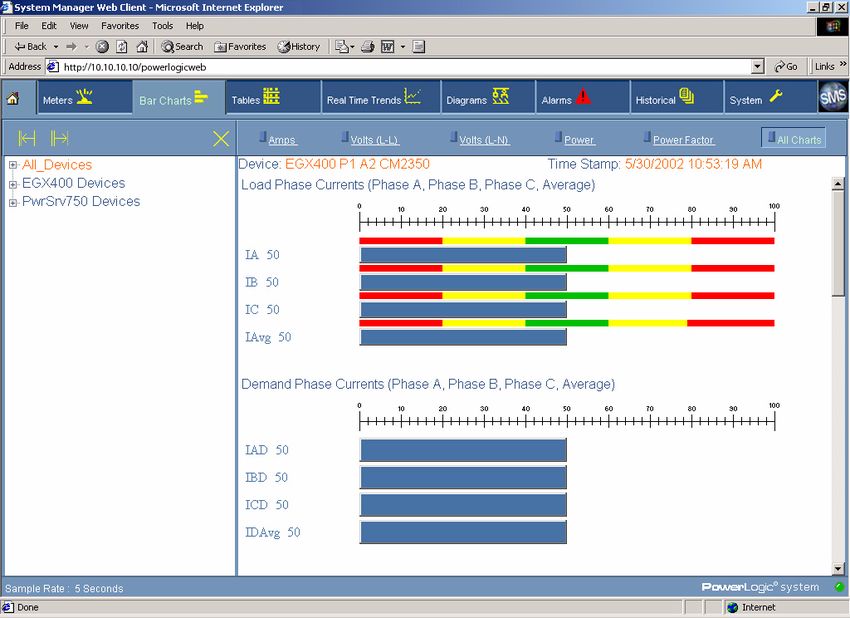
63220-073-202A1                                                                                                                                Contents
5/2003

CONTENTS                                        CHAPTER 1—INTRODUCTION . . . . . . . . . . . . . . . . . . . . . . . . . . . . . . . . 1
                                                   SMS 4.0 Interfaces . . . . . . . . . . . . . . . . . . . . . . . . . . . . . . . . . . . . . . . 1
                                                   SMS 4.0 Products . . . . . . . . . . . . . . . . . . . . . . . . . . . . . . . . . . . . . . . . 1
                                                Prerequisite Information Covered in the SMS 4.0 Setup Guide . . . . . . . . . 1
                                                Accessing SMS 4.0 . . . . . . . . . . . . . . . . . . . . . . . . . . . . . . . . . . . . . . . . . . . 1
                                                    Opening an SMS 4.0 Browser Session . . . . . . . . . . . . . . . . . . . . . . . . 2
                                                SMS 4.0 Home Page . . . . . . . . . . . . . . . . . . . . . . . . . . . . . . . . . . . . . . . . . 3
                                                   Using the About Box to Determine the Software Version . . . . . . . . . . 4
                                                Refreshing (Reloading) the User Interface . . . . . . . . . . . . . . . . . . . . . . . . . 4

                                                CHAPTER 2—USING METER AND BAR CHART DISPLAYS . . . . . . . . . 5
                                                Viewing Meter Displays . . . . . . . . . . . . . . . . . . . . . . . . . . . . . . . . . . . . . . . . 5
                                                Viewing Bar Charts . . . . . . . . . . . . . . . . . . . . . . . . . . . . . . . . . . . . . . . . . . . 6
                                                Viewing Operating Ranges in Meter and Bar Chart Displays . . . . . . . . . . . 6

                                                CHAPTER 3—USING REAL-TIME TABLES . . . . . . . . . . . . . . . . . . . . . . . 7
                                                Viewing Tables . . . . . . . . . . . . . . . . . . . . . . . . . . . . . . . . . . . . . . . . . . . . . . 7
                                                    Viewing a Single Device Table . . . . . . . . . . . . . . . . . . . . . . . . . . . . . . 7
                                                    Viewing a Multi-Device Table . . . . . . . . . . . . . . . . . . . . . . . . . . . . . . . 8
                                                Creating Quick Tables . . . . . . . . . . . . . . . . . . . . . . . . . . . . . . . . . . . . . . . . 8
                                                Updating Real-time Data After Device Ratings are Changed . . . . . . . . . . . 9

                                                CHAPTER 4—USING REAL-TIME TRENDS . . . . . . . . . . . . . . . . . . . . . 11
                                                Viewing Real-time Trends . . . . . . . . . . . . . . . . . . . . . . . . . . . . . . . . . . . . . 11

                                                CHAPTER 5—USING DIAGRAMS . . . . . . . . . . . . . . . . . . . . . . . . . . . . . 15
                                                Creating Diagrams . . . . . . . . . . . . . . . . . . . . . . . . . . . . . . . . . . . . . . . . . . 15
                                                    Copying Older GFX Drawings . . . . . . . . . . . . . . . . . . . . . . . . . . . . . . 15
                                                Viewing Diagrams . . . . . . . . . . . . . . . . . . . . . . . . . . . . . . . . . . . . . . . . . . . 16
                                                    Sample Diagram . . . . . . . . . . . . . . . . . . . . . . . . . . . . . . . . . . . . . . . . 18
                                                    Sample Summary Page . . . . . . . . . . . . . . . . . . . . . . . . . . . . . . . . . . . 19
                                                    Creating Hyper Drawing Blocks that Link to URLs . . . . . . . . . . . . . . 19

                                                CHAPTER 6—USING ALARMS . . . . . . . . . . . . . . . . . . . . . . . . . . . . . . . 21
                                                Configuring Alarms . . . . . . . . . . . . . . . . . . . . . . . . . . . . . . . . . . . . . . . . . . 21
                                                Viewing Alarm Information . . . . . . . . . . . . . . . . . . . . . . . . . . . . . . . . . . . . 21
                                                    Silencing Alarms . . . . . . . . . . . . . . . . . . . . . . . . . . . . . . . . . . . . . . . . 21
                                                    Viewing Active Alarms . . . . . . . . . . . . . . . . . . . . . . . . . . . . . . . . . . . . 22
                                                    Popup Alarms . . . . . . . . . . . . . . . . . . . . . . . . . . . . . . . . . . . . . . . . . . 22
                                                    Viewing the Alarm Log . . . . . . . . . . . . . . . . . . . . . . . . . . . . . . . . . . . . 23
                                                    The Alarm Log Refresh Icon . . . . . . . . . . . . . . . . . . . . . . . . . . . . . . . 23
                                                    Viewing Waveform Information from the Alarm Log . . . . . . . . . . . . . 24
                                                    Viewing Details about an Alarm . . . . . . . . . . . . . . . . . . . . . . . . . . . . . 27
                                                    Resizing Columns in Alarm Windows . . . . . . . . . . . . . . . . . . . . . . . . 27
                                                    Sorting by Columns . . . . . . . . . . . . . . . . . . . . . . . . . . . . . . . . . . . . . . 28
                                                    Printing the Alarm Log or Active Alarms List . . . . . . . . . . . . . . . . . . . 28

                                                CHAPTER 7—USING HISTORICAL DATA . . . . . . . . . . . . . . . . . . . . . . . 29
                                                Historical Data Page . . . . . . . . . . . . . . . . . . . . . . . . . . . . . . . . . . . . . . . . . 29

© 2003 Schneider Electric All Rights Reserved                                                                                                              i
Contents                                                                                          63220-073-202A1
                                                                                                            5/2003

           Using Reports . . . . . . . . . . . . . . . . . . . . . . . . . . . . . . . . . . . . . . . . . . . . . . 29
               Creating Reports in Information Manager . . . . . . . . . . . . . . . . . . . . . 29
               Viewing Reports . . . . . . . . . . . . . . . . . . . . . . . . . . . . . . . . . . . . . . . . . 29
               Refreshing the Report Tree . . . . . . . . . . . . . . . . . . . . . . . . . . . . . . . . 30
           Using Waveforms . . . . . . . . . . . . . . . . . . . . . . . . . . . . . . . . . . . . . . . . . . . 30
               Capturing Waveforms . . . . . . . . . . . . . . . . . . . . . . . . . . . . . . . . . . . . 30
               Viewing Waveform Information Only . . . . . . . . . . . . . . . . . . . . . . . . . 30

           CHAPTER 8—USING THE SYSTEM TAB . . . . . . . . . . . . . . . . . . . . . . . . 33
           Storing and Viewing Document Files and Web Links . . . . . . . . . . . . . . . . 33
                Storing Documents and Web Links . . . . . . . . . . . . . . . . . . . . . . . . . . 33
                Web-Enabled Devices . . . . . . . . . . . . . . . . . . . . . . . . . . . . . . . . . . . . 33
                Viewing Documents and Web Links . . . . . . . . . . . . . . . . . . . . . . . . . 34
           Setting User Preferences . . . . . . . . . . . . . . . . . . . . . . . . . . . . . . . . . . . . . 34
                Changing the Sample Rate . . . . . . . . . . . . . . . . . . . . . . . . . . . . . . . . 35
                Changing the Default Page . . . . . . . . . . . . . . . . . . . . . . . . . . . . . . . . 35
                Maximizing Screen Space for Viewing Data . . . . . . . . . . . . . . . . . . . 37
                How Alarms are Indicated—Audible, Popup View, or Both . . . . . . . . 38
                Number of Alarm Records Displayed . . . . . . . . . . . . . . . . . . . . . . . . . 39
           Opening the System Manager Setup Utility . . . . . . . . . . . . . . . . . . . . . . . 39
              System Manager DL and System Manager Standard . . . . . . . . . . . . 39
              System Manager Professional . . . . . . . . . . . . . . . . . . . . . . . . . . . . . . 40
           INDEX . . . . . . . . . . . . . . . . . . . . . . . . . . . . . . . . . . . . . . . . . . . . . . . . . . . . 45

ii                                                                  © 2003 Schneider Electric All Rights Reserved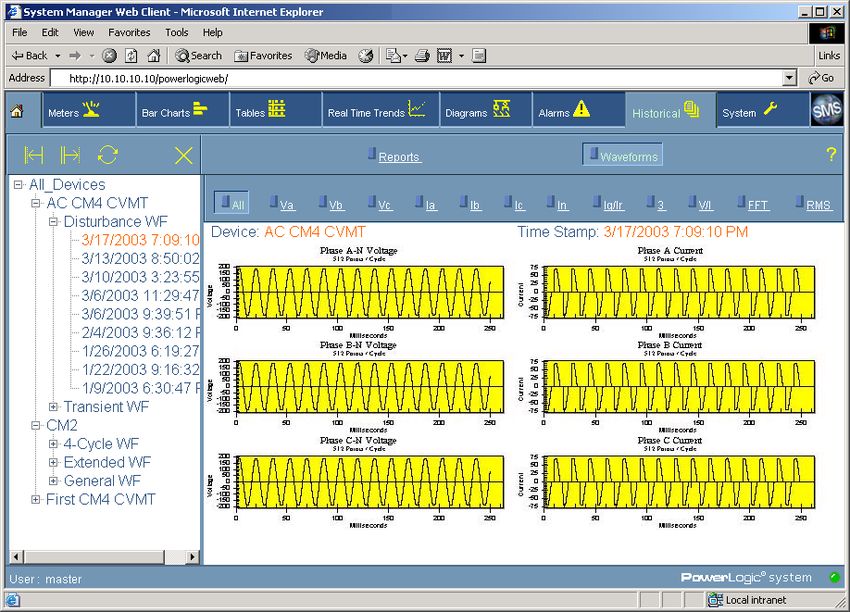
63220-060-229A1                                                                                                    Introduction
4/2004                                                                                                 Prerequisite Information

CHAPTER 1—INTRODUCTION                          PowerLogic ® System Manager Software 4.0 (SMS 4.0) provides access to
                                                real-time and historical system data using a standard web browser format.
                                                With SMS 4.0, you can do the following:
                                                •   view meters
                                                •   view bar charts
                                                •   view tables
                                                •   view real-time trends
                                                •   view documents
                                                •   set user preferences
                                                •   store and view historical waveforms and reports
                                                •   configure and retrieve alarm information
                                                •   create and view data diagrams

SMS 4.0 Interfaces                              SMS 4.0 includes these interfaces:
                                                • browser-based user interface, which displays real-time and historical data
                                                • setup utility, used to set up system devices and set some system
                                                  preferences
                                                • reports module
                                                • optional graphical design module, used to create diagrams, such as one-
                                                  lines, that are then viewable via the browser

                                                This manual tells how to use the SMS 4.0 browser-based user interface to
                                                view system information using Internet Explorer (version 5.5, service pack 2,
                                                or higher). Help for the other interfaces is found within each interface.

SMS 4.0 Products                                You have purchased one of these products:
                                                • System Manager DL
                                                • System Manager Standard
                                                • System Manager Professional

                                                Throughout these instructions, all three products will be called “SMS 4.0” or
                                                sometimes “SMS.” Not all of the SMS 4.0 features are available in every
                                                product. When a feature is limited to one or two products, the instructions will
                                                explain the limitation.

PREREQUISITE INFORMATION                        The instructions in this manual assume that:
                                                • all of the prerequisites listed in the SMS 4.0 Setup Guide have been met
                                                • all Microsoft ® licensing requirements are met
                                                • SMS 4.0 is installed according to the directions in the SMS 4.0 Setup
                                                  Guide

                                                A printed copy of the SMS 4.0 Setup Guide (instruction bulletin 63230-060-
                                                228) is included in your SMS 4.0 software package.

ACCESSING SMS 4.0                               This section describes how to open an SMS 4.0 browser session. For
                                                information on opening the setup utility, see Opening the System Manager
                                                Setup Utility.

© 2004 Schneider Electric All Rights Reserved                                                                                  1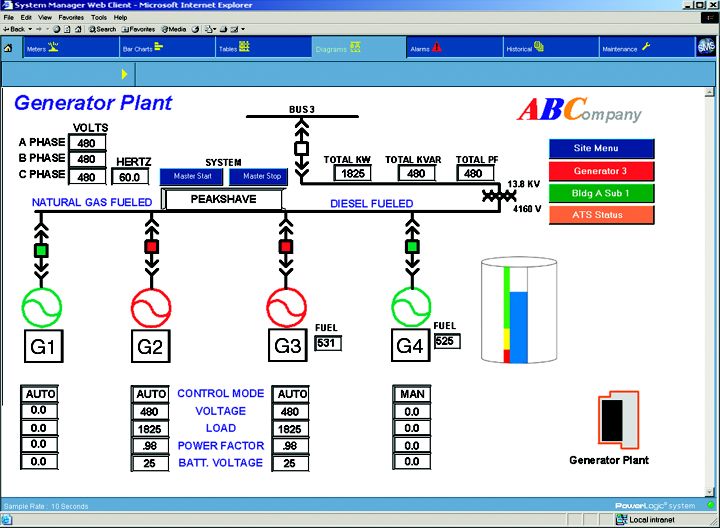
Introduction                                                                                          63220-060-229A1
Accessing SMS 4.0                                                                                               4/2004

                                     Before you start a browser session, the server computer must be running.
                                     You will need a valid SMS user ID and password.

Opening an SMS 4.0 Browser Session   System Manager DL and Standard allow one browser connection at a time.
                                     However, if you have installed the add-on product WebXTR, there are an
                                     additional five connections, providing six simultaneous connections. System
                                     Manager Professional allows ten simultaneous browser connections.

                                     You can open the SMS 4.0 browser session from the computer at which SMS
                                     4.0 is installed, or from a remote computer. In either case, follow these steps:
                                     1. Open Internet Explorer.
                                     2. Enter the computer name or IP address for the SMS 4.0 server, followed
                                        by “/powerlogicweb.” Your system administrator can give you the name or
                                        address that you are to use.
                                        For example, if the computer name is “webserver,” the name you will
                                        enter is:
                                        http://webserver/powerlogicweb.
                                        NOTE: From the server computer, you can also click Start > Programs >
                                        POWERLOGIC > System Manager Software.

                                     The first time you open an SMS 4.0 browser session (at the server computer
                                     as well as any remote computer), the following Security Warning screen
                                     displays:

                                     3. To ensure that the user interface components are properly registered,
                                        you must click Yes.
                                        NOTE: If you receive errors after clicking Yes to the Security Warning,
                                        your Windows account security may not permit installation of the user
                                        interface controls. To install them, you must be a power user or
                                        administrator on the remote computer. Contact your system administrator
                                        to remedy the situation.

2                                                                            © 2004 Schneider Electric All Rights Reserved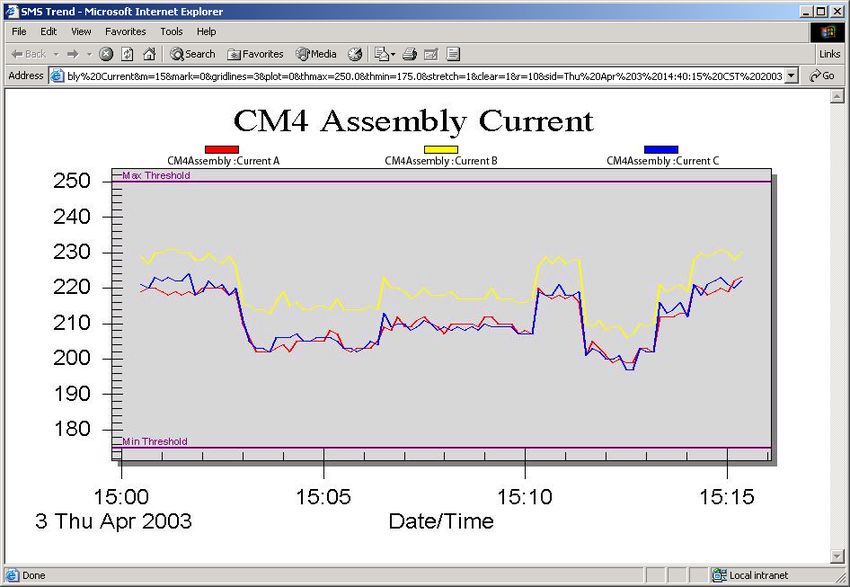
63220-060-229A1                                                                                                 Introduction
4/2004                                                                                                   SMS 4.0 Home Page

                                                    The System Manager Web Client login screen displays:

                                                4. Enter a valid login ID and password for the SMS 4.0 software installed on
                                                   the server computer. The user ID that you use must have both ID and
                                                   password (blanks not acceptable) to be valid. You must receive this ID
                                                   and password from your SMS system administrator.
                                                   The SMS 4.0 home page displays.

SMS 4.0 HOME PAGE                               Figure 1 depicts the SMS 4.0 home page. See Table 1 for a description of the
                                                parts of the screen.

                                                1
                                                2                                                                        6
                                                                                                                         7

                                                3

                                                4

                                                5                                                                         8

                                                Figure 1:   The SMS 4.0 home page

© 2004 Schneider Electric All Rights Reserved                                                                                 3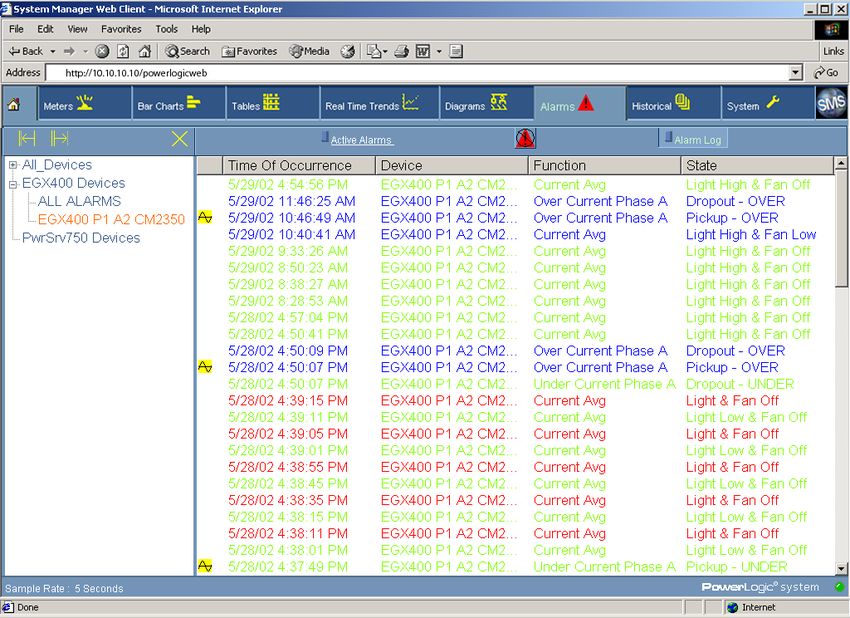
Introduction                                                                                              63220-060-229A1
SMS 4.0 Home Page                                                                                                   4/2004

                                        Table 1:   The Parts of the SMS 4.0 Home Page

                                        1    URL                This is the URL of the server computer: “IP/
                                                                powerlogicweb”
                                        2    Home icon and      Click the Home icon to refresh (reload) the home page.
                                             Browser Tabs       Note: If you defined a default page in the Preferences
                                                                dialog, that page displays instead of the one shown above.
                                                                See Changing the Default Page for instructions on defining
                                                                a default home page.

                                                                Each browser tab corresponds to a feature, such as
                                                                viewing meters or bar charts. Click a tab to display that
                                                                feature.
                                                                Note: The Diagrams tab is active only if the add-on product
                                                                GFX has been installed on the server computer.
                                        3    Banner             The default banner is blank. You can insert your own
                                                                graphic in this space. For help, see the SMS 4.0 Setup
                                                                Guide.
                                        4    Version number     This is the current version of SMS 4.0 software that is
                                                                running on the server computer.
                                        5    User ID            The user ID that was used when you logged on to SMS 4.0.
                                                                This must be a valid ID for the SMS application that is
                                                                installed on the server computer.
                                        6    About box          Click this button to display SMS 4.0 product information,
                                                                such as the version number. The default graphic is the
                                                                SMS 4.0 logo. You can replace this graphic with your own
                                                                graphic. For help, see the SMS 4.0 Setup Guide.
                                        7    Help button        Click the “?” icon to view the online manual:
                                                                From the home page, the contents for the entire manual
                                                                displays.
                                                                When viewing a specific feature, only the relevant section
                                                                of the manual displays (such as Using Meters).
                                        8    Green/red link     Indicates whether the SMS 4.0 server is running. Options
                                             light              are:
                                                                green = The SMS 4.0 server is running.
                                                                red = The SMS 4.0 server is not running.
                                                                Note: This light does not indicate whether the SMS 4.0
                                                                       server is communicating with the SMS Setup Utility.

Changing the SMS Setup Utility System   If you use more than one system in your SMS Setup Utility (for example, a
                                        main system and a "portable" system), you may periodically want to switch
                                        between systems. When changing the system, follow these steps to ensure
                                        that data displays correctly in the SMS browser.
                                        1. At the SMS 4.0 server computer, open the SMS Config utility (from the
                                           Setup Utility main window, click Tools > SMS Configuration Utility).
                                        2. Select the PLComponents tab.
                                        3. From the pull-down menu, select the system that you want to use. Click
                                           OK.
                                        4. Close all windows and restart the server computer.
                                        5. After the computer restarts, launch the Setup Utility.
                                        6. Change the system to match the one you selected in SMS Config:
                                        7. Click File > Open > System; select the system and click OK.

4                                                                                © 2004 Schneider Electric All Rights Reserved
63220-060-229A1 Introduction
4/2004 SMS 4.0 Home Page
After you make these changes, system information will display correctly in
both the Setup Utility and the browser view.
© 2004 Schneider Electric All Rights Reserved 5Introduction 63220-060-229A1 SMS 4.0 Home Page 4/2004 6 © 2004 Schneider Electric All Rights Reserved
63220-060-229A1 Using Meter and Bar Chart Displays
4/2004 Viewing Meter Displays
CHAPTER 2—USING METER AND
BAR CHART DISPLAYS
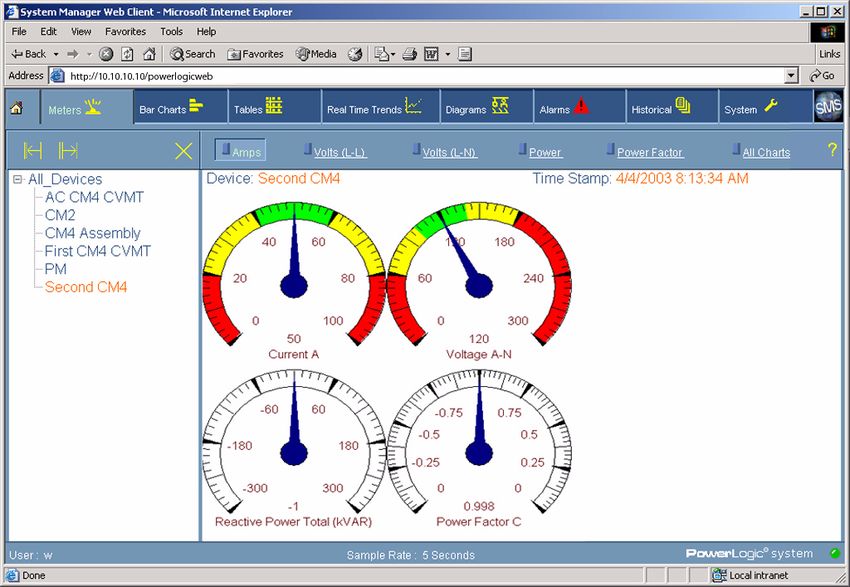
VIEWING METER DISPLAYS To view meter displays, do the following:
1. Click the Meters tab (see Figure 2).
2. Select a device from the tree list on the left side of the page.
3. Select the desired quantity to view (Amps, Volts, etc.) from the Meters
toolbar.
The meters update at the sample rate displayed at the bottom of the
browser window. (See Changing the Sample Rate for instructions on
modifying the sample rate.)
4. To view amps, volts, power, and power factor meters on the same display,
click the All Charts button. Click the quantity names at the bottom of each
meter to cycle through the various phases.
Click to decrease the tree
area (left side of the page). Click
to increase the tree area. To
restore the tree widths to the
default setting, click the Restore
Defaults button (System tab >
Preferences > Tree
Configuration).
Click
If you defined device groups All Charts to
during setup, the groups will view
appear in the tree. amperes,
volts, power
factor, and
If configured, meter displays color power on the
bands to indicate normal same page.
operating ranges. See Viewing
Operating Ranges in Meter and
Bar Chart Displays.
Click the
The maximum value shown in the quantity
meter can be adjusted by setting label to view
the ratings for each quantity of other
that device. See Viewing phases in All
Operating Ranges in Meter and Charts view.
Bar Chart Displays.
Figure 2: The Meters Page in all Charts Mode
© 2004 Schneider Electric All Rights Reserved 5Using Meter and Bar Chart Displays 63220-060-229A1
Viewing Bar Charts 4/2004
VIEWING BAR CHARTS To view bar charts (Figure 3), do the following:
1. Click the Bar Charts tab.
2. Select a device from the list on the left side of the page.
3. Select the desired quantity to view (amps, volts, etc.).
The bar charts update at the sample rate displayed at the bottom of the
browser window. (See Changing the Sample Rate for instructions on
changing the sample rate.)
4. To view amps, volts, power, and power factor charts on the same display,
click the All Charts button. Scroll to view all charts.
If configured, a bar chart
displays color bands to indicate Click the
normal operating ranges. See All Charts
Viewing Operating Ranges in button to
Meter and Bar Chart Displays. view charts
for all
quantities on
The maximum value shown in the same
the bar chart can be adjusted by page.
setting the ratings for each
quantity of that device. See
Viewing Operating Ranges in
Meter and Bar Chart Displays. Scroll to view
other charts.
Figure 3: The Bar Charts page in All Charts mode
VIEWING OPERATING RANGES IN Both meter and bar chart displays support color bands to indicate normal
METER AND BAR CHART DISPLAYS operating ranges. These bands only appear if you configure them during the
setup process. For help setting up operating ranges for system devices, open
the SMS Setup Utility help file. From within the Setup Utility, click Help >
Setup Utility Help. Find the index topic “Operating Range Indication” for
instructions.
You can adjust the maximum value shown in a meter or bar chart display by
setting the ratings for each quantity of that device.This is accomplished
during device setup in the SMS Setup Utility. For help, find the index topic
“Ratings” in the SMS 4.0 Setup Utility help file.
6 © 2004 Schneider Electric All Rights Reserved63220-060-229A1 Using Real-Time Tables
4/2004 Viewing Tables
CHAPTER 3—USING REAL-TIME TABLES
VIEWING TABLES Tables display real-time data for devices that are connected to the SMS 4.0
system. For example, you might view a table that displays instantaneous
readings for a circuit monitor. Data from these devices is updated according
to the sample rate entered in the Preferences page of the browser interface
(System > Preferences > Sample Rate > Real Time Data). When a table
supports multiple devices, you can include individual devices or entire
groups. When a table supports a single device only, data displays for only
one device at a time.
To view real-time tables, click the Tables tab.
Viewing a Single Device Table To view a single device table, do the following:
1. Click the Tables tab.
2. Click the Single Device Tables button to display the list of available single
device tables:
3. In the device list on the left side of the page, select a device.
The list of tables is filtered to show only tables that apply to that device.
4. Click the name of a table to view it.
The table displays and the device tree view refreshes and displays only
the devices compatible with that table.
The table data updates at the sample rate displayed at the bottom of the
browser window. (See Changing the Sample Rate for instructions on
changing the sample rate.)
5. To view a different device using the same table, select a new device from
the device list.
6. To view a different table with the same device, click the Single Devices
Tables button to return to the Table Selection List.
7. To view a different table and a different device, click the Tables tab.
NOTE: You can also select a table, then a device. If you select the table
first, the device tree view will refresh and display only the devices
compatible with that table.
© 2004 Schneider Electric All Rights Reserved 7Using Real-Time Tables 63220-060-229A1
Creating Quick Tables 4/2004
Viewing a Multi-Device Table To view a multi-device table, do the following:
1. Click the Tables tab.
2. Click the Multi-Device Tables button to display a list of available tables.
3. Select a table to view.
The list of devices is filtered to show only devices that are compatible with
the selected table:
4. Select the desired device(s) from the devices list by moving them to the
list on the right side of the page. Choose devices by the following means:
• To select all devices, click .
• To select a single device, highlight it, then click .
• To select all devices within a group, select the group name
and click .
• To deselect all selected devices, click .
5. Click Apply to display the table.
The table updates at the sample rate displayed at the bottom of the
browser window. (See Changing the Sample Rate for instructions on
changing the sample rate.)
6. To view a different table, click the Multi-Device Tables button to return to
the Table Selection List.
CREATING QUICK TABLES Each supported device type has a set of default tables. However, you can
also create simple custom tables. To do so, follow these steps:
1. Open the System Manager Setup Utility (see Opening the System
Manager Setup Utility).
2. When the Setup Utility window is open, click File > New > Quick Table.
3. Create the quick table.
For instructions, see the Setup Utility help file (Help > Setup Utility Help
> Custom Quantities and Tables > Adding a Custom (Quick) Table).
Follow the steps to create a quick table.
8 © 2004 Schneider Electric All Rights Reserved63220-060-229A1 Using Real-Time Tables
4/2004 Updating Real-time Data After Device Ratings are Changed
4. In the browser, click the Tables tab.
The new table should now display in the table list.
NOTE: You can also add a custom table, or customize a standard table,
in the SMS Table Construction utility: Open the System Manager Setup
Utility. Click File > New > Table. Refer to Help > Setup Utility Help >
Custom Quantities and Tables > Working with Custom Tables for
instructions.
UPDATING REAL-TIME DATA AFTER When you are viewing a real-time table and device ratings are changed in
DEVICE RATINGS ARE CHANGED SMS 4.0, data in the table will not reflect the changes until IIS (Internet
Information Services) is reset. For example, you might be viewing the Power
Capacity Utilization Summary table and see that the Capacity Ratings KW
and KVA display “Not Setup.” If you enter ratings information for these
devices in SMS 4.0, the new data does not display automatically. To update
the view, you must refresh IIS on the server computer:
1. Close your browser.
2. Click Start > Run; then type iisreset.
The DOS window displays while IIS is refreshed.
After the reset takes place, the DOS window closes.The table will display
the correct information.
© 2004 Schneider Electric All Rights Reserved 9Using Real-Time Tables 63220-060-229A1 Updating Real-time Data After Device Ratings are Changed 4/2004 10 © 2004 Schneider Electric All Rights Reserved
63220-060-229A1                                                                                       Using Real-Time Trends
4/2004                                                                                               Viewing Real-time Trends

CHAPTER 4—USING REAL-TIME
TRENDS

VIEWING REAL-TIME TRENDS                        A real-time trend is a plot that displays data for system devices over a set
                                                period of time. This real-time data is updated according to the schedule that
                                                is set in the Sample Rate window of the Preferences tab (System >
                                                Preferences > Sample Rate > Diagram and Real Time Trend Data).
                                                You can view a real-time trend for up to 14 device/topic combinations. For
                                                example, you might chart 14 topics (quantities) for a single device, a single
                                                topic for 14 devices, or 2 topics for 7 devices. All of the devices must be
                                                included in a single SMS system.
                                                You can also open a trend in a separate browser window, allowing you to use
                                                the main browser window for other tasks.
                                                To view a real-time trend, do the following:
                                                1. Click the Real-Time Trends tab.
                                                   The Trend Device/Topic Selection screen displays:

                                                2. At the top of the screen, click “Standard” to use a limited list of topics
                                                   (those typically used when creating a trend); or click “Advanced” to
                                                   expand the list of topics. In Advanced mode, the trend will take longer to
                                                   display the topic list. (The default is Standard.)
                                                   If you change the Standard/Advanced mode, a message displays telling
                                                   you that the list will be shortened or lengthened accordingly. Click OK to
                                                   continue with the change, or click Cancel to keep the mode as it currently
                                                   displays.
                                                3. If you want the new mode to become the default for future trends, click
                                                   “Make Default.”
                                                4. In the upper left box, highlight the first device for which you want to view
                                                   a real-time trend.
                                                5. From the lower left box, select the topic(s) you want to include in the
                                                   trend: click the topic name; it displays in the right-hand box. The device
                                                   and topic also display in the upper right box.
                                                   To remove a topic from the right-hand box, click its name. To remove all
                                                   topics for a single device from the right-hand box, highlight the device in
                                                   the upper left box, then click        .
                                                6. If necessary, repeat steps 4 and 5 for additional devices.

© 2004 Schneider Electric All Rights Reserved                                                                                11
Using Real-Time Trends 63220-060-229A1
Viewing Real-time Trends 4/2004
7. When you have selected all device/topic combinations that you want in
the trend, you can review your selections in the upper right box.
Add or delete devices and topics, as needed.
8. When you are satisfied with your selections, click Next.
9. The Trend Options screen displays:
10. Enter the following information:
Table 2: Options Screen fields
In this field ... Enter this .... Default
Title of Graph The name that you want to display as the trend title. n/a
Trend time to plot The maximum length of time you want to display the trend in 15 minutes
the browser. Although the trend will continue until you stop it,
this is the maximum time span you can see in the window.
Mark data points Select True if you want to see the data points in addition to the False
trend line or bar.
Grid line settings Select how you want to display black grid lines in the trend Both
plot:
Both horizontal and vertical lines display
X Axis only vertical grid lines display
Y Axis only horizontal grid lines display
None no grid lines display
Plot method in Select whether you want the trend to display as a line or a bar. Line
trend
Max threshold as Use these optional fields to display “Max Threshold” and “Min 0.0
real number Threshold” lines on the trend. You might use this feature to
display a line for each of the alarm thresholds you have
Min threshold as established for a topic that is displayed in the trend. 0.0
real number
Reset trend When a trend is running in the parent browser window (not Unchecked
history data launched in a new window), you can save data that is already
plotted while making changes to its settings. To do this,
uncheck this box, make the changes and click Next. The trend
will continue logging, but will use the new settings. No data is
logged for the period of time from when you clicked the Real
Time Trend tab until you click Next to exit this screen.
Launch in new Check this box to cause the trend to display in a new browser Checked
window window. If you do not use a separate browser window, the
trend will stop logging information when you click any tab in
the main browser window.
12 © 2004 Schneider Electric All Rights Reserved63220-060-229A1 Using Real-Time Trends
4/2004 Viewing Real-time Trends
After you enter the information in Table 2, click Next to display the trend (it
may take several seconds for the trend to display):
Data displays according to the rate set in the Sample Rate window of the
Preferences tab (System > Preferences > Sample Rate. The Date/Time
displays in military (24-hour) time.
The trend continues to run until you click another browser tab (or, if you have
launched the trend in a new window, when you close that browser window).
© 2004 Schneider Electric All Rights Reserved 13Using Real-Time Trends 63220-060-229A1 Viewing Real-time Trends 4/2004 14 © 2004 Schneider Electric All Rights Reserved
63220-060-229A1                                                                                              Using Diagrams
4/2004                                                                                                     Creating Diagrams

CHAPTER 5—USING DIAGRAMS                        Use the Diagrams feature to view real-time data from your system devices in
                                                a graphical format (such as a one-line diagram). Graphics are created in the
                                                separate GFX application. The Diagrams tab contains links to drawings that
                                                have been created using GFX. If you do not have GFX installed on the server
                                                computer, the Diagrams tab is grayed out.
                                                You can view graphics through the SMS 4.0 browser interface at any
                                                computer that has access to the server computer. See the descriptions for
                                                each System Manager product for limitations.
                                                For System Manager DL and System Manager Standard: Although you
                                                can view graphics in the browser at any computer, graphics must be created
                                                and edited at the server computer. Only one remote GFX browser connection
                                                is allowed at a time.
                                                For System Manager Professional: In addition to the GFX installation on
                                                the server computer, you can also install an optional GFX client at a remote
                                                computer, enabling you to create and edit diagrams at that computer. Up to
                                                five remote GFX browser connections are allowed at a time.

CREATING DIAGRAMS                               Follow these steps to create diagrams:
                                                1. Open the Setup Utility (see Opening the System Manager Setup Utility).
                                                2. When the Setup Utility window is open, click File > New > Diagram.
                                                3. Create the diagram.
                                                   See the online help file (Help > Setup Utility Help > GFX > Types of GFX
                                                   Objects) for instructions on how to create diagrams. Table 3 also lists and
                                                   describes the GFX objects.
                                                   NOTE: If you prefer to use one of your own backgrounds in your diagram,
                                                   copy the background into the
                                                   C:\POWERLOGIC\SMS\Drawings\Backgrounds directory.
                                                4. Save the diagram in the POWERLOGIC\SMS\Drawings folder.
                                                5. Once the diagram is created and saved, restart Internet Explorer and
                                                   launch SMS 4.0.
                                                   NOTE: Changes to diagrams take effect only after you restart Internet
                                                   Explorer.
                                                6. Click the Diagrams tab.
                                                   The new diagram displays in the tree list on the left side of the window.
                                                   Refer to Changing the Sample Rate for setting the sample rate that data
                                                   updates in diagrams. The default sample rate is ten seconds.

Copying Existing GFX Drawings                   If you have existing drawings you would like to use, or if you need to upgrade
                                                your servers, you can copy or move GFX drawings from one server to
                                                another. To do so, you must use the same folder structure. For example, if
                                                your drawings are in C:\POWERLOGIC\SMS\Drawings on computer A, you
                                                must use the same folder structure on computer B. A saved drawing must
                                                have been created in the same SMS system that you are currently using.
                                                Because each GFX graphic (.gfx) contains references to other files, copying
                                                to a different folder structure causes the drawings to be unable to find any
                                                referenced files. The result is a drawing with missing objects or one that
                                                cannot be viewed.

© 2004 Schneider Electric All Rights Reserved                                                                               15
Using Diagrams 63220-060-229A1
Viewing Diagrams 4/2004
VIEWING DIAGRAMS You can use the Preferences window (System > Preferences) to make the
following settings to the way that diagrams display:
• To open a diagram without viewing the left-hand pane (tree), use the Tree
Configuration screen (System > Preferences > Tree Configuration; then
check the Diagrams window type). See Opening the System Manager
Setup Utility for more information.
• To always view a specific diagram when the browser opens, use the
Default Page window (System > Preferences > Default Page; then check
Diagrams). See Changing the Default Page for more information.
To view diagrams, do the following:
1. In the SMS 4.0 browser window, click the Diagrams tab.
2. Select the diagram from the list on the left side of the page.
The diagram displays. See Figure 4 for a sample diagram. Note that the
drawing is updated according to the sample rate set in Sample Rate
window (System > Preferences > Sample Rate).
Each diagram can include a variety of objects that either display
information or can be clicked to display additional information.
NOTE: The first time you view a drawing, it might take longer than the
sample rate you have set in the Sample Rate window.
16 © 2004 Schneider Electric All Rights Reserved63220-060-229A1 Using Diagrams
4/2004 Viewing Diagrams
Table 3 describes the GFX objects that are available in SMS 4.0.
NOTE: Individual objects may display different colors or images, depending
on how they are set up in GFX. See your SMS system administrator for a list
of the colors and images used to create GFX objects.
Table 3: GFX Objects
Object Sample Graphic Description
Value Block Displays a single quantity for a single device. May also
display a title, such as a device name. Click a value
block to display summary data about the device. See
Sample Summary Page for more information.
Analog Function Displays the condition (such as high, normal, or low) of
Block an analog function that has been defined in SMS. The
name of the state and the color that displays for the
state match the name and color set up for the condition
in SMS.
Digital Function Displays the condition (state) of a digital function that
Block has been defined in SMS. The title can change to
indicate the condition. Examples are on/off or open/
closed. Color can be used to differentiate between the
two conditions.
Hyper Drawing Click the displayed block to create a link to a related
Block GFX diagram or URL link (see Creating Hyper Drawing
Blocks that Link to URLs for instructions on creating
links to URLs).
Meter Provides a quick visual of the amperes for each circuit.
Bar Chart Displays custom bar charts similar to the standard bar
chart displays in SMS. The color band at the top of the
chart provides operating range indicators to quickly
show when readings are getting too low or too high.
Digital Function Displays a line or box that changes color to indicate the
Switch state of the associated digital function. This example is
a box switch.
Image Displays an image, such as a bitmap or TIF file of your
company logo.
Text Displays as text in a diagram (in addition to any text
that may be included in the linked background
drawing).
Multi-Input Monitors the combined state of up to four digital
Conditional functions for a single device. The graphic displays as
Graphic an image or color block that illustrates one of the
combined states. No text displays.
Writable Value Like the standard value block, the writable block
Block displays a single quantity for a single device. The
writable value block can also be used to write a decimal
value to a MODBUS device; but you cannot write or
view the writable feature in the browser.
The following two objects may display in the SMS 4.0 diagram, but they do
not function in SMS 4.0 browser.
• control output block: executes a control output defined in SMS,
such as operating a circuit monitor relay
• executable object: creates and launches a link to another
program, such as Microsoft Word
You can create, edit, and use these objects from the Setup Utility, installed
on the SMS 4.0 server computer.
© 2004 Schneider Electric All Rights Reserved 17Using Diagrams 63220-060-229A1
Viewing Diagrams 4/2004
Sample Diagram The sample GFX diagram below illustrates a one-line drawing.
Figure 4: Sample GFX diagram
Table 4 lists and illustrates the different objects used in this diagram.
Table 4: GFX objects in the sample diagram
Sample
Object Description
Graphic
Digital Function In the sample diagram, the digital function switches are green
Switch or and red, indicating whether the switch is closed or open.
Hyper Drawing In this drawing, you would click a hyper drawing block to open
Block the site menu, generator 3, etc.
Bar Chart The bar chart provides a quick visual of the total diesel fuel
level monitored at G3 and G4. The green, yellow, and red
lines are set when creating the graphic. They indicate
“normal,” “low,” and “very low” fuel levels.
Text In this example, the text “Generator Plant” simply indicates
which part of the plant the drawing represents.
Multi-Input Monitors the status of the four transformers, G1 through G4.
Conditional
Block
Value Block The sample diagram contains several value blocks indicating
such quantities as volts, hertz, total kW, voltage, and load.
18 © 2004 Schneider Electric All Rights Reserved63220-060-229A1 Using Diagrams
4/2004 Viewing Diagrams
Sample Summary Page Clicking a value block in a GFX diagram opens a Device Summary page:
Each summary page lists the current, voltage, power factor, power,
frequency, temperature, demand, and accumulated energy.
Creating Hyper Drawing Blocks that Link to You can create hyper drawing blocks to link to GFX drawings or to URL links.
URLs Follow the steps outlined in the GFX online help file for creating links to GFX
drawings. Follow these steps to create links to URLs:
1. From the Setup Utility, open GFX (File > New > Diagram).
2. Click the hyper drawing link icon ( ) and draw the object.
3. Enter the information according to instructions in the GFX online help file
(How to Edit Hyper Drawing Block Properties), except: In the Filename
field, enter the address for the URL link. For example, to link to the site
“mycompany,” enter:
http://mycompany.com
NOTE: The Action box controls how the link displays. If you select
Minimize Current Diagram or Close Current Diagram, it opens in the
current browser window. If you select None, it opens a new browser
window.
4. Save the drawing.
5. To view the link from the SMS 4.0 browser, open the diagram and click
the link.
The URL opens according to the method you selected in the Action box.
© 2004 Schneider Electric All Rights Reserved 19Using Diagrams 63220-060-229A1 Viewing Diagrams 4/2004 20 © 2004 Schneider Electric All Rights Reserved
63220-060-229A1                                                                                                     Using Alarms
4/2004                                                                                                        Configuring Alarms

CHAPTER 6—USING ALARMS

CONFIGURING ALARMS                              The analog, digital, and onboard alarms that are configured in the Setup
                                                Utility can be annunciated in the browser interface. The following information
                                                is available in the Setup Utility online help file:
                                                • For an overview of alarm configuration from within the Setup Utility, see
                                                  Help > Setup Utility Help > Quick Starts > Quick Start: Functions and
                                                  Alarms.
                                                • For configuring onboard alarms, see Help > Setup Utility Help > Working
                                                  with Functions and Alarms > Setting Up On-Board Alarms.
                                                • For PC-based alarms, see Help > Setup Utility Help > Working with
                                                  Functions and Alarms > Setting Up PC-Based Functions and Alarms.

VIEWING ALARM INFORMATION                       By default, the alarm icon is yellow and the alarm list is empty. When an
                                                alarm becomes active (alarm pickups are determined in the Setup Utility
                                                when setting up functions), the alarm icon starts flashing. A new entry is
                                                added to the active alarm list and the alarm log list.

                                                                                        This icon on the alarms tab
                                                                                        alternately flashes red and yellow to
                                                                                        indicate an active alarm.

                                                An active alarm stays in the active alarm list as long as it is in a pickup state.
                                                When it is no longer active (dropout state), it is deleted from the active alarm
                                                list and a dropout alarm is added to the alarm log. The alarm icon continues
                                                to flash to signal that alarm activity has occurred.

Silencing Alarms                                You can “silence” alarms on the user interface by stopping the alarm icon
                                                from flashing red. To silence an alarm, click the Silence Alarms icon.

                                                                       Click to silence alarms.

                                                NOTE: You cannot acknowledge alarms from within the browser. To
                                                acknowledge alarms, you must access the Setup Utility on the server
                                                computer.

                                                If a new alarm picks up, then the icon will start flashing again. If the Alarm
                                                icon is flashing and no entries are in the Active Alarms list, it means that all
                                                the active alarms have already dropped out. Click the Alarm Log to view
                                                those alarms. See Viewing the Alarm Log.
                                                NOTE: In case of bad communications or setup changes on devices, some
                                                alarms may display in the active state even though they have dropped out
                                                already. In this case, click the Home tab to refresh the user interface. If the
                                                alarms still appear in the active alarm list, either restart the SMS 4.0 server
                                                computer, or perform an IIS (Internet Information Services) reset at the host
                                                computer. To reset IIS:

                                                At the command prompt (Start > Programs > Accessories > Command
                                                Prompt), enter “iisreset.” The alarm will disappear from the list.

© 2004 Schneider Electric All Rights Reserved                                                                                   21
Using Alarms 63220-060-229A1
Viewing Alarm Information 4/2004
Viewing Active Alarms To view active alarms, click the Alarms tab; the Active Alarms page displays:
The Active Alarms view is shown by default. See Resizing Columns in Alarm
Windows for information on resizing, sorting, and getting details on entries.
Popup Alarms If you have set an alarm to display as a popup alarm, it displays on top of the
user interface:
Refer to How Alarms are Indicated—Audible, Popup View, or Both for details
on selecting this method of alarm indication.
If you resize or move the popup dialog or resize the columns, the browser
remembers those settings the next time you launch SMS4.0. If you close the
popup dialog, it automatically pops back up when a new alarm becomes
active.
22 © 2004 Schneider Electric All Rights Reserved63220-060-229A1 Using Alarms
4/2004 Viewing Alarm Information
Viewing the Alarm Log To view a log of all alarms in the SMS system, click the Alarm Log button. The
Alarm Log page displays.
Click an entry
to view details. Click here to sort by waveforms, or click any
other column header (such as Device or
Function) to sort by that column.
You can shorten the Alarm Log to display information for a single device. To
do so, click the entry in the list for the alarm. The alarm list is shortened to
include only those alarms that have been logged for that device.
You have the following choices for how to view the alarm log:
• Click All_Devices and then ALL ALARMS to view all alarms for all devices
in the SMS system.
• Click a group and then ALL ALARMS to view all alarms for a particular
group of devices.
• Click All_Devices or the group name that includes the device and then
click the device itself to view all alarms for that device only.
NOTE: If a device in Meters, Bar Charts, Tables, or Waveforms was selected
before displaying the alarm log, then this device will be selected by default in
the Alarm Log view.
The maximum number of entries displayed in the alarm log depends on the
alarm configuration. See Number of Alarm Records Displayed.
You can sort on any column, including the waveform column, which is the
unlabeled column to the left. To resize columns, refer to Resizing Columns in
Alarm Windows.
The Alarm Log Refresh Icon When a new entry is added to the Alarm Log, the Alarm Log Refresh icon
displays to the left of the Alarm Log button. The icon alerts you that there is
new information to be viewed.
© 2004 Schneider Electric All Rights Reserved 23Using Alarms 63220-060-229A1
Viewing Alarm Information 4/2004
After you click the Alarm Log button, the new information displays in the
Alarm Log, and the icon disappears. The number of records that display is
set in the Preferences window. See Number of Alarm Records Displayed.
Switching between devices in the tree view does not update alarms from the
server. Watch for the refresh icon. The icon displays any time new entries are
added to the Alarm Log on the server.
Viewing Waveform Information from the Alarm To view waveform information from the Alarm Log, waveforms must be
Log downloaded to the SMS 4.0 server. Waveforms are downloaded only when
you:
• configure a device in SMS to capture the waveform when an alarm
condition occurs
• assign a task in SMS to trigger an upload of the waveform
When the time stamp for the uploaded waveform is within –1 to +2 seconds
of the alarm’s time stamp, a waveform icon link appears next to the alarm
in the Alarm Log. However, because of the time it can take SMS to upload
the waveform, you may see an alarm entry in the Alarm Log with no
associated icon. The waveform icon link will display after the waveform is
completely uploaded. See Using Waveforms for more information.
NOTE: For the icon feature to work properly, ensure that SMS 4.0 has
uploaded all of the latest waveforms from each device. See Using
Waveforms.
To view a waveform file that is associated with an alarm in the Alarm Log,
follow these steps:
1. Click the Alarms tab.
The Active Alarms page displays.
2. Click the Alarm Log button.
24 © 2004 Schneider Electric All Rights Reserved63220-060-229A1 Using Alarms
4/2004 Viewing Alarm Information
The Alarm Log page displays:
Click the waveform icon to view the
waveform(s) associated with that alarm.
3. Click the waveform icon.
• If only one waveform is available for that alarm, then that waveform
displays.
• If multiple waveforms are available for the same alarm, the Waveform
Selection Dialog displays.
For information about viewing transient waveforms that are associated
with disturbance alarms in the Series 4000 Circuit Monitor, see Zooming
in to View Waveforms with Associated Transients.
4. Click the type of waveform you want to view and make your selection from
the list. Click OK.
© 2004 Schneider Electric All Rights Reserved 25Using Alarms 63220-060-229A1
Viewing Alarm Information 4/2004
The waveform page displays.
5. Click buttons on the waveform dialog toolbar to view the following
information:
• All—all three voltage phases and all three current phases of the
waveform
• Va—phase A voltage
• Vb—phase B voltage
• Vc—phase C voltage
• Ia—phase A current
• Ib—phase B current
• Ic—phase C current
• In—neutral current
• Ig/Ir—ground current; if the device is a CM2000, click here to view
residual current.
• 3—two graphs—one with all three voltage phases overlapped and the
other with all three current phases overlapped.
• V/I—each phase, voltage and current, in a single graph. You see phase
A voltage and current in one graph, phase B voltage and current in
another, and phase C voltage and current in a third.
• FFT—the FFT (Fast Fourier Transform) cycle range.
• RMS—the display as an RMS (root mean square) plot.
NOTE: If you select a type of graph that does not apply for a waveform of
that particular device, the “All” view displays instead.
26 © 2004 Schneider Electric All Rights Reserved63220-060-229A1 Using Alarms
4/2004 Viewing Alarm Information
Viewing Details about an Alarm To view detailed information for a single alarm from either the Active Alarms
page or the Alarm Log, click the alarm for which you want details. The detail
page displays:
Item Definition
Time of The date/time the alarm
Occurrence picked up.
Device The device name (from SMS)
Function The function set up for this
alarm in SMS
State The current state of the
alarm: pickup or dropout
Level The level of severity set up for
this alarm in SMS
Type For PC-based: digital or
analog
For all onboard: onboard
Value The value at the time the
alarm picked up.
Click the up and down arrows to scroll through information on alarms on the
page you are viewing.
Resizing Columns in Alarm Windows You can drag the borders of columns in the following windows to resize them:
• Alarm Log
• Active Alarms
• popup alarms
You can also resize the columns to fit the longest entry for that particular
column. To do so, follow these steps:
1. Point the mouse to the edge of the column so that the resizing tool
displays.
2. Double-click.
The column will automatically resize to the longest entry in the column.
Drag the borders of
columns to resize them.
Double-clicking at the edge
of a column resizes to fit the
longest entry in that
column.
© 2004 Schneider Electric All Rights Reserved 27Using Alarms 63220-060-229A1
Viewing Alarm Information 4/2004
Sorting by Columns To sort a list by one of its columns, click the header of the column.
Click a header to
sort by column.
Printing the Alarm Log or Active Alarms List You can print a copy of the entire Alarm Log or Active Alarms list. To print
either file, follow these steps:
1. Display the Alarm Log or Active Alarms list.
2. Right-click any alarm that is listed.
The Windows Print screen displays; the default printer is the target printer
set up for the computer from which you are viewing the list.
3. Change the printer if desired. When the correct printer displays, click
Print.
The Alarm Log or Active Alarms list prints at the specified printer.
28 © 2004 Schneider Electric All Rights Reserved63220-060-229A1 Using Historical Data
4/2004 Historical Data Page
CHAPTER 7—USING HISTORICAL
DATA
HISTORICAL DATA PAGE The Historical Data page has two buttons that open two different pages:
reports and waveforms. Follow the instructions in this chapter to create and
view reports, and to capture waveforms in the Setup Utility and view them in
the browser.
USING REPORTS
Creating Reports in Information Manager If you have been given access to the Setup Utility, you can open it and create
historical reports that you will then view in the browser. Follow these steps:
1. Access the Setup Utility. See Opening the System Manager Setup Utility
for instructions.
2. You will use an SMS feature, Information Manager, to create reports:
From the SMS client window, click Reports > Information Manager >
Creation Wizard to launch the PowerLogic Reports wizard.
Refer to online help for instructions on using the report creation wizard.
From the SMS Information Manager application menu, click
Help > Contents and find the topic for the type of report you want to
create.
Once a report is created, it displays for viewing in the Reports window.
3. To be able to view a report, you must save it to the default reports folder.
Once it is saved, you can view it from the browser.
Viewing Reports To view reports, do the following:
1. Click the Historical tab.
2. Click the Reports button.
3. Select the report to be displayed: click the report name you want to view
and then click the appropriate time stamp.
The report displays.
If a scheduled report is configured to overwrite, then only one date and time
is listed under the report name. Each generated report overwrites the
© 2004 Schneider Electric All Rights Reserved 29Using Historical Data 63220-060-229A1
Using Waveforms 4/2004
previous one, and the date and time is updated. If a scheduled report is not
set to be overwritten, a list of reports with dates and times displays under
each report name. Refer to online help in SMS Information Manager for
information about configuring the overwrite setting.
NOTE: If an “overwrite” report is in the process of being updated, you will not
be able to view it until the update process is complete. If you try to access it,
you see an error message.
Refreshing the Report Tree You can refresh the list in the report tree. Any new reports that have been
saved in Information Manager will display in the list. To refresh the tree view,
click the refresh icon ( ).
USING WAVEFORMS
Capturing Waveforms You can view waveforms in the browser interface if they are first captured in
SMS and then saved in the waveforms folder on the SMS 4.0 server
computer (POWERLOGIC\SMS\Export\Comtrade). To capture (or acquire) a
waveform from SMS 4.0, connect to the Setup Utility (see Opening the
System Manager Setup Utility). For help on capturing waveforms, see the
Setup Utility online help file.
We recommend setting up a scheduled task to upload onboard waveforms
from each device. For example, you can schedule the task to run every night
at 11:00 pm. From within the Setup Utility, refer to Help > Setup Utility Help
> Setting Up Devices > Working with Functions and Alarms > Using Tasks to
Automate Processes and see the topics “Adding an Onboard Data Log/
Waveform Task” and “Creating a New Reference Time.”
Viewing Waveform Information Only To view waveform information only, do the following:
1. Click the Historical tab.
The Historical page displays.
2. Click the Waveforms button.
The Waveforms page displays:
30 © 2004 Schneider Electric All Rights Reserved63220-060-229A1 Using Historical Data
4/2004 Using Waveforms
3. Choose a waveform for a particular device. Do the following:
a. Click All_Devices or the group name that includes the device.
b. Click the device that has information you want to view.
c. Click the type of waveform you want to view.
d. Select the appropriate time stamp.
The waveform capture displays.
NOTE: If you selected a device in Meters, Bar Charts, Tables, or Alarm
Log, this device is selected by default when displaying waveform
information.
Zooming in to View Waveform Information
To zoom in for a closer view of a single phase of the waveform information,
click the graph for that phase.
Click any graph to
zoom in for a closer
view of that phase.
© 2004 Schneider Electric All Rights Reserved 31Using Historical Data 63220-060-229A1
Using Waveforms 4/2004
The phase that you clicked displays. The example below is for phase A-N
voltage:
To view a transient
waveform associated
with a disturbance from
a CM4000T, click its
square.
Zooming in to View Waveforms with Associated Transients
If you have a CM4000T in your system, you can view transients associated
with disturbance waveforms. To view a transient waveform, click the square
that indicates it. The “All” view displays for the transient:
Note that the back button ( ) displays on the left-hand side of the waveform
buttons. The back button continues to display as you switch between views
of this transient. Click the back button to return to the disturbance capture.
To view a single phase of the transient, click the graph for that phase. The
phase view displays. The example below is for Phase A-N voltage.
• To zoom in further, continue clicking the area you want to magnify.
• To zoom out, click one of the tabs in the button bar.
32 © 2004 Schneider Electric All Rights Reserved63220-060-229A1 Using the System Tab
4/2004 Storing and Viewing Document Files and Web Links
CHAPTER 8—USING THE The System tab includes these features:
SYSTEM TAB • documentation and links
• preferences
STORING AND VIEWING DOCUMENT You can store document files and links to web sites on the server computer
FILES AND WEB LINKS in the POWERLOGIC\SMS\Web\Maintenance folder. Once they are stored
and the browser is refreshed, you can view them using the Documentation
and Links option on the System tab.
NOTE: When upgrading from an earlier version of SMS, only documents with
these extensions will display in the Documentation list:
• .htm
• .html
• .asp
• .pdf
Files with other extensions are also moved to the Maintenance folder, but
they do not display in the Documentation list. If you want to view these other
files in SMS 4.0, you must do one of the following:
• convert each file to one of the extensions listed above
• create a file, such as an .html file, to link to each document
When you view a PDF document, the Adobe Acrobat Reader plug-in is
launched within the browser window. If you view a PDF document from a
browser that does not have Acrobat Reader installed, you can download it
from the Adobe website, www.adobe.com.
Storing Documents and Web Links Several links are already loaded on the server computer: Internet links to
POWERLOGIC, Square D, and Schneider Electric web pages, an HTML
version of this manual, and a PDF version of this manual. Additional
documents and HTML links can be added on the SMS 4.0 server. For
example, you might want to store power equipment drawings, additional user
guides, or links to your own web site.
To add a document or web link, place it in the
POWERLOGIC\SMS\Web\Maintenance folder on the SMS 4.0 server
computer. Remember that only .htm, .html, .asp, and .pdf files display in the
SMS 4.0 browser. As soon as the document or web link is added to the
Maintenance folder, it is available for use; click the home icon to refresh the
view and display the link.
Web-Enabled Devices When you designate a MODBUS/TCP connection in SMS as “web-enabled,”
you can browse to that connection from SMS 4.0. In most PowerLogic
systems, a web-enabled device is a gateway or an Ethernet-enabled device.
Data from the device is viewable in a standard browser interface.
To view a web-enabled device in SMS 4.0, you first create a web-enabled
communication connection in the Setup Utility. The IP address for the
connection automatically displays in the SMS 4.0 Web Enabled Devices list
(System tab > Documentation and Links).
© 2004 Schneider Electric All Rights Reserved 33Using the System Tab 63220-060-229A1
Setting User Preferences 4/2004
Viewing Real-time Data from a Power Server
If you try to simultaneously view real-time power server data and real-time
SMS data, the power server data may not display correctly. To view power
server real-time data while viewing SMS real-time data, open a separate
browser window and link directly to the power server.
However, you can use SMS 4.0 to view information from devices that
communicate through a power server. If the power server is only a gateway
for these devices, the real-time information displays correctly in the browser.
Viewing Documents and Web Links To view files stored in the Documents and Web Links library, do the following:
1. Click the System tab.
2. Click the Documentation and Links button.
The Documentation and Links page displays.
3. Choose from Documentation, PDFs, or Web Enabled devices; then
select the document or link to be displayed.
When viewing large files, it may take several minutes for the document to
open.
Web-enabled devices display here only if they are designated “web-
enabled” when they are added in the Setup Utility. If you view a power
server as a web-enabled device, remember that real-time data may not
display correctly. Therefore, to view real-time data from a power server,
you should open a separate browser window and link directly to the
power server.
SETTING USER PREFERENCES You can set several user-configurable preferences on the Preferences page.
This chapter covers procedures for setting these preferences. It also covers
other adjustments you can make for viewing information on screens.
To access the Preferences page, click the System tab, then the Preferences
button.
34 © 2004 Schneider Electric All Rights ReservedYou can also read