Combination of high-frequency ultrasound and virtual touch tissue imaging and quantification improve the diagnostic efficiency for mild carpal ...
←
→
Page content transcription
If your browser does not render page correctly, please read the page content below
Lai et al. BMC Musculoskeletal Disorders   (2021) 22:112
https://doi.org/10.1186/s12891-021-03982-7

 RESEARCH ARTICLE                                                                                                                                   Open Access

Combination of high-frequency ultrasound
and virtual touch tissue imaging and
quantification improve the diagnostic
efficiency for mild carpal tunnel syndrome
Zhen-han Lai1†, Shu-ping Yang1†, Hao-lin Shen1, Yi Luo1, Xiao-han Cai1, Wen-ting Jiang1, Li-ping Liao1,
Kun-bin Wu1 and Guo-rong Lv2,3*

  Abstract
  Background: Carpal tunnel syndrome (CTS) is the most common entrapment symptom in the peripheral nerves.
  High-frequency ultrasound (HFUS) is widely used in the diagnosis of CTS. Virtual Touch Tissue Imaging and
  Quantification (VTIQ), which provides more information about the hardness of organization, is used to diagnose
  CTS. However, the data of diagnostic value of them in various degrees of CTS are limited. Whether the combination
  of HFUS and VTIQ can improve the diagnostic efficiency also remains unknown. The study aimed to explore the
  diagnostic value of HFUS and VTIQ in various degrees of CTS and whether combination of HFUS and VTIQ could
  improve the diagnostic efficiency of CTS.
  Methods: A collection and analysis of 133 CTS patients and 35 volunteers from January 2016 to January 2019 were
  performed. We compared the clinical characteristics, cross-sectional area (CSA) value and shear wave velocity
  SWVmean value of CTS group with volunteer group.
  Results: The CSA value and SWVmean value of CTS cohort were significantly higher than volunteer group (10.79 ±
  2.88 vs. 8.06 ± 1.39, p < 0.001, 4.36 ± 0.95 vs. 3.38 ± 1.09, p < 0.001, respectively). The area under the curve (AUC) of
  receiver operating characteristic (ROC) curve of CSA value and SWVmean value were 0.794 and 0.757, respectively.
  Hierarchical analysis of CSA value and SWVmean value showed that the AUC in the moderate and severe CTS group
  were higher than in mild CTS group. Furthermore, the CSA value combined with SWVmean value used to diagnose
  mild CTS was 0.758, which was higher than that of single CSA value or single SWVmean value.
  Conclusions: Both HFUS and VTIQ technology were feasible to evaluate CTS. HFUS was suitable for use in
  diagnosis of moderate and severe CTS. For mild CTS, combination of HFUS and VTIQ was relevant to improve the
  diagnostic efficiency of CTS.
  Keywords: High-frequency ultrasound, Virtual touch tissue imaging and quantification, Carpal tunnel syndrome

* Correspondence: lgr_feus@sina.com
†
 Zhen-han Lai and Shu-ping Yang contributed equally to this work and
should be considered co-first authors.
2
 Collaborative Innovation Center for Maternal and Infant Health Service
Application Technology, Quanzhou 362000, Fujian, China
3
 Department of Ultrasound, Second Affiliated Hospital of Fujian Medical
University, Quanzhou 362000, Fujian, China
Full list of author information is available at the end of the article

                                        © The Author(s). 2021 Open Access This article is licensed under a Creative Commons Attribution 4.0 International License,
                                        which permits use, sharing, adaptation, distribution and reproduction in any medium or format, as long as you give
                                        appropriate credit to the original author(s) and the source, provide a link to the Creative Commons licence, and indicate if
                                        changes were made. The images or other third party material in this article are included in the article's Creative Commons
                                        licence, unless indicated otherwise in a credit line to the material. If material is not included in the article's Creative Commons
                                        licence and your intended use is not permitted by statutory regulation or exceeds the permitted use, you will need to obtain
                                        permission directly from the copyright holder. To view a copy of this licence, visit http://creativecommons.org/licenses/by/4.0/.
                                        The Creative Commons Public Domain Dedication waiver (http://creativecommons.org/publicdomain/zero/1.0/) applies to the
                                        data made available in this article, unless otherwise stated in a credit line to the data.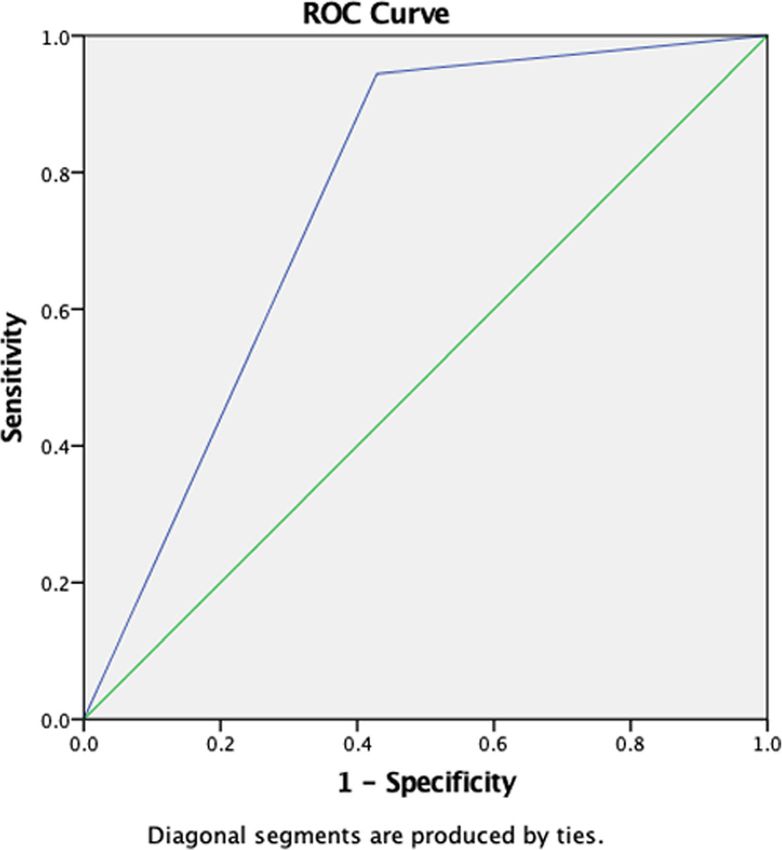
Lai et al. BMC Musculoskeletal Disorders   (2021) 22:112                                                          Page 2 of 9

Background                                                      University. Between January 2016 and January 2019, we
Carpal tunnel syndrome (CTS) is a common entrapment             collected a total of 133 patients of CTS and 35 healthy vol-
neuropathy of the median nerve characterized by pares-          unteers. The diagnostic criteria of CTS were according to
thesias and pain in the first to fourth digits. The differ-     the American Academy of Neurology, which included clin-
entiations of anatomical variations, such as those of the       ical history, symptoms, and evidence of slowing of distal
palmaris longus (accessory tendons, “reversed” palmaris         median nerve conduction [15, 16]. The inclusion criteria
longus, palmaris profundus muscle), persistent median           were as follows: (1) Numbness in the three fingers of the
artery, “bifid” median nerve and others, are a prerequis-       radial side, (2) A history of numbness at night, (3) Atrophy
ite condition for the development of CTS [1]. The diag-         of the thenar muscles, (4) The clinical manifestations and
nosis of carpal tunnel syndrome is mostly based on a            auxiliary examinations of the patients all conformed to dif-
combination of clinical symptoms, signs, and an imaging         ferent degrees of carpal tunnel syndrome, (5) Actively co-
examination. Medical ultrasound, an imaging modality,           operate with treatment and postoperative follow-up. All
is more and more popular in the diagnosis of CTS [2, 3].        CTS patients met all the above inclusion criteria. The ex-
   In recent years, ultrasound has been used in many fields     clusion criteria were as follows: (1) history of wrist trauma
since it provided supplement diagnostic guidance, such as       surgery, (2) space-occupying lesions in the carpal canal, (3)
parotids gland [4], central lung lesions [5], prostate cancer   combination with other peripheral nerve diseases, such as
[6], as well as CTS [7]. Fowler et al [8] has reported that     thoracic outlet syndrome, cubital tunnel syndrome, and
the composite sensitivity and specificity of ultrasound for     carpal ulnar tunnel syndrome, (4) lost in following up. We
the diagnosis of CTS were 77.6 and 86.8%, respectively, in      further divided CTS into mild, moderate, and severe stage,
a meta-analysis. Kapuścińska et al [9] also found that          according to criteria as previous reported [17]. The control
ultrasound imaging with the use of high-frequency ultra-        group included 35 healthy volunteers, they did not fulfill
sound (HFUS) was a valuable diagnostic tool for assessing       any of the following criteria: (1) Numbness in the three fin-
the surgical treatment in CTS patients. The ultrasound          gers of the radial side, (2) A history of numbness at night,
examination is a subjective method which depends on the         (3) Atrophy of the thenar muscles, (4) Other disorders
expertise of the physician. Therefore, more and more re-        such as upper limb trauma, hypertension, diabetes, hyper-
search reported that newer ultrasound techniques, such as       thyroidism, or hypothyroidism. They received the same
power Doppler, microvascular imaging, and elastography,         ultrasound evaluation protocol as provided for CTS
might improve the specificity and sensitivity of ultrasound     patients. All patients and healthy volunteers provided
examination in the evaluation of CTS [2, 10, 11].               informed written consent. The ethics committee of our
   Virtual Touch Tissue Imaging and Quantification (VTIQ)       hospital approved this study (no.2018-LX-015).
is a kind of shear wave elastography (SWE) with wider
range and smaller region of interest (ROI) of sampling          Electrodiagnostic examinations
frame than other detection methods [12, 13]. Zhang et al        Electrodiagnostic examinations were performed accord-
[14] reported that median nerve SWV at the carpal tunnel        ing to the protocol suggested by Li et al [18] for CTS pa-
inlet was significantly higher than patients with CTS, which    tients. The four-way EMG induction potentiometer of
indicated that VTIQ appeared to be a highly reproducible        KEYPOINT 4 from Denmark was used in this study.
diagnostic technique. Therefore, VTIQ provides more ob-
jective and directional information about the hardness of       High-frequency ultrasound diagnosis (HFUS)
organization and reflects the difference in mechanical prop-    Ultrasound imaging was performed using a 9 L-4 probe
erties between inner organizational structure.                  and a standard 4–9 MHz transducer (Acuson S3000;
   Although HFUS and VTIQ have been used to diagno-             Simens AG). Participants were seated with forearm supi-
sis CTS in previous studies, the data of diagnostic value       nated, the wrist resting on a flat surface in a neutral pos-
of them in various degrees of CTS are limited. Whether          ition and palm up. Enough amount of coupling agent
the combination of HFUS and VTIQ can improve the                was used to the skin. The probe was positioned perpen-
diagnostic efficiency also remains unknown. Therefore,          dicular to the surface of the median nerve gently without
the purpose of this study was to explore the diagnostic         any pressure. The median nerve was scanned from the
value of HFUS and VTIQ in various degrees of CTS and            cross-section of the forearm from the socket of the
whether combination of HFUS and VTIQ could improve              elbow to the wrist for showing the cross-section of the
the diagnostic efficiency of CTS.                               median nerve. The transducer was rotated 90 ° to scan
                                                                along the long axis of the nerve (Fig. 1a). The median
Methods                                                         nerve cross-sectional area (CSA) was measured by the
Subjects                                                        pisiform bone as a reference (Fig. 1b). Each participant
This study was performed at the Department of Ultra-            was examined three times by the same radiologist, and
sound, Zhangzhou Affiliated Hospital of Fujian Medical          the mean value was the outcome.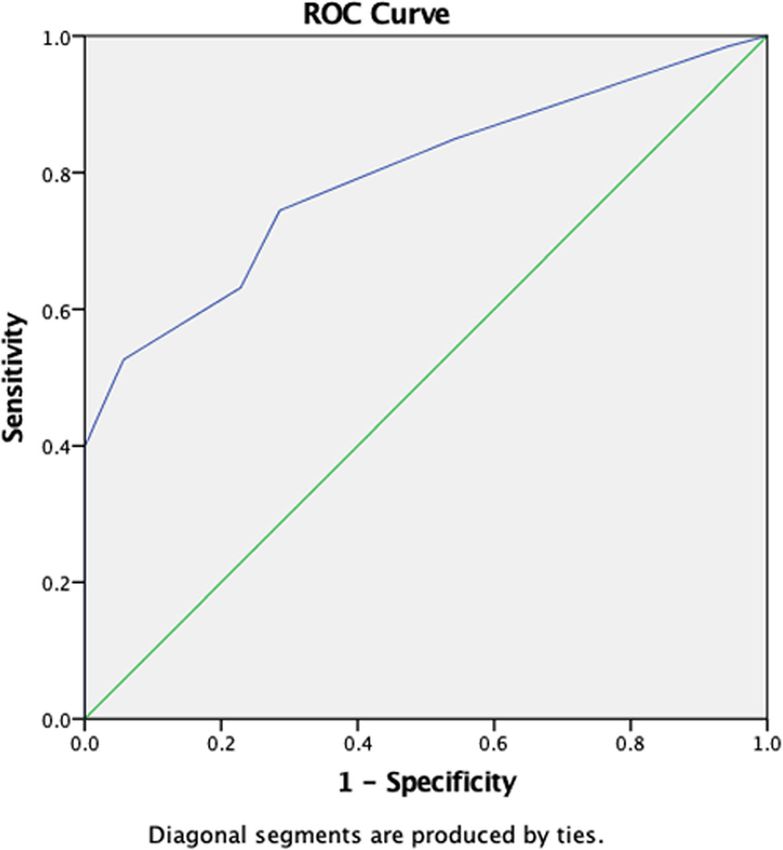
Lai et al. BMC Musculoskeletal Disorders   (2021) 22:112                                                                                Page 3 of 9

 Fig. 1 Ultrasound diagnosis (a) The longitudinal section of HFUS showed thickening of the middle normal nerve in carpal canal, decreased echo,
 and increased blood flow signal in power Doppler ultrasound; b Median nerve CSA was measured using the pisiform bone as a reference; c ROI
 was measured three times at the carpal tunnel inlet and outlet parallel to the pisiform bone and groove bone and different areas in the median
 nerve at the midpoint of the carpal canal

Virtual touch tissue imaging quantification (VTIQ)                        for categorical variables. Chi-squared test or Fisher’s
An image was generated from using a 4–9 MHz and 9 L-4                     exact test was used to compare the categorical vari-
probe combined with VTIQ. The radiologist placed the                      ables. Comparisons between CTS group and volunteer
transducer on the carpal tunnel surface parallel to the me-               group were made for continuous variables using Stu-
dian nerve. The probe was fixed respectively at the carpal                dent’s t test. One-way ANOVA was used to compare
tunnel inlet and outlet parallel to the pisiform bone and                 the continuous variables between groups stratified by
groove bone. The quality control model was used to                        CTS severity. Statistical significant was defined as p
evaluate the quality of the shear wave. In the image, a                   value less than 0.05.
high-quality area was labeled green, otherwise bad quality.
ROI was replaced at the good quality area. Then we                        Table 1 Demographic and clinical variables according to the
switched the velocity mode in the high-quality area and                   disease status of CTS
measured the SWV of the median nerve. The minimum                         Characteristic                  CTS             Volunteer         P
range of ROI was 1mm2 (multiplying 1 mm by 1 mm).                                                         (n = 133)       (n = 35)
ROI was measured three times at the carpal tunnel inlet,                                                                  (n = 1540)
and outlet parallel to the pisiform bone and groove bone                  Age [year, mean (SD)]           51.79 (12.94)   52.60 (11.72)     0.937
and different areas in the median nerve at the midpoint of                Gender (%)
the carpal canal (Fig. 1c). All parameters were measured                      Male                        32 (24.1)       10 (28.6)         0.661
by the double-blind method. As a result, the mean value                       Female                      101 (75.9)      25 (71.4)
(V mean) was calculated, namely, SWVmean.
                                                                          Location (%)                                                      0.851

Statistical analysis                                                          Left hand                   71 (53.4)       18 (51.4)
All data analyses were performed by SPSS software                             Right hand                  62 (46.6)       17 (48.6)
(IBM Corp. Released in 2015. IBM SPSS Statistics for                      CSAa [mm2, mean (SD)]           10.79 (2.88)    8.06 (1.39)       < 0.001
Windows, Version 23.0. Armonk, NY: IBM Corp.).                                 b
                                                                          SWV mean [m/s, mean (SD)]       4.36 (0.95)     3.38 (1.09)       < 0.001
The data were presented as the mean ± standard de-                        a
                                                                           cross-sectional area
viation (SD) for continuous variables and as a number                     b
                                                                           shear wave velocity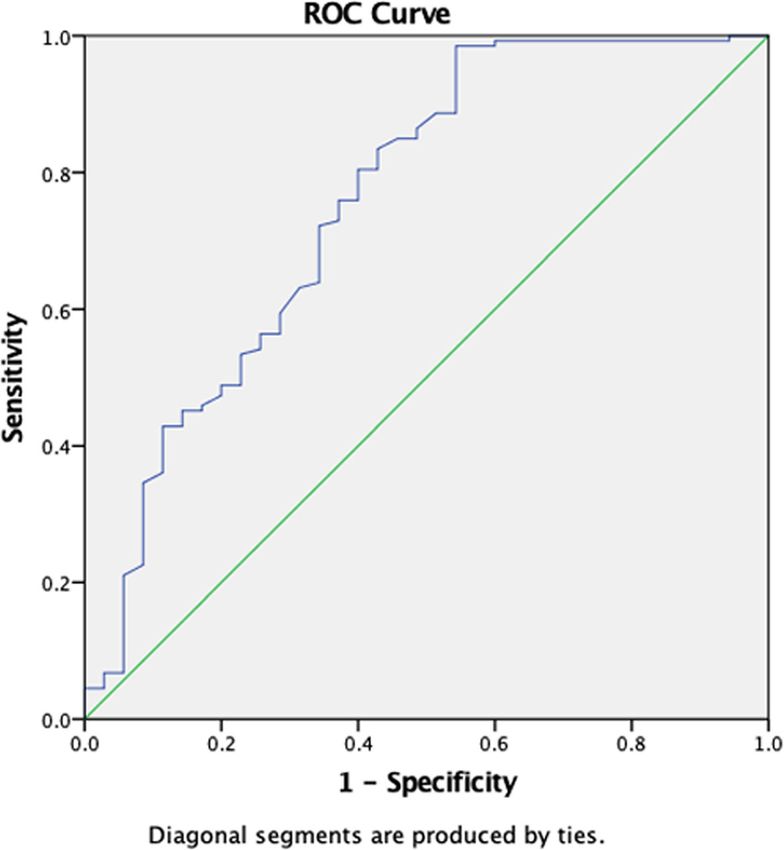
Lai et al. BMC Musculoskeletal Disorders (2021) 22:112 Page 4 of 9
Table 2 Demographic and clinical variables of patients with mild, moderate, and severe CTS
Clinical classification Mild Moderate Severe P
(n = 36) (n = 46) (n = 51)
(n = 1540)
Age [year, mean (SD)] 50.47 (15.04) 54.22 (12.51) 52.55 (11.63) 0.431
Gender (%) 0.394
Male 26 (72.2) 33 (71.7) 42 (31.6)
Female 10 (27.8) 13 (28.3) 9 (17.6)
Location (%) 0.390
Left hand 17 (47.2) 23 (50.0) 31 (60.8)
Right hand 19 (52.8) 23 (50.0) 20 (39.2)
CSAa [mm2, mean (SD)] 9.03 (1.95) 10.35 (2.25) 12.43 (3.07) 0.05). Demo-
and 35 volunteers) were listed in Table 1. The CSA graphic and clinical variables of patients with mild,
value of the CTS cohort was significantly higher than moderate, and severe CTS were summarized in
volunteers (10.79 ± 2.88 vs. 8.06 ± 1.39, p < 0.001), while Table 2. The CSA and SWVmean value increased sig-
the SWVmean value also significantly higher than nificantly with the aggravation of the disease severity.
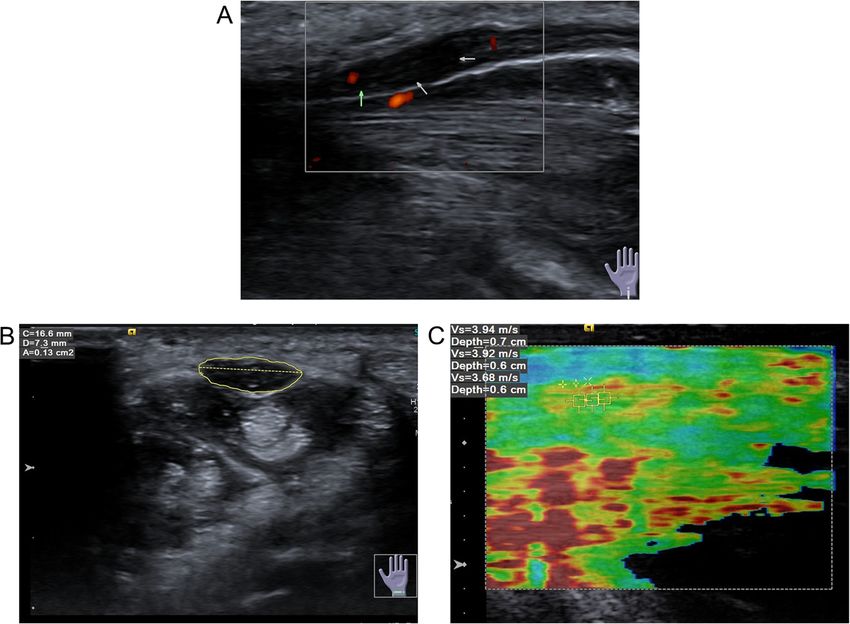
Fig. 2 ROC curve for CSA value in diagnosing CTSLai et al. BMC Musculoskeletal Disorders (2021) 22:112 Page 5 of 9
There is no statistically difference in other parameters 0.803 and 0.893, which were significantly higher than
among three groups. mild CTS (AUC, 0.641). Therefore, HFUS had a better
performance in diagnosis of moderate or severe CTS.
Diagnostic efficiency of HFUS combined VTIQ for mild-CTS However, diagnostic efficiency of HFUS should be fur-
We initially drew receiver operating characteristic ther improved for mild CTS patients.
(ROC) curves for CSA value in diagnosing CTS (Fig. 2). We performed ROC curve for SWVmean value in diag-
Youden index was calculated to acquire the optimum nosing CTS (Fig. 4). The curve graph showed that the
threshold value. The sensitivity, specificity and accuracy AUC was 0.757. According to the various degrees of CTS,
were used to evaluate the diagnostic efficiency. 8.50 mm2 we performed hierarchical analysis of SWVmean value
(AUC, 0.794; 95% confidence interval, 0.723–0.864), the (Fig. 5). Hierarchical analysis suggested that the AUC in
threshold value of the CSA for diagnosing CTS by mild, moderate, and severe CTS group were 0.742, 0.718
HFUS, the sensitivity, specificity and accuracy were 74.4, and 0.778 respectively. The results revealed that the diag-
71.4 and 79.4%, respectively. According to CTS stages, nostic efficiency of HFUS for mild CTS was lower than
we performed hierarchical analysis of CSA based on dif- that of VTIQ. But the diagnostic efficiency of HFUS for
ferent degrees (Fig. 3). The results showed that the AUC moderate and severe CTS was higher than that of VTIQ.
in moderate and severe CTS group were respectively Furthermore, we conducted a ROC curve for CSA
Fig. 3 ROC curve for CSA value in diagnosing different degree of CTS (a. mild CTS; b moderate CTS; c severe CTS)Lai et al. BMC Musculoskeletal Disorders (2021) 22:112 Page 6 of 9
Fig. 4 ROC curve for SWVmean value in diagnosing CTS
combined with SWVmean value in diagnosing mild CTS 10 mm2, which was consistent with our findings.
(Fig. 6). We found that the AUC was 0.758. The sensitiv- HFUS was considered to have the highest diagnostic
ity, specificity and accuracy were 94.4, 57.1, and 75.8% re- value in evaluating median nerve CSA because the lo-
spectively. Hence, combination of HFUS and VTIQ can cation of median nerve at the level of pisiform bone
improve the diagnostic efficiency of mild CTS. is superficial, easy to display, and the swelling was
most obvious. According to ROC curve, the optimum
Discussion threshold value was 8.50 mm2 (AUC, 0.794; 95% con-
CTS is the most common entrapment neuropathy fidence interval, 0.723–0.864) in our study. At the
and it is caused by compression of the median nerve optimum threshold value, the sensitivity, specificity
at the wrist. It is a clinical syndrome characterized by and accuracy of HFUS were 74.4, 71.4, and 79.4%
paresthesia and dysfunction in the corresponding in- respectively. These results showed that HFUS had a
nervated area due to the compression of median higher diagnostic efficiency.
nerve in the carpal canal [19]. In the past, the diag- However, studies have shown that about 30% of CTS
nosis of carpal tunnel syndrome largely depends on patients, median nerve CSA did not increase and was
clinical manifestations and electromyography. With not associated with the stage of disease, hence it is not
the development of ultrasound technology, HFUS can enough to diagnose median nerve disease by observing
clearly show the morphological changes of the median CSA only [23]. According to the degree of CTS, we per-
nerve in the carpal canal and the anatomical relation- formed a hierarchical analysis of CSA. (Fig. 3). Results
ship with the surrounding tissues so that the location demonstrated that the AUC in moderate and severe
and causes of the median nerve compression in the CTS group were 0.803 and 0.893 respectively, which was
wrist can be clarified [20]. significantly higher than in mild-CTS (AUC, 0.641).
Our study found that the CSA value was 10.79 ± HFUS yielded a high diagnostic efficiency in moderate
2.88 mm2 in CTS cohort, which was significantly or severe CTS patients, but this was not case in mild
higher than in volunteers. In previous report [21, 22], CTS patients. Therefore, diagnostic efficiency of mild
the median nerve abnormality CSA was higher than CTS patients should be further improved.Lai et al. BMC Musculoskeletal Disorders (2021) 22:112 Page 7 of 9 Fig. 5 ROC curve for SWVmean value in diagnosing different degree of CTS (a. mild CTS; b moderate CTS; c severe CTS) The SWV of median nerve was measured by VTIQ VTIQ can provide more objective and direct informa- technology to diagnose CTS, indicating that the nerve tion about the hardness of the organization and reflect hardness of wrist CTS was higher than that of the con- the difference in mechanical properties within the trol group in this study. The SWVmean value of CTS co- organization, which is the main reason why this new hort was also significantly higher than volunteers (4.36 ± technology can be used to diagnose CTS. Figure 4 0.95 vs. 3.38 ± 1.09, p < 0.001). By using the SWE tech- showed that the AUC was 0.757 in ROC for SWVmean nique, the pathological mechanism of CTS showed that value. According to the various severity of CTS, we per- the continuous increase of carpal canal pressure over a formed hierarchical analysis of SWVmean value (Fig. 5). long period of time, which affected the circulation of Results showed that the AUC in mild, moderate, and se- median nerve, leading to a series of nerve membrane vere CTS group were 0.742, 0.718, and 0.778, respect- edema, fibroblast infiltration and nerve fiber de- ively. The above results suggested that the diagnostic generation, and then the median nerve was damaged. efficiency of HFUS for mild CTS was lower than that of Increased median fibrosis and pressure in the VTIQ. At 2.955 m/s (AUC, 0.742; 95% confidence inter- carpal canal may lead to increased nerve hardness val, 0.627–0.857) in this study, which was accepted as of CTS [14]. the threshold value of the SWVmean for diagnosing mild
Lai et al. BMC Musculoskeletal Disorders   (2021) 22:112                                                                              Page 8 of 9

 Fig. 6 ROC curve for CSA combined with SWVmean value in diagnosing mild CTS

CTS by VTIQ, the sensitivity, specificity, and accuracy               different in patients with different degrees of CTS and
were 94.4, 40, and 74.2%, respectively.                               the early SWE value may not change.
  VTIQ technology indirectly provided the soft and hard                 Several limitations of the present study required con-
information of the study object only. There are other fac-            sideration. First, this is a single-center study. It would be
tors that affect truly soft and hard degree of the tissue             necessary to conduct larger, multi-center studies of the
reflected by elastography technology, which isthe possible            general population in the future. Second, this study had
reason that the diagnostic efficiency of VTIQ and technol-            a small sample size, which did not allow for a subgroup
ogy on CTS is lower than that of HFUS and technology                  or stratified analysis.
suggested by the results of this study. Interestingly, we               To sum up, both HFUS and VTIQ technology were
performed a ROC curve for CSA value combined with the                 feasible to evaluate CTS. We recommended that HFUS
SWV mean value of mild CTS. As revealed in the Fig. 6,                was used to diagnose moderate and severe CTS group,
the curve showed that the AUC was 0.758. The sensitivity,             which was more economical than VTIQ. For mild CTS,
specificity, and accuracy were 94.4, 57.1, and 75.8%                  combination of HFUS and VTIQ is suggested to im-
respectively. Hence, combination of HFUS and VTIQ can                 prove diagnostic efficiency.
improve the diagnostic efficiency of mild CTS.
  We found that the application of VTIQ technology did                Abbreviations
not improve the diagnostic efficiency of CTS. The rea-                CTS: Carpal Tunnel Syndrome; HFUS: High-Frequency Ultrasound;
sons may be related to the measurement limitations of                 VTIQ: Virtual Touch Tissue Imaging and Quantification; SWE: Shear Wave
                                                                      Elastography; ROI: Region of Interest; SWV: Shear Wave Velocity; CSA: Cross-
VTIQ technology. Firstly, the median nerve was thin                   Sectional Area; ROC curve: Receiver Operating Characteristic curve; AUC: Area
and superficial, especially in the carpal canal. The probe            Under Curve
needs to be pressed against the skin during operation,
which was inevitably affected by external forces and
                                                                      Acknowledgements
other factors. Secondly, the swelling of the median nerve             We thank Li-Da Chen from doctoral Workstation of Zhangzhou Hospital Affili-
in the carpal canal and the elastic modulus were                      ated to Fujian Medical University for his technical support.
Lai et al. BMC Musculoskeletal Disorders (2021) 22:112 Page 9 of 9
Authors’ contributions 11. Karahan AY, Arslan S, Ordahan B, Bakdik S, Ekiz T. Superb microvascular
ZHL, SPY, GRL and HLS conceived and designed the study, analyzed data imaging of the median nerve in carpal tunnel syndrome: an
and drafted this manuscript. XHC, WTJ, LPL and KBW contributed to analysis Electrodiagnostic and Ultrasonographic study. J Ultrasound Med. 2018;
of the data, and revising of the manuscript. All authors have read and 37(12):2855–61.
approved the final manuscript. 12. Li X, Hou XJ, Du LY, Wu JQ, Wang L, Wang H, Zhou XL. Virtual touch tissue
imaging and quantification (VTIQ) combined with the American College of
Funding Radiology Thyroid Imaging Reporting and Data System (ACR TI-RADS) for
This work was supported by Natural Science Foundation of Zhangzhou City malignancy risk stratification of thyroid nodules. Clin Hemorheol Microcirc.
(ZZ2018J07). The sponsor had no role in study design, study conduction, 2019;72(3):279–91.
data collection, data analysis, data interpretation, or writing of the report. 13. Kilic A, Colakoglu Er H. Virtual touch tissue imaging quantification shear
wave elastography for determining benign versus malignant cervical lymph
nodes: a comparison with conventional ultrasound. Diagn Interv Radiol.
Availability of data and materials
2019;25(2):114–21.
The datasets used and/or analysed during the current study available from
14. Zhang C, Li M, Jiang J, Zhou Q, Xiang L, Huang Y, Ban W, Peng W.
the corresponding author on reasonable request.
Diagnostic value of virtual touch tissue imaging quantification for
evaluating median nerve stiffness in carpal tunnel syndrome. J Ultrasound
Ethics approval and consent to participate Med. 2017;36(9):1783–91.
The study was approved by the institutional review board of Affiliated 15. Keith MW, Masear V, Chung K, Maupin K, Andary M, Amadio PC, Barth RW,
Hospital of Fujian Medical University (2018-LX-015). All subjects both signed Watters WC 3rd, Goldberg MJ, Haralson RH 3rd, et al. Diagnosis of carpal
informed consent. tunnel syndrome. J Am Acad Orthop Surg. 2009;17(6):389–96.
16. You H, Simmons Z, Freivalds A, Kothari MJ, Naidu SH. Relationships between
Consent for publication clinical symptom severity scales and nerve conduction measures in carpal
Written consent has been obtained from all patients. tunnel syndrome. Muscle Nerve. 1999;22(4):497–501.
17. Sucher BM. Grading severity of carpal tunnel syndrome in electrodiagnostic
Competing interests reports: why grading is recommended. Muscle Nerve. 2013;48(3):331–3.
The authors declare that they have no known competing financial interests 18. Li C, Lü Y, Zhou A. Value of high-frequency ultrasound in diagnosis of carpal
or personal relationships that have any influence on the work reported in tunnel syndrome. J Nanchang Univ Med Sci. 2013;53(11):26–9.
this paper. 19. Rempel D, Evanoff B, Amadio PC, de Krom M, Franklin G, Franzblau A, Gray
R, Gerr F, Hagberg M, Hales T, et al. Consensus criteria for the classification
Author details of carpal tunnel syndrome in epidemiologic studies. Am J Public Health.
1
Department of Ultrasound, Zhangzhou Hospital Affiliated to Fujian Medical 1998;88(10):1447–51.
University, Zhangzhou 363000, Fujian, China. 2Collaborative Innovation 20. Elnady B, Rageh EM, Ekhouly T, Fathy SM, Alshaar M, Fouda ES, Attar M,
Center for Maternal and Infant Health Service Application Technology, Abdelaal AM, El Tantawi A, Algethami MM, et al. Diagnostic potential of
Quanzhou 362000, Fujian, China. 3Department of Ultrasound, Second ultrasound in carpal tunnel syndrome with different etiologies: correlation
Affiliated Hospital of Fujian Medical University, Quanzhou 362000, Fujian, of sonographic median nerve measures with electrodiagnostic severity.
China. BMC Musculoskelet Disord. 2019;20(1):634.
21. Seror P. Sonography and electrodiagnosis in carpal tunnel syndrome
Received: 7 July 2020 Accepted: 17 January 2021 diagnosis, an analysis of the literature. Eur J Radiol. 2008;67(1):146–52.
22. Moller I, Miguel M, Bong DA, Zaottini F, Martinoli C. The peripheral nerves:
update on ultrasound and magnetic resonance imaging. Clin Exp
Rheumatol. 2018;36(Suppl 114(5)):145–58.
References 23. Civelek E, Cansever T, Serdar K, Demiralay E, Demircay E. Comparison of
1. Kotov G, Iliev A, Georgiev G, Landzhov B. Clinical significance of anatomical histopathology of transverse carpal ligament in patients with idiopathic
variations in the carpal tunnel: literature review. Acta Morphol Anthropol. carpal tunnel syndrome and hemodialysis patients with carpal tunnel
2017;24:109–13. syndrome. Surg Sci. 2011;2(1):8–12.
2. Yoshii Y, Zhao C, Amadio PC. Recent advances in ultrasound diagnosis of
carpal tunnel syndrome. Diagnostics. 2020;10(8):596.
3. McDonagh C, Alexander M, Kane D. The role of ultrasound in the diagnosis Publisher’s Note
and management of carpal tunnel syndrome: a new paradigm. Springer Nature remains neutral with regard to jurisdictional claims in
Rheumatology. 2015;54(1):9–19. published maps and institutional affiliations.
4. Wierzbicka M, Kaluzny J, Ruchala M, Stajgis M, Kopec T, Szyfter W.
Sonoelastography--a useful adjunct for parotid gland ultrasound assessment
in patients suffering from chronic inflammation. Med Sci Monit. 2014;20:
2311–7.
5. He HY, Chen JL, Ma H, Zhu J, Wu DD, Lv XD. Value of Endobronchial
ultrasound Elastography in diagnosis of central lung lesions. Med Sci Monit.
2017;23:3269–75.
6. Gupta I, Freid B, Masarapu V, Machado P, Trabulsi E, Wallace K, Halpern E,
Forsberg F. Transrectal subharmonic ultrasound imaging for prostate Cancer
detection. Urology. 2020;138:106–12.
7. Deng X, Chau LP, Chiu SY, Leung KP, Hu Y, Ip WY. Prognostic value of
ultrasonography in predicting therapeutic outcome for carpal tunnel
syndrome after conservative treatment: a retrospective long-term follow-up
study. J Med Ultrasound. 2019;27(4):192–7.
8. Fowler JR, Gaughan JP, Ilyas AM. The sensitivity and specificity of ultrasound
for the diagnosis of carpal tunnel syndrome: a meta-analysis. Clin Orthop
Relat Res. 2011;469(4):1089–94.
9. Kapuscinska K, Urbanik A. High-frequency ultrasound in carpal tunnel
syndrome: assessment of patient eligibility for surgical treatment. J Ultrason.
2015;15(62):283–91.
10. Georgiev GP, Karabinov V, Kotov G, Iliev A. Medical ultrasound in the
evaluation of the carpal tunnel: a critical review. Cureus. 2018;10(10):e3487.You can also read