2019-2020 Department of Planning ...
←
→
Page content transcription
If your browser does not render page correctly, please read the page content below
2019-2020
Disclaimer
    This document has been published by the Housing Industry Forecasting Group.
    Any representation, statement, opinion or advice expressed or implied in this publication is
    made in good faith and on the basis that the members or their representatives are not liable
    for any damage or loss whatsoever which may occur as a result of action taken or not taken,
    as the case may be, in respect of any information, statement, opinion or advice referred to
    here.
    Professional advice should be obtained before applying the information contained in this
    document to particular circumstances.

    Published November 2019
    Website: www.hifg.net.au
    Email: cassandra.winzar@housing.wa.gov.au

2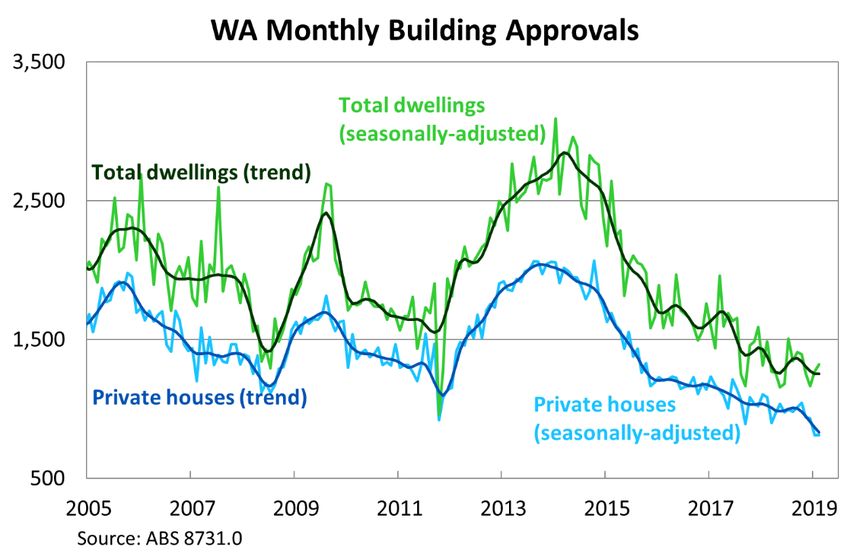
Table of Contents
    1     Introduction .................................................................................................................... 7
    2     Economic overview ........................................................................................................ 7
        2.1     Western Australian economy .................................................................................. 7
        2.2     Monetary and macroprudential policy settings ........................................................ 7
    3     Demand factors.............................................................................................................. 8
        3.1     Population growth ................................................................................................... 8
        3.2     Lot sales ................................................................................................................. 8
        3.3     Housing finance ...................................................................................................... 9
        3.4     First-home buyers ................................................................................................. 10
    4     Supply factors .............................................................................................................. 12
        4.1     Established market ............................................................................................... 12
        4.2     Private rental market ............................................................................................. 14
        4.3     Lot supply ............................................................................................................. 15
        4.4     Lot development trends ........................................................................................ 16
        4.5     Residential demolitions ......................................................................................... 17
        4.6     Building approvals................................................................................................. 18
        4.7     Dwelling commencements, completions and work in progress .............................. 19
    5     Other factors ................................................................................................................ 23
        5.1     Housing affordability ............................................................................................. 23
    6     Regional Housing Markets ........................................................................................... 24
        6.1     Regional established market ................................................................................. 24
        6.2     Regional rental markets ........................................................................................ 25
        6.3     New dwellings ....................................................................................................... 26
    7     Housing industry resources and challenges ................................................................. 27
        7.1     Construction costs, building materials and labour supply ...................................... 27
        7.2     Industry issues and short-term challenges ............................................................ 27
    8     Forecasts ..................................................................................................................... 28
        8.1     HIFG’s forecast of dwelling commencements ....................................................... 28
        8.2     Assessment of serviced residential lot supply ....................................................... 30
    Appendix A – Regional spotlight ......................................................................................... 31
    Appendix B – Housing Industry Forecasting Group ............................................................. 38

3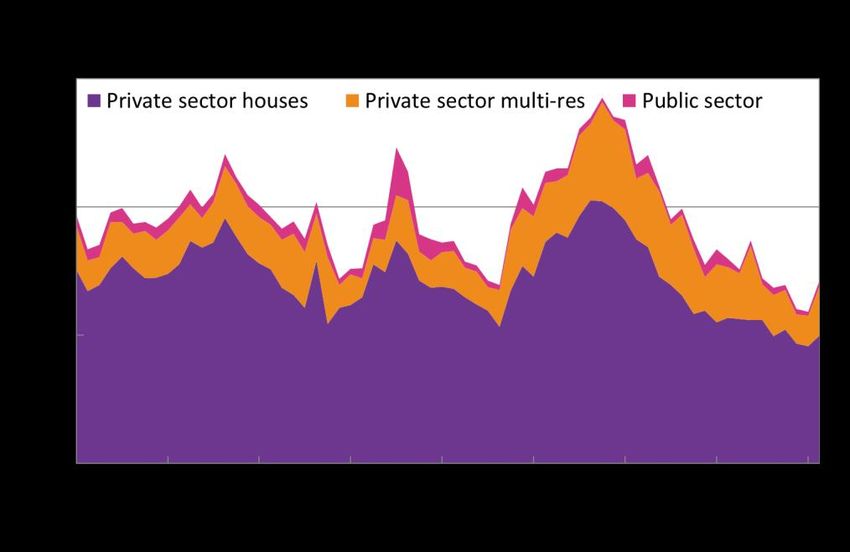
4
Executive Summary
    This report forecasts dwelling commencements in Western Australia (WA) for the financial
    years 2019-20 to 2021-22. The Housing Industry Forecasting Group (HIFG) predicts the
    following pattern of dwelling commencements:

                         HIFG Forecast of Dwelling Commencements in WA,
                                          2018-19 to 2021-221
                             Financial Year           Dwelling Commencements
                       2018-19 (actual)              15,608 (15,500 forecast)
                       2019-20 (forecast)            15,500
                       2020-21 (forecast)            15,500-17,000
                       2021-22 (forecast)            16,000-18,000

    Dwelling commencements in WA fell by 14% in 2018-19, in line with HIFG’s previous forecast.
    HIFG expects conditions to remain flat over the coming year with a subdued recovery over
    2020 through to 2022.

    The main factors behind these forecasts are:
          •   Population growth, despite some improvement, remains slow at 1.0% in the year to
              March 2019. It is expected to gradually increase over the forecast horizon.
          •   The established market remains soft overall, with further declines in the median house
              price over the past year, although there are significant variations at the suburb level.
              June quarter data shows the Perth median house price now sits at $485,000. The large
              amount of stock available in the established market continues to suppress prices in
              many areas.
          •   The Perth rental vacancy rate has continued to fall, and now sits at 2.5%, below what
              is considered a ‘balanced’ market. Anecdotal evidence suggests recent improvements

    1
        Data and forecasts finalised October 2019.

5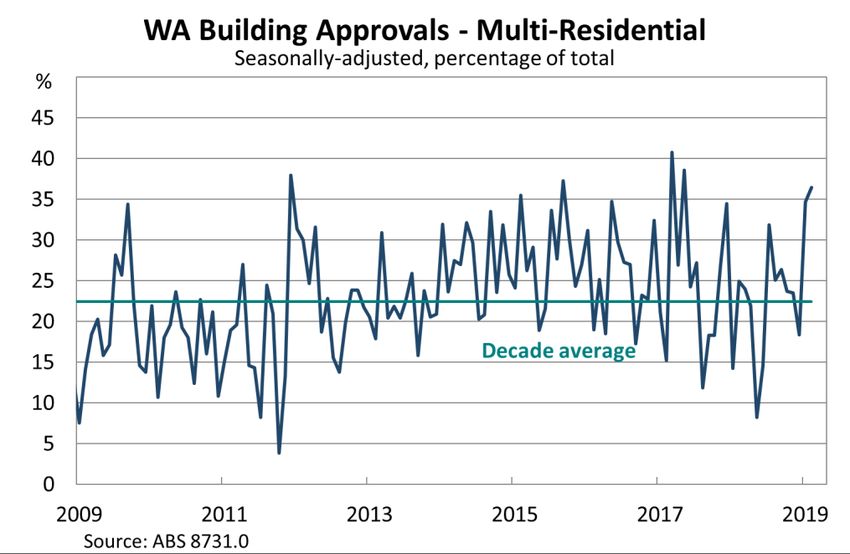
in rental affordability are increasing household formation, feeding through into demand
        for rental dwellings.
    •   Reductions in interest rates are having little flow-on impact to either the new or
        established housing markets. Lower rates are not increasing demand for dwellings but
        have had some positive impact on finance serviceability.
    •   Increases in Keystart income limits have had a positive impact on demand, although
        the numbers remain small.
    •   Forward-looking indicators such as building approvals and finance commitments
        continue to fall, although the rate of decline has slowed, suggesting any potential
        pick-up in new housing activity is still some months away.
    •   Positive signs continue to emerge for a general economic recovery, with some
        improvement in labour market conditions and State Final Demand. However, the pace
        of recovery remains slow.
    •   Despite lower house prices and rents, housing affordability remains a problem for
        those on low and even moderate incomes, when it comes to ownership. Current low
        levels of construction activity combined with the tightening rental market could lead to
        supply and affordability problems in the future.
    •   HIFG expects overall demand for new housing to pick up slowly over the forecast
        horizon, in line with economic improvements and a continued recovery in population
        growth.
    •   Due to continued weak demand, HIFG foresees no difficulty in meeting the predicted
        need for serviced residential lots in the forecast period.
    •   Changes to stamp duty on apartments and the inclusion of Perth as a regional centre
        are welcomed by the Group, as they may have a positive impact on dwelling
        commencements going forward.

6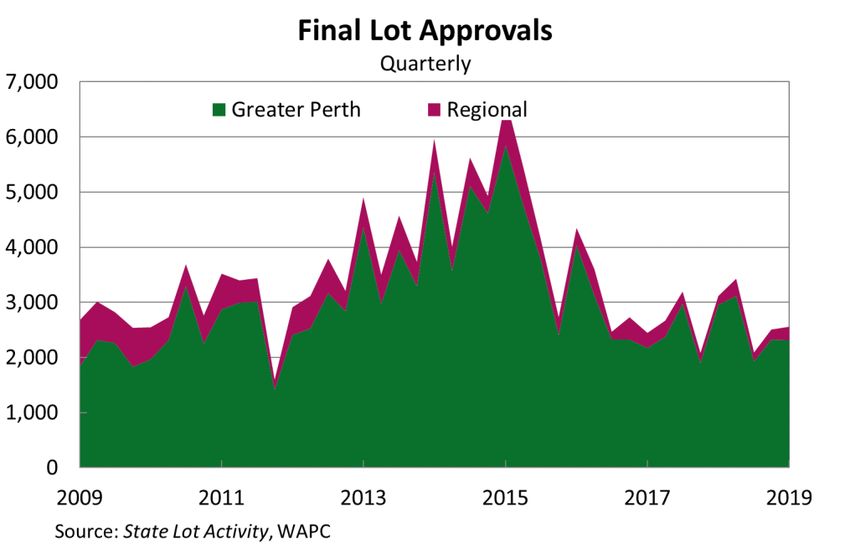
1 Introduction
    HIFG provides a forecast of dwelling commencements and residential lot availability for WA
    to assist government and industry in their forward planning. This report covers the period
    2019-20 to 2021-22.

    2 Economic overview
    2.1      Western Australian economy
    WA had the strongest growth in State Final Demand of any state in the June quarter, with
    economic output growing by 0.8% due to an increase in mining investment in machinery and
    equipment. However, the increase over the quarter was not enough to prevent the state’s
    economy from contracting by 1.1% in year-on-year terms, driven by business investment
    which fell by 8.7% over the year.
    The value of WA exports has grown significantly since this time last year. This has been
    assisted by higher commodity prices and new projects commencing production.
    Business conditions in some industries and locations not directly exposed to commodity
    investment remain soft. Conditions in small and medium-size businesses remain difficult,
    which can be seen in data showing flat unincorporated profits. For example, at a sector level,
    retail and construction have experienced falling profitability over the past five years, due to
    falling revenue and increasing costs.2
    The labour market has shown signs of improvement, in line with more positive operating
    conditions in mining and related industries. The unemployment rate fell to 5.8% in August
    2019. Since 2015, the unemployment rate has averaged 6.0%.
    Private sector wages have grown, increasing by 1.6% to June 2019. This is higher than the
    trough of 1% seen? in the year to June 2017, but remains relatively low historically. There are
    some signs of competition for skills emerging in the resources sector. However, mining
    projects and their employment represent a fraction of total employment, which will limit their
    ability to influence wages across the entire WA economy in the short-term.
    Leading survey indicators of economic conditions in WA indicate that consumers and
    businesses are less optimistic than this time last year. The Chamber of Commerce and
    Industry of WA (CCIWA) Consumer Confidence Survey shows that consumer confidence
    about medium-term prospects fell, with 30% of consumers expecting the WA economy to
    worsen over the next 12 months, up 12 percentage points since last quarter. The WA
    Super/CCIWA Business Confidence Survey shows that only 18% of businesses expect
    conditions to improve over the short-term, down 11% since June 2018. The ANZ/Property
    Council Survey for December 2019 showed confidence in the WA property sector fell in the
    quarter, but it remains above the national-average, and the second-highest of all the States.

    2.2      Monetary and macroprudential policy settings
    The Reserve Bank of Australia (RBA) has cut the cash rate to 0.75%, compared with 1.5% at
    this time last year. Many financial market commentators expect that the RBA will further
    reduce the cash rate in coming months in response to continued soft economic conditions.
    These cuts have yet to feed through into increased housing demand in WA, although they

    2   CCIWA Outlook July 2019.

7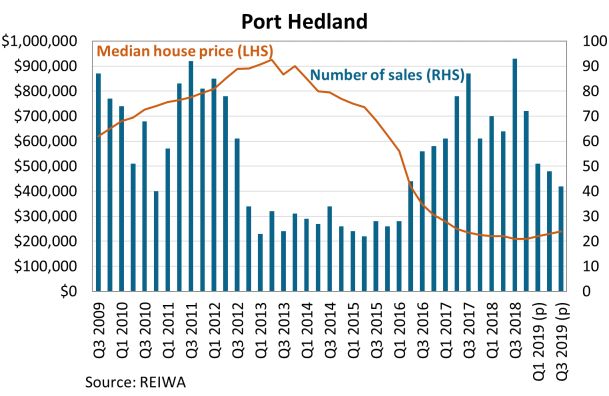
have had a positive impact on mortgage serviceability for existing owners and, theoretically,
    should make it easier for some households to secure mortgage finance.

    3 Demand factors
    3.1     Population growth
    Population growth in WA is increasing but remains subdued, up 1% in the year to March 2019
    (Figure 1). WA’s estimated residential population is now 2,615,794.
    WA’s population grew by 25,978 people over the year to March 2019, slightly higher than in
    the year to March 2018 (19,105). Net interstate migration continues to detract from growth,
    falling by 8,025 over the year, but was offset by net overseas migration which grew by 16,112.
    WA’s population growth remained below the national average of 1.6% in the year to March
    2019. WA Treasury is forecasting population growth to increase to 1.3% in 2019-20 and reach
    1.7% by 2022-23.3 Population growth remains key to any sustained recovery in the residential
    property market.

                                                     Figure 1

    3.2     Lot sales4
    Lot sales are an important forward indicator, as lots sold should lead to a dwelling
    commencement, albeit with a lag. The first six months of 2019 data from the Urban
    Development Institute of Australia (UDIA) WA showed that lot sales remain soft. Lot sales
    reported in the UDIA Urban Development Index survey for Greater Perth averaged 1,229 sales
    per quarter in 2018-19, 8.6% below average quarterly levels in 2017-18.

    3 2019-20 WA State Budget.
    4 This report uses “lot” to refer to subdivided land available for sale for the construction of dwelling(s).
    “Land” is used as a generic term to refer to land that has yet to be subdivided and made available for
    sale as lots. In simple terms, land needs to be available in order to deliver lots for dwelling construction.

8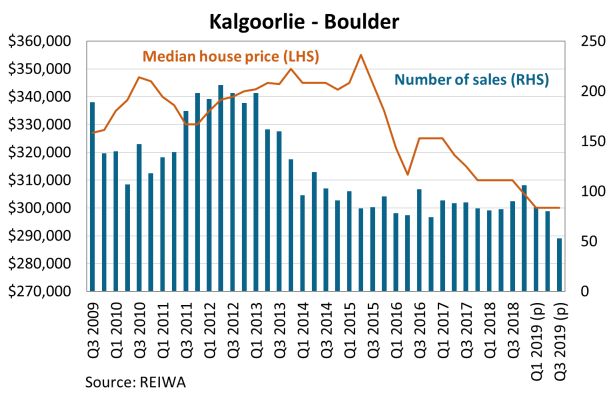
Lot sizes for Greater Perth increased in the first half of 2019 to 372sqm, after reaching a
record low of 365sqm in December 2018. Greater Perth’s average price per square metre
fell 2.1% over the June quarter to sit at $596, 1.1% lower than the corresponding quarter in
the previous year.
Figure 2 shows annual and quarterly changes in sales activity within five activity corridors:
• Lot sales in the South Western corridor increased slightly by 3.6% on a quarterly basis,
but fell 19.1% from the previous year.
• Lot sales in the South Eastern corridor were up 17.3% in the June quarter, but
remained 13.2% lower than the previous year.
• The North Western corridor reported the strongest growth in sales, up 35.4% in the
quarter and 4% over the year.
• North Eastern corridor lot sales were up 27.8% in the quarter, but remain 6.9% lower
over the year.
• Lot sales in the Peel region have reached a ten-year low, down 25.4% in the quarter
and 27.4% over the year.
Figure 2
REIWA estimates that residential lot sales in WA dropped over the year to June 2019 by a
very significant 29% to 5,770 sales. The REIWA median lot price in the Perth region fell by
3.2% over the year to $241,000. As land transactions usually take longer to settle than dwelling
sales, these figures will likely be revised.
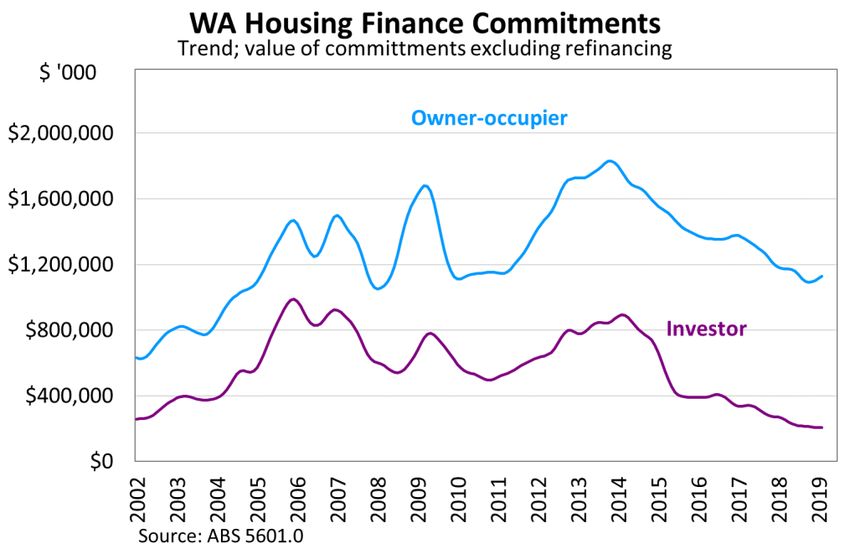
3.3 Housing finance
Finance commitments are a leading indicator of dwelling commencements. Finance
commitments for new housing construction have continued to trend downwards over most of
2018-19 (Figure 3), as has the value of total finance commitments (Figure 4). This will feed
through into levels of commencements.
9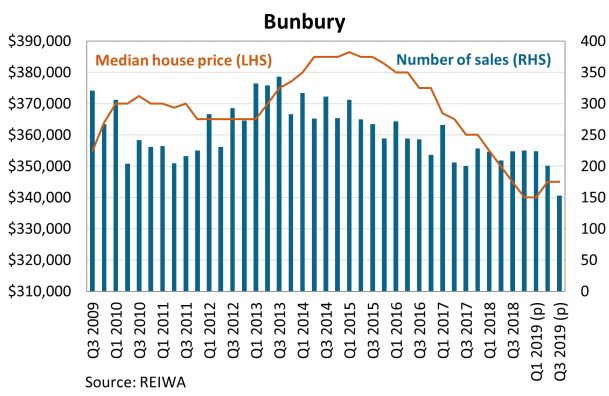
Figure 3

                                               Figure 4

     3.4       First-home buyers
     ABS data shows that first-home owner activity has fallen, in line with general market
     conditions. There were 14,262 dwellings financed by first-home buyers in 2018-19, 10% lower
     than the previous year (Figure 5). Despite the falling number, first-home buyers remain a high
     proportion of overall sales activity. First-home buyers made up around 36% of the total number
     of finance commitments in WA in 2018-19,5 slightly higher than the decade average. This is
     well above the national proportion of around 27%. Relatively low house prices in most suburbs
     have provided opportunities for first home buyers to enter the market, alongside funding

     5   Excluding refinancing.

10
opportunities from Keystart and generally low interest rates. Recent increases to Keystart
income limits have been positive, but loan numbers so far have been small.
Figure 5
The First Home Owner Grant (FHOG) for the purchase of established dwellings was removed
in October 2015. The grant for new dwellings remains at $10,000. A $5,000 boost payment
was introduced in December 2016 but removed in June 2017.
Analysis undertaken by REIWA using ABS and Office of State Revenue data estimates the
distribution of first home owner activity between established and new dwellings (Figure 6). The
available data suggests the boost payment increased first home owner activity in the newly
built segment during the time it was in place. First home buyer demand for established
dwellings consolidated as a result, because there was an incentive to skew decisions towards
newly built homes. Figure 6 shows the shift from established to new dwellings since the
reduction and subsequent removal of the grant for established dwellings.
11Figure 6
4 Supply factors
4.1 Established market
The number of house sales in Greater Perth decreased by 6% in the year to June 2019, while
multi-residential unit sales fell by 11% over the same period.
The amount of supply (listings) relative to demand in the established market is a key driver of
established prices. There were 10,905 houses and units listed for sale at the end of August
2019. The number of listings has fallen from 2018 but remains relatively high, placing
continued downward pressure on prices, particularly in the outer suburbs.
Figure 7
12The median house price has increased in some suburbs within Perth, despite an overall
softening in house prices. Price growth has been concentrated in inner city suburbs. REIWA
data shows that whilst some suburbs have observed growth in median house prices during
the year, median prices are falling for the vast majority of suburbs
(Figure 8). Price falls have moderated, but if current trends continue, it will be some time before
the majority of suburbs experience price growth.
Figure 8
There has been a big increase in the number of sales below $350,000;nearly 30% since 2017
(Figure 9). This reflects the fall in prices in many suburbs and an increase in availability of
cheaper apartments. The number of sales has declined over the period in all other price bands.
Figure 9
13Figure 10 shows how selling days have increased significantly since 2013, reflecting strong
availability of property in the established market. It is important to note that strong availability
and choice in the established market means less demand for new build dwellings.
Figure 10
4.2 Private rental market
The latest data from REIWA indicates the vacancy rate in Perth’s private rental market fell by
2.3 percentage points over the past year, reaching 2.5% in August 2019 (Figure 11). The
decline in the vacancy rate appears to have been caused by a combination of lower stock
levels and increased demand for properties.
Figure 11
14Overall median rents have stabilised, remaining unchanged since June quarter 2017 (Figure
12) to sit at $350 per week. The median house rent is $360 per week, whilst the median unit
rent is lower, at $330 per week. Rents have been stable for some time now, but if the vacancy
rate continues to decline, there will be upward pressure on rents. Indeed, some suburbs,
mainly in inner city areas, are already experiencing rental growth.
Figure 12
4.3 Lot supply
Figure 13 shows listings for established lots by REIWA members to August 2019. Lot listings
in Perth stood at 2,927 at the end of August 2019. This is 4% lower than a year ago. Listings
in the rest of WA fell by 13% over the year to be 2,316 at the end of August 2019. Lot listings
in regional WA have fallen considerably since the end of the mining construction boom. See
Appendix A – Regional spotlight for further information on regional markets.
Figure 13
154.4 Lot development trends
Final lot approvals remain lower than in previous years but have increased in recent quarters
(Figure 14). It remains to be seen whether this is a sustained increase. There were 2,552 final
lot approvals in WA in the June quarter of 2019, 2,311 of which were in Greater Perth. Lot
approvals include green title and survey-strata subdivision approvals and can be considered
a leading indicator for single residential (rather than multi-unit) construction.
Figure 14
Data provided by the Water Corporation to the Department of Planning, Lands and Heritage
indicates that overall lot development continues to fall. As at June 2019, there were 5,340
residential lots where the developer had a servicing agreement with the Water Corporation.6
This represents a reduction in activity from June 2018, when there were agreements in place
to service 7,489 new residential lots.
Servicing agreements are considered a proxy for lots under construction and likely to be
available within a few months. Of the total, 4,615 were located in the Greater Perth area and
725 in the rest of WA.
A survey of WA’s major land developers7 by UDIA WA showed that, as at the June quarter
2019, developers had 2,808 lots under construction in the Greater Perth region for release
within the next year. This is up 1.5% on the previous year. Lot production has been relatively
low and stable for the past 18 months, compared with higher production rates between 2013
and 2015. Members noted that there was sufficient capacity to respond to a short-term upturn
in demand, but that in the longer term, land availability could be an issue if demand rebounds
sharply.
6 Urban Development Program, unpublished data.
7 Urban Development Index, June quarter 2019, UDIA WA.
164.5 Residential demolitions
The Department of Planning, Lands and Heritage collects data on dwelling demolitions from
the 32 local government authorities in the Perth, Peel and Greater Bunbury regions
(Table 1). The number of demolitions in 2018-19 increased slightly compared to the previous
year. Demolitions are considered a lead indicator for infill development, so the increase in
2018-19 is a positive sign.
Table 1
Residential demolitions by region
Perth Peel Greater Total
Bunbury
2002-03 2,067 88 44 2,199
2003-04 2,191 96 21 2,308
2004-05 1,934 110 70 2,114
2005-06 2,208 118 95 2,421
2006-07 2,311 145 77 2,533
2007-08 2,515 98 57 2,670
2008-09 1,796 59 60 1,915
2009-10 2,264 86 49 2,399
2010-11 2,383 72 47 2,502
2011-12 1,874 62 47 1,983
2012-13 2,061 85 33 2,179
2013-14 2,493 63 46 2,602
2014-15 2,405 71 33 2,509
2015-16 1,795 80 168 2,043
2016-17 1,880 61 42 1,983
2017-18 1,854 18 28 1,900
2018-19 2,047 55 37 2,139
Source: Department of Planning, Lands and Heritage WA
174.6 Building approvals
Building approvals fell by 14.6% in 2018-19 to 15,726, down from 18,423 in 2017-18. In trend
terms, building approvals peaked in 2014 (Figure 15). Approvals are a lead indicator of
dwelling supply, with falls in approvals feeding through to commencement figures. It currently
takes an average of six weeks for construction to commence once approval has been granted.
Figure 15
Multi-residential approvals made up 22% of all approvals in 2018-19, in line with the decade
average. There was a large variance in monthly figures (Figure 16). Multi-residential dwellings
remain a relatively low proportion of stock in WA at 20%, compared to 32% in NSW and 26%
in Victoria.8 The strength of the multi-residential sector is important to overall levels of dwelling
commencements and will play a big part in determining activity over the forecast horizon.
Figure 16
8 ABS Census 2016.
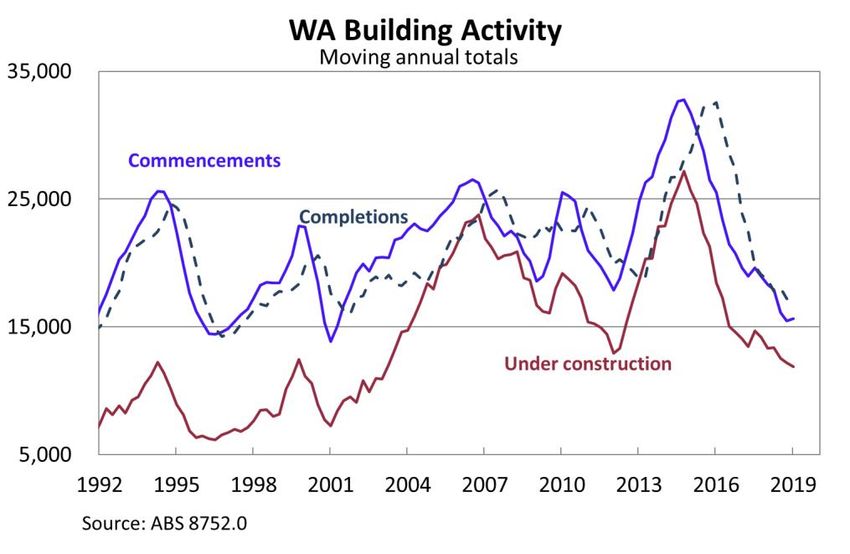
184.7 Dwelling commencements, completions and work in progress
4.7.1 Dwelling commencements
In 2018-19, dwelling commencements in WA fell by 14% to 15,608 in seasonally-adjusted
terms (15,634 in original terms). This was in line with HIFG’s most recent forecast of 15,500
for the year. Private sector house commencements fell by 11%, while private sector
multi-residential commencements fell by 25% (Figure 17). Figure 18 shows the number of
dwelling commencements per 1,000 persons has reached a 30-year low. This is the longest
downturn in dwelling commencements since records began.
Figure 17
Figure 18
194.7.2 Completions
Completions fell by 10% to 16,867 in 2018-19. It takes an average of seven months for new
houses to be completed.9 Completions are likely to continue to decline in coming quarters, in
line with commencements (Figure 19).
Figure 19
4.7.3 Residential construction work in the pipeline
The percentage of multi-residential construction remains high at 45% in the June quarter and
has remained above 40% for the past two years (Figure 20). The multi-residential component
is generally higher than the overall level of approvals and commencements, due to the longer
construction times for this type of building.
9 ABS 8752.0.
20Figure 20
As at the June quarter 2019, there were 2,075 dwelling approvals not yet commenced
(Figure 21), 8% lower than the corresponding quarter in the previous year. Multi-residential
approvals made up 52% of dwellings not yet commenced in the quarter, higher than the
decade average of 43%.
Figure 21
21Figure 22 shows the distribution of dwelling commencements between Greater Perth and
regional WA for the past six years. Detached houses in Perth remain the dominant proportion
of commencements throughout the time period. “Other” residential dwellings in Perth have
increased in importance, despite moderating in recent years. Regional houses have declined
over the years, and regional “other” residential has fallen to a very small percentage of overall
commencements in WA. Development of “other” residential dwellings tends to be more volatile
than the development of houses. Figure 23 shows how the number of commencements has
declined significantly from the peak of 2014-15 while maintaining the overall distribution across
locations and dwelling types.
Figure 22
225 Other factors
5.1 Housing affordability
5.1.1 Home ownership
Housing affordability in WA remains challenging, despite the softening in prices over the past
few years. Western Australians on low incomes remain locked out of home ownership unless
they are receiving external help, for example parental loans. A household on a very low income
in Perth (less than 50% of the median income, or around $44,000) would be able to afford a
dwelling priced around $225,000, if they were to spend only 30% of their income on
repayments (the standard measure of housing stress). This also assumes that the household
is able to save a 10% deposit, which would likely be extremely difficult for a low income
household, especially while renting in the private market. This is well below the lower quartile
house price of $375,000. Conditions are also difficult for those on moderate incomes.10 A
household on 80% of the Perth median (roughly $70,000) could afford a house of
approximately $355,000; well below the median house price of $485,000.
Comparing median local household incomes to median house prices, most regional areas are
now more affordable than Perth (Table 2), with the exception of the South West centres of
Busselton and Albany. Significant falls in house prices in the North West centres of Karratha
and Port Hedland have considerably improved affordability.
Table 2
House Price to Income Ratio June 2019
Region House Price to
Income ratio11
Greater Perth 5.4
Busselton 7.7
Albany 6.4
Esperance 4.4
Geraldton 4.5
Bunbury 4.8
Broome 4.3
Kalgoorlie 2.6
Karratha 2.4
Port Hedland 1.3
5.1.2 Rental affordability
Affordability has improved for those on moderate incomes in the private rental market, but for
those on very low incomes, conditions have not changed. A very low income household
(earning around $44,000), paying around 30% of income on rent, could afford only $250 per
week in the private rental market. This is well below the lower quartile rental price of $300. In
contrast, a household earning $70,000 could afford rent of $400 per week, above the median
rent of $350.
10 The Department of Communities considers a very low income household to be one earning less than
50% of the median income. A low income household earns 50-80% of the median income and a
moderate income household earns 80-120% of the median income.
11 Median household incomes from ABS Census 2016 indexed to June 2019 using ABS Wage Price
Index. Median house prices from REIWA year to June quarter 2019.
236 Regional Housing Markets
Regional areas have experienced varying conditions over recent years. Falls in population
have significantly dampened demand for dwellings and building activity. Areas exposed to the
mining sector, particularly the Pilbara and Mid-West, have experienced the most volatile
movements, while the South West has seen more steady conditions.
6.1 Regional established market
Table 3 shows that median house prices have fallen in most regional areas over the past
year. Many regional centres have seen significant falls over the past five to ten years.
Table 3
House prices in Perth and major regional centres. 12 months to June 2019.
Region Lower Median Upper Median
Quartile Quartile Annual
Change
Greater Perth $375,000 $485,000 $685,000 -3.4%
Rest of WA $215,000 $320,000 $425,000 -1.5%
Albany Urban Area $306,750 $385,000 $480,000 1.3%
Broome Urban Area $391,000 $450,000 $546,250 -7.5%
Bunbury Greater $285,000 $345,000 $425,000 -1.4%
Busselton Urban Area $394,500 $500,000 $665,000 -2.0%
Esperance Urban Area $257,500 $320,000 $407,500 -8.6%
Geraldton/Greenough $160,750 $260,000 $365,000 -11.2%
Kalgoorlie/Boulder $215,000 $300,000 $370,000 -3.2%
Karratha Urban Area $292,000 $346,750 $425,000 10.6%
Port Hedland $160,000 $225,000 $346,250 2.3%
Source: REIWA/Landgate
246.2 Regional rental markets
Data for regional centres for the June 2019 quarter (Table 4) shows overall median rents.
Median rents have stabilised or risen in most regional centres, a similar pattern to Greater
Perth. Broome has the most expensive rental market in the state.
Table 4
Private sector rents in Perth and major regional centres. Year to August 2019.
Region House Unit Median
median median Dwelling Annual
weekly weekly median Change
rent rent weekly rent
Greater Perth $360 $330 $350 0.0%
Regional WA $350 $300 $340 3.0%
Albany Urban Area $350 $290 $340 -1.4%
Broome Urban Area $550 $360 $468 3.9%
Bunbury Greater $335 $295 $320 0.0%
Busselton Urban Area $400 $360 $390 0.0%
Esperance Urban Area $320 $250 $300 0.0%
Geraldton-Greenough $290 $190 $270 0.0%
Kalgoorlie-Boulder $350 $280 $330 0.0%
Karratha Urban Area $450 $325 $425 6.3%
Port Hedland $400 $300 $350 0.0%
Source: REIWA
256.3 New dwellings
Most regional areas have seen sharp declines in the building of new dwellings in recent years.
Figure 23 shows rates of building approvals per 1,000 persons over a ten-year period,
compared with the more recent period of 2016 to 2018. While the trend of lower activity is in
line with conditions in Greater Perth, in most regional areas the slowdown has been even more
dramatic. This is particularly evident in the mining-exposed areas of the Kimberley and Pilbara.
These patterns highlight clear risks going forward. A sustained period of low dwelling supply
leaves housing markets very vulnerable if population growth were to pick up quickly. Prices
would rise rapidly, as regional markets take time to respond to supply challenges.
Figure 23
Appendix A provides summary annual data for each regional area, including new lots created,
building approvals and changes in population. Charts on median house prices and rents are
also provided for major urban centres in the regions to give more detail on established market
conditions.
267 Housing industry resources and challenges
7.1 Construction costs, building materials and labour supply
The Perth new home price index increased by 0.8% in the year to June 2019, the first increase
in over three years. In contrast, the Perth consumer price index increased by 1.6% in the same
period.12 The price of building materials used in housing construction increased by 0.9% over
the last year, below the 1.8% increase observed across the major capital cities.13 The Housing
Industry Association (HIA) Trade Availability Index shows that trade workers remain in
oversupply both in Perth and regional areas.14
7.2 Industry issues and short-term challenges
• HIFG members remain concerned about the ability of buyers to obtain finance. Bank
valuations for new purchase contracts of homes are coming in lower than expected
and constraining buyers’ ability to obtain finance.
• Some industry members expressed concern about the cumulative impact of recent
and upcoming regulatory, planning and policy changes impacting the industry. This
includes upcoming changes to the National Construction Code (due to come into full
effect in 2020), and the potential introduction of industrial manslaughter laws in new
workplace health and safety legislation. The volume of changes is difficult for the
industry to deal with, particularly smaller businesses.
• Some industry members noted that the introduction of the Foreign Buyers Duty
Surcharge has significantly dampened foreign investor demand, making it more
difficult to obtain pre-sales for multi-residential development.
• A lack of employment opportunities is leading workers to leave the residential
construction industry, and few new apprentices are being trained. This could result in
skill shortages in future years which will be difficult to address in a timely manner,
with potential impacts on supply and affordability.
• Some industry members noted that stamp duty is a significant constraint on home
purchasers, particularly those looking to downsize. Industry members also noted the
imbalance between stamp duty on new multi-residential construction compared to
land and house packages. This is an impediment to demand for higher density
dwellings.
• The recent announcement by the State Government around stamp duty relief for
buyers of multi-tiered developments, including foreign buyers, is welcomed by the
Group as it has the potential to stimulate new dwelling commencements, which are at
their lowest levels for 30 years. The reform has the potential to impact on the Group’s
forecast moving forward.
12 ABS 6401, Table 10.
13 ABS 6427, Table 18.
14 HIA Trades Report June 2019.
278 Forecasts
8.1 HIFG’s forecast of dwelling commencements
Financial Year Dwelling Commencements
2018-19 (actual) 15,608 (15,500 forecast)
2019-20 (forecast) 15,500
2020-21 (forecast) 15,500-17,000
2021-22 (forecast) 16,000-18,000
HIFG members expect dwelling commencements to remain flat over the coming year, with a
forecast of 15,500 new dwelling commencements in WA. This is a downward revision on the
previous forecast of 17,000, due to lower than expected building approvals and finance
commitments. A modest improvement is forecast for 2020-21 and 2021-22, driven by
expectations of moderate improvements in population growth and general economic
conditions.
Conditions have been softer than expected over the previous year, due to a combination of
low population growth and subdued conditions in the established market where there are high
levels of stock. Rental activity has been stable and pressure on rents has been limited, despite
a falling vacancy rate. The implications from the Royal Commission into Misconduct in the
Banking, Superannuation and Financial Services Industry have tightened access to finance,
but the underlying issue in WA appears to be a lack of demand. Reductions in interest rates
have not improved demand for housing, although these have had some benefit through
improvements in serviceability to secure housing finance.
With activity in 2019-20 expected to be very similar to 2018-19, HIFG forecasts a subdued
recovery to between 15,500-17,000 in 2020-21 and 16,000-18,000 in 2021-22. This is based
on WA Treasury expectations of increases in population growth and improved economic
activity, that may reduce the current high levels of stock in the established market and support
demand for new dwelling construction in the out-years.
These forecasts are subject to both upside and downside risks. Downside risks to the forecast
predominantly relate to the WA economy not recovering as expected, bringing with it continued
subdued employment conditions and population growth. These conditions could be brought
about through softening national global growth and the impact of continued trade tensions
between the United States and China. Further reductions to interest rates are unlikely to have
a significant impact on the outlook.
Upside risks include the WA economy recovering more quickly than anticipated. Further
upsides to the housing outlook could come through any additional stimulus (either general or
direct to the housing sector) from either the State or Federal Governments. Any economic
stimulus, or targeted measures towards the new home sector (such as an increase in social
housing construction), would likely improve the outlook for dwelling commencements.
Recent changes announced by the State Government around stamp duty rebates on new
apartments and the reintroduction of regional centre status may have a positive impact on
dwelling commencements moving forward. Our April 2020 update will review early evidence
of the impact of these changes on commencements, and forecasts will be reviewed as
necessary.
28Multi-residential dwelling construction remains key to the recovery in dwelling
commencements, particularly with State Government infill targets and METRONET-related
development. The Group continues to note that although consumer preferences from some
demographic groups are slowly shifting from detached dwellings to multi-residential, it will take
some time for this to translate to strong overall consumer demand for multi-residential living.
Figure 24
Figure 25
298.2 Assessment of serviced residential lot supply
On the basis of 1.3 dwellings per lot,15 our forecast suggests that there will be a need for
around 12,000 residential lots in 2018-19, and up to 14,000 in the outer years of our forecast
horizon. Demolitions are likely to provide between 2,000-3,000 lots per annum, resulting in a
need for around 9,000 lots this financial year, to be supplied from new lot developments and
vacant unsold serviced lots. HIFG foresees no difficulty in meeting the predicted need for
serviced residential lots in the forecast horizon. However, the relatively low levels of lot
creation could lead to shortages or delays in the longer term or if demand picks up more
quickly than anticipated.
15The average number of dwellings per building approval over the period 2009-2014 based on ABS
data.
30Appendix A – Regional spotlight
South West
The South West has been the strongest performing regional market in recent years, and one
of the few regional areas that continues to record population growth, although this remains
lower than earlier in the decade. Dwelling approvals have fallen since 2013-14. House prices
have fallen sharply in Bunbury over the last 5 years, while Busselton, more of a tourist location,
has seen flat growth since the first quarter of 2015. Rents reflect similar patterns.
31Great Southern
Conditions in the Great Southern region have been more robust, despite a dip in population
in 2015-16. The established market has maintained relatively high levels of activity, and it is
one of the few areas where median rents have not fallen over the past few years. House prices
have been steady, despite a big drop in the number of sales. Dwelling approvals have been
declining slowly since 2014-15, while lot approvals have followed a similar pattern.
32Goldfields-Esperance
The Goldfields-Esperance region was heavily impacted by the reduction in mining activity in
the middle of the decade and has had negative population growth in recent years. In line with
this, conditions in the established market have softened, particularly in Kalgoorlie-Boulder.
Dwelling approvals and lot creation have been steady for the last few years, but well down on
the activity of the end of the last decade. Prices and rents have been very stable in Esperance.
33Wheatbelt
The Wheatbelt region has experienced volatile levels of population growth over the past two
decades. Building activity has been steady since 2011-12 but well down on the period 2002-
03 to 2010-11.
Mid-West
The Mid-West region experienced high population growth and building activity in the
early-to-mid 2000s, which has now softened with very few lots being created. Established
house prices and median rents have also fallen.
34Gascoyne
Building activity has been soft in the Gascoyne region for some time, in line with low or
negative levels of population growth. There was only one period of significant activity, 2006-
07 to 2011-12. Those days now seem long gone.
Pilbara
The Pilbara region has experienced extremely volatile levels of population growth, building
activity and price, which have generally moved in line with mining construction activity. After
many years of falls, there are signs population growth is returning. Worryingly, there has been
very little development activity since 2015. If population growth were to reach the levels of
2010, the market would need to respond quickly to avoid the type of price rises seen between
2006 and 2011. Sales activity has been strong over the last three years and prices have
started to rise, making it even more worrying there has been little new development in the last
four years. Patterns are similar in Port Hedland.
3536
Kimberley
     The Kimberley region has experienced falls in population growth and building activity post the
     mining construction boom. The established market in Broome has been more stable, likely
     due to the tourism industry in the area. Again, there has been very little development activity
     in the last four years.

37
Appendix B – Housing Industry Forecasting Group
The Housing Industry Forecasting Group (HIFG) is a joint industry and government body
re-established in February 2008 to provide independent commentary on the housing sector in
WA. The Department of Planning, Lands and Heritage and the Department of Communities
jointly provide the HIFG secretariat and research functions.
Membership of HIFG is drawn from major organisations associated with the housing and land
development industry in WA and from government. Through its diverse membership, HIFG
has access to considerable expertise and knowledge of the sector, including land
development, real estate, the private rental market, social housing, building statistics,
demographics, building resources and home finance.
HIFG Members – as at October 2019
Member Organisation represented
Steven Rowley (Chair) AHURI - Curtin Research Centre
Alan Langford Bankwest
Daniel Norrie Chamber of Commerce and Industry WA
Adrian Warner Department of Communities
John Chortis Department of Planning, Lands and Heritage
Jonathan Palmer Department of Treasury
Cath Hart Housing Industry Association
James Butterfield LandCorp
Julie-Ann Sugar Landgate
Jason Robertson Master Builders Association
Michael Britton Property Council
Dillon Kanbi Real Estate Institute of WA
Chris Green Urban Development Institute of Australia (WA)
Brett Coombes Water Corporation
Observers
Zaneta Georgievski Australian Bureau of Statistics
James Yuen Housing Advisory Unit, Department of
Communities/Department of Planning, Lands
and Heritage
Secretariat
Cassandra Winzar Department of Communities
3840
You can also read


