Brunei Darussalam Household Energy Consumption Survey
←
→
Page content transcription
If your browser does not render page correctly, please read the page content below
Chapter         1
Brunei Darussalam Household Energy
Consumption Survey

June 2020

This chapter should be cited as
ERIA and BNERI (2020), ‘Brunei Darussalam Household Energy Consumption Survey’, in ERIA
and BNERI, Brunei Darussalam Energy Consumption Survey: Residential and Commercial and
Public Sectors. ERIA Research Project Report FY2019 no.03, Jakarta: ERIA, pp.1-25.
Chapter 1
        Brunei Darussalam Household Energy Consumption Survey

1.       Objectives

The Brunei Darussalam Household Energy Consumption Survey (BDHECS), completed in
December 2015, was the first comprehensive energy consumption survey in the country.
Before 2015, data on energy consumption by end use were limited and residential
electricity consumption was not broken down by end-use. Data on energy consumption,
type of appliances, and their shares of energy use, as well as other data indispensable to
implementing energy efficiency measures, were limited. Scenarios of energy use, energy
consumption, and trending in energy demand must be understood. We, therefore,
conducted the first comprehensive nation-wide household energy consumption survey,
from April to December 2015.
The primary goal of BDHECS was to obtain comprehensive and reliable data that could be
used to analyse end-use residential energy consumption, preferences, and trending of
energy use. The survey results would be used to formulate and implement policies and
programmes to improve sustainability through prudent and efficient use of electricity.
Specifically, the survey was designed to accomplish the following:
(i)      Determine the energy consumption profile for household and private transportation.
(ii)     Establish the current efficiencies of household appliances and private vehicles.
(iii)    Establish baseline end-use consumption data for energy efficiency policy analysis and
           future trends in energy consumption.
(iv)     Improve the efficient use of residential energy.
(v)      Establish national energy indicators such as, but not limited to, the following:
           (a)      energy use intensity (EUI) (kWh/household/year),
           (b)      end-use energy consumption per household by district,
           (c)      percentage share of electricity use by appliance and establishment of
                    priorities for MEPS for appliances,
           (d)      average age of major appliances,
           (e)      travel distance and fuel consumption, and
           (f)      fuel economy by vehicle type.
The survey was the result of international cooperation. The Economic Research Institute for
ASEAN and East Asia (ERIA) and the Institute of Energy Economics, Japan assisted with the
technical aspects, including development of the survey questionnaire, its implementation,
validation, and data analysis.
The Brunei National Energy Research Institute (BNERI) managed and implemented the
survey, and coordinated with various higher education institutes to conduct interviews. The

                                               1
Ministry of Energy of Brunei Darussalam (ME) guided and facilitated the overall survey
implementation.
This report provides useful information for agencies formulating and implementing energy
efficiency and conservation (EEC) policies.
2. Energy Situation in 2015
Crude oil and natural gas were the main energy resources in Brunei Darussalam. In 2015,
total primary energy was met mainly by natural gas (84%); oil’s share remained at 16%.
Total primary energy supply declined by 3% in 2014–2015, from 4,154 kilotons of oil
equivalent (ktoe) to 4,034 ktoe.
Domestic needs are modest because the population is small. Consequently, most natural
gas and crude oil produced in the country are exported. Only a small percentage of natural
gas is allocated for domestic power generation and downstream petrochemical industries.
About 12% of the crude oil produced is refined to manufacture petroleum products to meet
domestic demand, whilst the rest is exported.
Brunei Darussalam’s final energy consumption amounted to 928 ktoe in 2015, a slight
decline of 0.1% from the previous year. Transport led total energy demand, with 456 ktoe
or 49% of the overall amount (Figure 1). Other sectors (residential, commercial and public
service, others) accounted for 34% of total final energy demand, and industry for 16%.
Figure 1.1: Final Energy Consumption by Sector, 2010–2015
18 28 6
122 124 126 129 158
156
157 163 158 155
152 155
ktoe
396 432 452 447 456 456
146 169 187 156 137 153
2010 2011 2012 2013 2014 2015
Industry Transport Residential Commerce and public service Others
Source: Author (2019).
2In 2015, total installed power generation capacity of public utilities and autoproducers2
reached 922 MW. Most of the electricity was generated by natural gas (4,666 GWh).
Electricity grew steadily by about 11% over the previous 5 years, reaching 401 ktoe in 2015
(Figure 2).
Figure 1.2: Total Electricity Generation, 2010–2015
410
401
400
388
390
379
380 375
ktoe
370
362
360 356
350
340
330
2010 2011 2012 2013 2014 2015
Source: Author (2019).
The residential sector was consistently the second-highest consumer of electricity since
2010, taking up 40% (118 ktoe) of total consumption in 2015. The commercial and public
sector accounted for 53% (158 ktoe) and the industrial sector for 7% (17 ktoe) (Figure 3).
Residential energy consumption was mainly of electricity (118 ktoe), whilst the rest was of
natural gas (19 ktoe) and petroleum (18 ktoe) (Figure 4).
2
Autoproducers generate electricity and/or heat, wholly or partly for their own use as an activity
that supports their primary activity.
3Figure 1.3: Final Electricity Consumption by Sector, 2010–2015
350
300
250
156 158
200 122 124 126 129
ktoe
150
100
115 119 115 115 115 118
50
0 21 19 21 20 17 17
2010 2011 2012 2013 2014 2015
Industry Residential Commerce and public service
Source: Author (2019).
Figure 1.4: Residential Energy Consumption by Fuel Type
140
118
120
100
80
ktoe
60
40
18 19
20
0
Petroleum Natural gas Electricity
Source: Author (2019).
3. Survey Overview
3.1. Electricity Consumers in the Brunei Darussalam Household Energy Consumption
Survey
The survey covered dwellings occupied as a primary residence. For random sampling
purposes, an address list, obtained from the Department of Electrical Services (DES) and
comprising households subscribed to DES Prepaid Electricity was used. The full list
contained 67,306 addresses, according to DES’s Prepaid Accounts in March 2015.
43.2. Household Energy Use Survey Method
The BDHECS was based on random (probability) sampling. The survey was conducted with
randomly selected households in four districts: Brunei-Muara, Belait, Tutong, and
Temburong (Table 1.1). Data was collected using the questionnaire, which was designed to
capture data to understand actual scenarios of energy use, with breakdowns of
consumption by appliance. Trained interviewers, mainly ME officers, conducted face-to-
face interviews, and ME interns recorded the data. The hardcopy questionnaire had pre-
encoded data for certain standardised items to facilitate the interpretation of data.
Interviewers were given a guidebook as a reference on common household appliances and
familiarised with the various types and the type of data expected to be extracted from
appliance nameplates.
One household member, usually the one responsible for the household, answered on
behalf of the whole household. Several households living in the same housing unit were
considered one household if electricity was not billed separately.
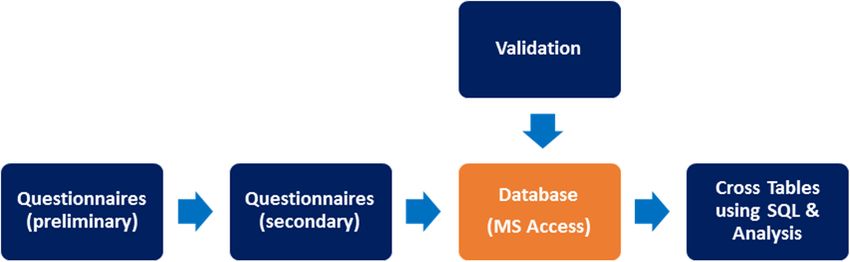
Questionnaire data was processed (Figure 5). Both preliminary and secondary
questionnaires were gathered in a database (Microsoft Access) for validation. After
validation, cross tables were produced using Structured Query Language (SQL) and
analysed.
Potential savings were expected to be derived using information about household energy
consumption and conservation and the pattern of electricity consumption of household
appliances and equipment.
Figure 1.5: Data Process Flow
Source: Author (2019).
54. Survey Results
4.1. Response Rate
Based on the survey information, sample units were divided into three groups:
respondents, non-respondents, and ineligible units or rejected samples. The initial quality
indicator, i.e. the response rate, was found by considering the groups’ sizes.
The survey sample target was set at 1,000 respondents. Of the 1,000 survey samples
conducted, 608 responded, 15 of which were rejected, resulting in 593 validated samples.
Measurement and processing errors were deemed one reason for the rejected samples.
Difficulties in conducting the survey included reluctance to provide certain personal
information because of privacy concerns and respondents’ lack of knowledge about
household appliances and technical information.
The number of validated samples were distributed as follows: about 55% in Brunei-Muara;
22% in Belait, the second-most populated district; 17% in Tutong; and 6% in Temburong,
the least-populated district (Table 1.1).
The validated survey samples represented 1% sample coverage of the number of
households based on DES Prepaid Account as of March 2015. Whilst the sample coverage
was small, it was significant for observing household energy consumption patterns.
6Table 1.1: Number of Validated Survey Samples by District
Districts Number of Validated Survey Samples
Brunei Muara 324
Belait 132
Tutong 100
Temburong 37
Source: Author (2019).
4.2. Survey Items
The survey was divided into 11 categories (Table 1.2). The first part consisted of general
background information on the household, household characteristics, and energy
consumption and bills. Parts two to nine included selected home appliances and electronics
that are common to an average household. Part 10 consisted of fuels other than those used
for private transportation, i.e. natural gas, LPG, and others. Part 11 contained consumption
profiles for private transportation.
Table 1.2: Brunei Darussalam Household Energy Consumption Survey Items
Districts Number of Validated Survey Samples
Part 1:
Identification of Household Number of primary household members, monthly
household income, household-based income-generating
activity
Household Characteristics Gross floor area, number of rooms
Energy Consumption and Approximate spending for electricity per month (prepaid or
Energy Bills post-paid), frequency of outages in a month, average
duration of outages in a month
Part 2: Type of air conditioner, number of years in use,
Home Appliance: Air manufacturer or brand, model, cooling capacity, power
Conditioner rating (watts), hours of daily usage, location of unit
Part 3: Type of fan, number of years in use, manufacturer or
Home Appliance: Fan brand, model, power rating, hours of daily usage
Part 4: Type of lamp, number of units, average hours of daily
Home Appliance: Lighting usage, average power rating (watts)
Part 5: Type of refrigerator and/or freezer, number of years in use,
Home Appliance: Refrigerator manufacturer or brand, model, rated current (amps),
power rating (watts), volume of capacity, unit
Part 6: Type of electrical water heater, number of units, number of
Home Appliance: Water years in use, manufacturer or brand, model, size for boiler,
Heater power rating (watts), hours of daily usage, average usage
days per week
Part 7: Type of washing machine and/or dryer, number of units,
7Home Appliance: Washing number of years in use, capacity (kg), manufacturer or
Machine brand, model, power rating (watts), frequency of usage per
day, number of days per week the equipment is used for
washing and/or drying
Part 8: Electronic: TV Type of TV, number of years in use, manufacturer or brand,
model, size, power rating (watts), hours of daily usage,
Part 9: Type of rice cooker, number of years in use, manufacturer
Home Appliance: Rice Cooker or brand, model, power rating (watts), frequency of
cooking per day
Part 10: Type of fuel, use of fuel, consumption of fuel per month
Other Fuels
Part 11: Number of motor vehicles owned, type of vehicle, year of
Private Transportation registration, engine capacity, type of fuel, average distance
travel per weekday, average distance travel per weekend,
average distance travel per week (km), average fuel
expenses per week (Brunei dollar [BND])
Source: Author (2019).
4.3. Basic Characteristics of Households
Households had an average of five people. About 34% of households had 1–5 members,
54% 6–10, and 12% more than 10. Most households lived in detached houses, most (93%)
owned motor cars, and the rest owned station wagons (3%), window vans (2%), and
scooters (2%) (Figure 6). On average, every household owned about three cars.
Figure 1.6: Share of Vehicle Type
2%
3% 2%
Motor car
Station wagon
Window van
Scooter
93%
Source: Author (2019).
Dual wage-earning families were not uncommon and work from home was not unusual
(some people ran their business from home whilst doing housework and rearing children).
8The distribution of households by income varied, with about 80% earning BND1,000–
BND10,000 (equivalent to US$742.75–US$7,427.52) monthly and the largest proportion
(20%) earning BND2,000–BND2,999 (equivalent to US$1,485.60–US$2,227.51) monthly.
Brunei Muara had the highest earning capacity.
Unlike the results of the Department of Economic Planning and Development (JPKE)
Household Expenditure Survey, on the number of households by income level in 2015
(Figure 7), the BDHECS results include income bias, which shows that the proportion of
lower-income households was higher by 6.7% and the proportion of higher-income
households lower by 3.2%. Consequently, the BDHECS results on energy consumption were
expected to be underestimated because the energy consumption survey greatly
concentrated on households with low incomes.
As shown in Figure 8, high-income households (BND10,000 and over) had higher shares of
electricity demand for air conditioning and water heating than low-income households (less
than BND1,000). In contrast, shares of electricity demand for refrigerators and fans were
higher amongst low-income than in high-income households.
Figure 1.7: Comparison of Survey Results and National Statistics on
Number of Households by Income Level
20%
18%
16%
14%
12%
10%
8%
6%
4%
2%
0%
10,000 & over
Less than 1,000
4,000–4999
1,000–1,999
2,000–2,999
3,000–3,999
5,000–5,999
6,000–6,999
7,000–7,999
8,000–8,999
9,000–9,999
BDHECS JPKE
BDHECS = Brunei Darussalam Household Energy Consumption Survey, JPKE = Department of Economic Planning
and Development.
Source: Author (2019).
9Figure 1.8: Comparison of Lowest-Income and Highest-Income Household Shares of
Appliances
100,0%
90,0% 3,8% 4,6%
8,8% 8,4%
80,0%
13,0%
70,0% 22,1% 1,4%
60,0%
4,4%
50,0%
40,0%
67,3%
30,0%
53,7%
20,0%
10,0%
0,0%
Lowest Income Highest Income
Air conditioning Fan Refrigeration Lighting
Water heating Laundry Recreation Cooking
Source: Author (2019).
As for transportation (Figure 9), Land Transport Department statistics show that the
number of vehicles (motor cars only, excluding government and commercial vehicles) was
higher than that in BDHECS by 6.3%, which suggests the need for further investigation to
verify this discrepancy.
Figure 1.9: Comparison of Survey Results and National Statistics on Number of Vehicles
285.000 283.132
280.000
275.000
Number of Vehicles
270.000
265.344
265.000
260.000
255.000
LTD (2014) BDHECS (2015)
BDHECS = Brunei Darussalam Household Energy Consumption Survey, LTD = Land Transport Department.
Source: Author (2019).
104.4. Energy Use by Households
The analysis of energy and fuel types consumed (by number of households) indicated that
electricity represented about 76% of total residential sector demand. Total consumption of
electricity per household was about 15,785 kWh per year (or 1,315 kWh per month per
household), which made it the highest amongst Association of Southeast Asian Nations
(ASEAN) members (Figure 11 and Figure 12). Brunei-Muara recorded the highest average
consumption at about 18,019 kWh per year (or 1,502 kWh per month per household),
followed by Tutong at 14,067 kWh per year (or 1,172 kWh per month per household),
Temburong at 13,288 kWh per year (or 1,107 kWh per month per household), and Belait
with 12,303 kWh per year (or 1,025 kWh per month per household).
APEC Energy Statistics shows that electricity consumption was 23% higher than the BDHECS
results. Table 1.3 shows that projected national electricity consumption was about 21.8%
higher than national energy statistics. Electricity consumption derived from this survey
seems to have been underestimated. This validation check suggests that (i) the survey
results might have been influenced by the sampling concentration on low-income
households, and (ii) the sample size and spread of households in the survey might have
been insufficient to establish greater accuracy of the survey data. Nevertheless, the
survey’s analyses and trending should be useful for formulating plans to improve energy
efficiency.
Table 1.3: Comparison Between Projected National Residential Electricity Consumption
and National Energy Statistics
Data Derived from National Energy
Remarks
BDHECS Statistics
No. of households in
─ 67,966 National statistics
Brunei Darussalam
National average
Average electricity
electricity
consumption per
15,785 kWh/year ─ consumption per
household from
household derived
BDHECS
from the survey data.
The difference
between the projected
National residential electricity
1,073 GWh/year
electricity 118 ktoe/year consumption based on
(92.25 ktoe/year)
consumption BDHECS and the
national energy
statistics is 21.8%.
BDHECS = Brunei Darussalam Household Energy Consumption Survey.
Source: Author (2019).
11As to the extent of electricity usage by appliance, Figure 10 shows the appliances commonly
used, such as air conditioners, refrigerators, indoor lighting, laundry, and recreational
appliances. Nearly all energy demand was met by electricity, except for cooking (90% from
electricity and 10% from LPG) and water heating (50% from electricity and 50% from other
energy sources).
Figure 1.10: Share of Appliances Utilising Electricity (%)
120
97,3 96,3 99,8 100 99 98,1
100 92,6 90,1
80
60 48,9
%
46
40
20
0 Water heating
Refrigerator
Lighting – Outdoor
Laundry
Cooking
Lighting – Indoor
Air conditioning
Recreation
Other activities
Space cooling
Source: Author (2019).
LPG provided 11% of residential demand for cooking and water heating. The national
average consumption of LPG per household was 0.23 m3. Belait recorded the highest
average consumption of LPG per household at 0.3039 m3, followed by Tutong at 0.2119 m3,
Brunei-Muara at 0.2109 m3, and Temburong at 0.1867 m3. The survey showed that total
household LPG consumption in 2015 reached 121.30 m3.
Of residential energy demand, 13% was met by natural gas, which was consumed only in
Belait, for cooking, water heating, and electricity generation. Since natural gas consumption
in Belait was fixed at BND5.00 per month per household, total natural gas consumption
could not be calculated for the purpose of this survey. The households’ data on
consumption of fuels based on the survey results are in Table 1.4, covering energy
consumption in all households, excluding energy utilised for domestic business activities.
12Table 1.4: Number of Households Using Other Fuels, Percentage Share of Households
Using Other Fuels, and Household Consumption by Type of Fuel by District
Other Fuels No. of Total Share Average
Households Consumption (%) Consumption
(m3) per Household
(m3)
Brunei Darussalam 584 121.30
Natural Gas 43 NA*
Liquefied Petroleum 540 121.30 100% 0.2246
Gas
Others 1 0%
Brunei-Muara 317 66.86
Natural Gas NA
Liquefied Petroleum 317 66.86 55% 0.2109
Gas
Others 0%
Belait 132 26.74
Natural Gas 43 NA*
Liquefied Petroleum 88 26.74 22% 0.3039
Gas
Others 1 0%
Tutong 99 20.98
Natural Gas NA
Liquefied Petroleum 99 20.98 17% 0.2119
Gas
Others 0%
Temburong 37 6.72
Natural Gas NA
Liquefied Petroleum 36 6.72 6% 0.1867
Gas
Others 317 66.86
Source: Author (2019).
13Figure 1.11: Average Yearly Electricity Consumption per Household by District,
and National Average
20.000
18.019
18.000
15.785
16.000
14.067
14.000 13.288
12.303
kWh per year
12.000
10.000
8.000
6.000
4.000
2.000
0
Brunei Brunei Muara Belait Tutong Temburong
Darussalam
Source: Author (2019).
Figure 11 shows average yearly electricity consumption per household for the four districts;
the national average was 15,785 kWh per year. Brunei Muara recorded the highest at
18,019 kWh per year. Surprisingly, sparsely populated and remote Temburong recorded
fairly high electricity consumption at 13,288 kWh per year, which was almost as much as in
urban districts.
Figure 12 shows the average monthly electricity consumption per household for the four
districts; the national average was 1,315 kWh per month. As expected, Brunei Muara
recorded the highest at 1,502 kWh per month and, correspondingly, electricity
consumption for air conditioning was the highest at 923 kWh per month or 61.45% of the
average monthly consumption for the district. Interestingly, monthly electricity
consumption of refrigerators was highest in Temburong at 275 kWh per month. The
average monthly electricity consumption of air conditioners in Temburong was also fairly
high at 646 kWh per month, which was almost as much as in Tutong at 717 kWh per month.
This suggests that there was no distinct difference in electricity consumption between
urban areas and remote areas such as Temburong.
14Figure 1.12: Average Monthly Electricity Consumption per Household and Corresponding
Electricity Consumption of Two Major Appliances
1.600 1.502
1.400 1.315 Average monthly
Average Electricity Consumption
consumption by
1.172
(kWh/household/month)
1.200 1.107 area
1.025 (kWh/month)
1.000 923
804
800 717 Air conditioners
615 646
(kWh/month)
600
400 275
236 248 228
199
200 Refrigerators
(kWh/month)
0
Brunei Brunei Muara Belait Tutong Temburong
Darussalam
Source: Author (2019).
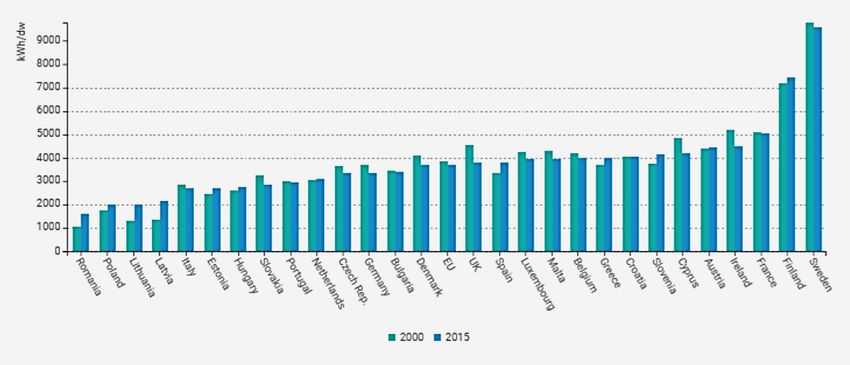
Figure 1.13: Electricity Consumption per Dwelling in European Union Countries
Source: Odysseemure (2015).
The average electricity consumption per household in the European Union (EU) was lower
at around 4,000 kWh per year in 2015, although Finland and Sweden consumed 8,000–
10,000 kWh per year (Figure 1.13). The publication on household energy consumption in
the EU (2015) reported that Norway recorded the highest at 16,000 kWh per year. Based on
the World Energy Council data for Asia in 2014 (Figure 1.14), average electricity
consumption per household in Asia was lower at about 1,800 kWh per year, although
Taiwan recorded the highest average consumption of 6,958 kWh/year. Therefore, the
survey result for Brunei Darussalam of average electricity consumption per household of
15,785 kWh per year is considered high.
15Figure 1.14: Average Electricity Consumption per Household in Asia
8000
6958
Average Electricity Consumption
7000
(kWh/household/year)
6000 5275
4829
5000
4000 3290
3000 2420
2137
1591 1723
2000
1079 1125
1000
0
Source: World Energy Council (2014).
5. Key Findings
5.1. End-Use Energy Consumption Pattern
Electricity consumption has grown over recent years. The survey results show all
households commonly used a large number of electrical appliances, accounting for
significant residential electricity consumption.
Figure 1.15: Share of Electricity Consumption by Appliance
2.5%
1%
6%
3% Air conditioner
3.5%
Fan
3.5% Refrigerator
Lighting – indoor
Lighting – outdoor
59,5% Water heater
18%
Washing machine
TV
Rice cooker
3%
Source: Author (2019).
16Figure 1.12 and Figure 1.15 show the results from the survey of electricity consumption by
household appliance and by district. Generally, the electricity consumption trend by
appliance for all four districts was consistent. In total, air conditioners consumed the largest
proportion of energy, almost 60%. Combined fan and space cooling accounted for 62.5% of
residential electricity consumption.
Refrigerators came in second at about 18%, and lighting (outdoor and indoor) third at 7%.
Water heaters accounted for about 6%.
The combined share of these appliances accounted for almost 94% of end-use electricity
consumption. Priority should be given to them in energy efficiency action plans to target
energy saving. Other appliances that accounted for the rest of electricity consumption were
washing machines, TVs, and rice cookers.
Figure 16 shows the share of electricity consumption of appliances by district compared
with the national average values. The analysis of end-use household energy consumption
patterns provides useful information on the use of energy by common household
appliances. Considering the volume of these appliances in households, any plan to educate
the public and change to more energy-efficient appliances will contribute significantly to
energy savings. One such possible measure is to prioritize energy efficiency labelling of
appliances that have larger shares of residential load demand, which will result in quick
energy savings.
Figure 1.16: Share of Electricity Consumption by Appliance by District
100%
90% 6% 7% 6% 6% 5%
7% 7% 6% 8% 7%
80%
70% 18% 16,5% 19% 19% 25%
60%
50%
40%
30% 59,5% 60,5% 59,5% 57% 54%
20%
10%
0%
National Brunei-Muara Belait Tutong Temburong
Air conditioner Fan Refrigerator Lighting
Water heater Washing machine TV Rice cooker
Source: Author (2019).
175.2. Average Number of Appliances per Household
The survey results show that electricity use was growing primarily because of the increase
in number and usage of household appliances (Figure 17).
Indoor lighting has universal coverage and accounted for the highest number (14) of
appliances per household. Air conditioning was the largest consumer of electricity in the
survey. The findings show that every household had up to four air conditioners on average,
demonstrating that each air conditioner contributed to the largest share of energy
consumption.
Another widely used appliance was the refrigerator; 99.8% of households owned at least
three on average. Each household had at least two TV sets. Since information technology is
developing rapidly, the usage rate of recreational appliances such as TVs, desktop
computers, laptops, amongst others, is growing rapidly. The number of appliances and
electronics is expected to grow as the number of households increases.
Figure 1.17: Average Number of Appliances per Household
16
14
14
12
10
Units
8
6 5
4 4
4 3
2
2 1 1 1 1
0
TV
Refrigerator
Air conditioner
Lighting – outdoor
Washing machine
Lighting – indoor
Fan
Rice cooker
Water heater
Other appliances
Source: Author (2019).
5.3. Age of Critical Household Appliances
Based on appliances’ end-use energy consumption patterns (section 1.5.1), air conditioners
and refrigerators accounted for 77% electricity consumption. This section reviews their
usage in less than 3 years, 3–5 years, 6–10 years, and more than 10 years. The age of a
household appliance can affect its energy efficiency. The survey results show that a
significant number of household appliances were 10 years old or more, which were likely to
be less energy efficient than newer units. A significant number of air conditioners (292 units
constituting almost 14% of the existing stock) and refrigerators (368, almost 21%) were
more than 10 years old (Table 1.4). The number of air conditioners more than 6 years old
18was about half the number of air conditioners 5 years old or under. Similarly, the number of
refrigerators more than 6 years old was almost equal to the number of refrigerators that
are 5 years old or under.
In other words, the proportion of older household refrigerators (the number of those 6
years old or more was almost the same as that of refrigerators 5 years old or less) seemed
to be larger than the proportion of older air conditioners (6 years old or constitute about
half as many as those 5 years old or less). Since the newer refrigerator models use inverter
technology and are more efficient, it makes sense to promote them to replace old
refrigerators, especially because they operate non-stop.
Survey respondents were asked about the frequency of air conditioner usage. Typically, an
air conditioner was used mainly at night, for an average of 9.17 hours per day. On average,
new models are more efficient than old models by 3%. Since air conditioners account for
almost 60% of total household consumption, an energy efficiency campaign to increase
awareness of substantial energy saving potential would benefit consumers.
Figure 1.18: Number of Units by Age Group
800
721
700
612
600
517 502
486
500
Units
380 368
400
292
300
200
100
0
10 years
Air conditioners Refrigerators
Source: Author (2019).
19Table 1.5: Number of Units and Electricity Consumption per Unit by Number of Usage
Years
Type of Quantity Electricity Average
Equipment Consumption Consumption per
(units) (kWh) Unit
(kWh/unit)
Air Conditioners
< 3 years 612 1,546,945 2,528
3–5 years 721 2,008,826 2,786
6–10years 486 1,252,525 2,577
>10 years 292 757,521 2,594
Total 2,111 5,565,816
Refrigerators
10 years 368 376,547 1,023
Total 1,767 1,673,021
Source: Author (2019).
5.4. Electricity Saving Potential of Appliances
The residential sector would have significant potential for energy saving if energy
consumption habits changed. A sizeable portion of households were unaware of EEC and
have not, therefore, done anything to use electricity more efficiently. Air conditioners,
refrigerators, lighting, and water heaters consumed the most electricity in the residential
sector (Figure 16). The proportion of refrigerators 6 years or older was significant at 49.3%.
The proportion of air conditioners over 6 years old was only about 37% of all air
conditioners. Newer refrigerators and inverter-type air conditioners are more energy
efficient.
Households were asked about the use of energy-efficient lights such as compact fluorescent
and other types of low-energy light bulbs instead of incandescent ones. About 95% of
households said they had installed at least some low-energy light bulbs for indoor and
outdoor lighting. Only 5% of households used LED.
As for water heating, most households (67.4%) had instantaneous water heating: 32.6% of
households had a boiler and no households had solar water heating.
An estimated total of 73 GWh or 5.3% of residential electricity consumption (in 2015) could
be saved if users of the four appliances were to engage in energy-saving practices.
205.5. Analysis of Vehicle Ownership
The questionnaire included several questions about households’ ownership of vehicles and
use of motor fuels. Most households (92%) owned motorcars and the rest (8%) had some
form of transportation such as station and dual-purpose wagons, window vans, scooters,
microbuses, and motorcycles.
The indicator was higher for households living in Brunei-Muara and lowest in Temburong.
Car-owning households owned an average of three. Households with incomes of
BND3,000– BND10,000 and above had the highest rate of car ownership (16%).
Half of households (56%) owned vehicles with an engine capacity of 1.5L–2.2L and about
19% of households owned vehicles with an engine capacity more than 2.2L (Figure 19).
About 25% of households owned vehicles with an engine capacity of less than 1.5L. Vehicles
with an engine capacity of less than 1.5L had the highest fuel economy of 12.7 km/L,
followed by those with an engine capacity of 1.5L–2.2L at 9.4 km/L, and those with an
engine capacity of more than 2.2L at 6.2 km/L (Figure 20). The overall average fuel
economy was about 8.10 km/L.
Figure 1.19: Share of Vehicles by Engine Capacity
19%
25%
2.2L
56%
Source: Author (2019).
21Figure 1.20: Share of Fuel Economy by Vehicle Engine Capacity
14
12,7
12
10 9,4
8 2.2L
4
2
0
Source: Author (2019).
The analysis of the car stock (Figure 21) revealed that 30% of vehicles were 6–10 years old
and 13% 15 years. The average age of cars was about 7.6 years.
Motorcars using petrol dominated with a share of 81%. Motorcars using diesel accounted
for 18% and those using other fuels for 1%. Hybrid motorcars had no records. However,
more detailed data is needed to establish a clear overview of energy consumption in
transport.
Figure 1.21: Age of Vehicles (Years)
35,00%
30%
30,00%
25%
25,00% 23%
20,00%
15,00% 13%
12%
10,00%
5,00%
0,00%
15 years
Source: Author (2019).
226. Summary of Key Findings on Household Energy Consumption
(i) Electricity was the main energy source, followed by LPG and, to a lesser extent,
natural gas.
(ii) Average electricity consumption per household was 15,785 kWh/year (or 1,315 kWh
per month), which was significantly higher than the average values of EU and Asian
household electricity consumption. However, actual electricity consumption per
household could be higher because the survey results were lower than national
energy statistics (Table 1.3).
(iii) Average household electricity consumption in the four districts showed consistent
trends:
(a) Average electricity consumption per household was consistently high,
exceeding 1,000 kWh per month in each district. The lowest monthly
average was 1,025 kWh per month in Belait and the highest 1,502 kWh per
month in Brunei-Muara (Figure 12).
(b) All four districts showed substantial use of air conditioners and
refrigerators.
(iv) Air conditioners, refrigerators, lighting, and water heaters used a significant amount
of energy. Their combined share was about 91% of total household electricity
consumption (94%, including fans). Air conditioners used the most electricity, with
an average share of 59.5% (Figure 15).
(v) The influence of household income on electricity consumption is summarised in
Figure 8. The highest-income group consumed more electricity for air conditioning
(65.6%) whilst the lowest-income group consumed less (53.1%).
(vi) A significant proportion of refrigerators in use that were 6 years or older was almost
50% whilst that of air conditioners in use that were 6 years or older is 37%. Savings
could be significant if old refrigerators were replaced with newer and energy-
efficient models. (Appendix A compares refrigerators’ unit electricity consumption
by years used.) Because air conditioners are on for long hours, energy savings could
be significant if old units were replaced with newer and energy-efficient models
equipped with inverter technology.
(vii) Air conditioners were on for several hours (average 9.17 hours per day) because
electricity tariff was low, which is why they accounted for about 60% total
residential electricity demand. Electricity consumption data from the BDHECS were
lower than national energy statistics. Air conditioners could be used longer than
suggested by the survey, which means the share of electricity consumption by air-
conditioners should be more than 60%.
7. Policy Recommendations
Analyses from the survey results show that appliances and electronics drive much of the
household energy consumption in Brunei Darussalam. Most households had limited
23understanding of appliance and equipment efficiency. To achieve significant residential
energy savings, the following are recommended:
7.1. Implement mandatory standards and a labelling system
(i) Develop regulations and legislation for standards and labelling of lighting, appliances,
and equipment and ensure that these measures are enforced and regularly updated.
Standards and labelling should focus on products that will deliver the greatest energy
savings as well as offer economic and environmental benefits by helping reduce
energy intensity and the carbon footprint.
(ii) Establish minimum energy performance standards (MEPS) for building components
and systems such as glazing, wall and roof materials, insulation, windows, water
heating, and cooling systems.
(iii) Establish an energy labelling scheme to help consumers compare the energy
efficiency of domestic appliances and make informed choices based on reliable and
certified information.
(iv) Establish laboratories to test and evaluate the efficiency of household appliances and
equipment, and to make sure that they comply with regulations and MEPS.
7.2. Develop information and awareness campaigns and educational programmes
Short term
(i) Develop and implement continuous and sustainable communication outreach
programmes such as roadshows and exhibitions, as well as media information and
education campaigns, to highlight energy efficiency opportunities of stakeholders in
the energy business and of end-use consumers.
(ii) Publish energy efficiency guideline booklets and distribute them to households
(applicable to all appliances). The booklets would be made available on the ME
website to help consumers make informed decisions based on energy savings and
quality of life rather than only on initial costs. Since space cooling accounted for the
largest proportion of residential electricity use, the guidelines should promote
optimising cooling through passive measures before considering energy saving
through appliances.
(iii) Encourage replacement of appliances with efficient units, especially old units
exceeding 10 years.
Long term
(i) Incorporate EEC in primary and secondary school curriculums, and train teachers so
they can instil in students EEC as an integral part of living habits and decision making.
(ii) Introduce national energy awards to give public and professional recognition for
excellent work in energy efficiency and to help encourage best practices.
(iii) Appoint an energy efficiency body or champion in government, business, and the
public to save energy.
247.3. Implement incentives and tariff reform
(i) Encourage consumers to choose energy-efficient appliances and vehicles, including
by reducing duties or sales tax on them.
(ii) Provide soft loans for efficient appliances and low-emission vehicles.
(iii) Restrict the importation of inefficient appliances based on MEPS and labelling.
(iv) Complement efforts to reform electricity tariffs and transport fuel assistance. Any
increases in government expenses as a result of these measures could be balanced by
a decrease in spending on energy subsidies.
7.4. Promote residential building energy efficiency technology
Adopt passive design strategies:
(i) Install insulation on roofs and/or walls to minimise solar thermal heat gain.
(ii) Install window shading devices to minimise solar thermal heat gain.
(iii) Improve building design and construction, e.g. doors, windows, and ceilings, to
minimise air leakage.
(iv) Use roof turbine ventilators to vent out hot air.
(v) Use building materials suitable for a hot and humid climate.
Adopt active design strategies:
(i) Develop guidelines for selecting energy-efficient appliances.
(a) Select suitable appliance capacity for household usage to avoid over-sizing.
(b) Select appropriate technology, e.g. inverter type for air conditioning and
refrigeration, CFL and LED lighting, solar water heating, outdoor photo sensors
or timers and security lighting, amongst others.
(ii) Develop guidelines for the efficient use and maintenance of appliances.
(a) Avoid ineffective usage (energy conservation).
(b) Encourage regular servicing and maintenance.
8. Conclusion
The BDHECS was successful despite the small sampling size and some inaccuracies that
resulted in electricity consumption results lower than national energy statistics. However,
the discrepancy between the survey results and the national energy statistics is within a
reasonable range.
The BDHECS analyses provide useful information for policy planning (section 1.6). The
dominant consumer of household electricity was clearly air conditioners, contributing
59.5% of average residential electricity consumption. Air conditioners, refrigerators,
lighting, and water heaters consumed about 91% of electricity. Therefore, by adopting the
four key EEC policy measures recommended in section 1.7, Brunei Darussalam could
potentially reduce its electricity consumption by up to 5.3% annually. Implementing these
recommendations would require active participation of all stakeholders nationwide. If a
residential EEC road map were to be established, the BDHECS would be a useful reference
and guide.
25You can also read


