Electric Vehicles and Batteries Can Drive Growth of Residential Solar
←
→
Page content transcription
If your browser does not render page correctly, please read the page content below
Gerard Wynn, Energy Finance Consultant, IEEFA                                              1
Christian Kunze, Senior Energy Researcher, Smart Innovation Norway
Arjun Flora, Analyst
May 2019

Electric Vehicles and Batteries Can
Drive Growth of Residential Solar
EV and Battery Cost Reductions Important for
Encouraging New Demand
Executive Summary
This report assesses the prospects for residential solar, batteries and electric
vehicles (EVs) in Britain and Germany. These technologies are expected to be at the
centre of global energy system disruption in the future, because of declining costs
and their close fit with a global energy system increasingly transitioning towards
decarbonisation, decentralisation, digitalisation and democratisation. Strong mutual
benefits make these technologies even more disruptive together than in isolation.
The potential contribution of battery storage towards the electrification of mobility
and heating further increases its relevance and impact.

Our focus is on Britain and Germany, as two of the top four solar and EV markets in
Europe. As time goes on, we expect to see even bigger opportunities in southern
European and emerging economies. Like many European countries, both Britain and
Germany are now reducing support for solar power, potentially slowing the
transition to renewables. Britain ended all residential solar subsidies as of March 31,
2019 and support is steadily falling in Germany, and could be phased out under
present guidelines, in the second half of 2020.

This report looks at opportunities for near-term growth in the residential solar,
battery storage and EV markets. We show that batteries and EVs can boost the
economics of rooftop solar, by enabling households to use more of the solar power
they produce, thereby increasing savings on their electricity bills. These savings rise
over time, as the cost of rooftop solar, batteries and EVs falls. In addition, we review
how regulators can reform grid services markets, to put these technologies on a
level playing field with conventional generation, which further boosts income. While
not a focus of this report, we note that smarter domestic tariffs that reward
consumers for using off-peak power can further drive demand, as will smarter EV
chargers that contribute towards grid stability.

Our analytical approach was to estimate how many years of electricity bill, road fuel
and other savings it would take for households to recoup their initial investment on
various combinations of solar, batteries and EVs. Such payback periods are a useful
measure familiar to households making these investment decisions. The models
were developed using actual cost data as provided by a range of solar, battery and
EV providers in Britain and Germany. Various cost reduction assumptions were
made to calculate the payback periods for new projects through 2030.
Electric Vehicles and Batteries Can Drive
Growth of Residential Solar                                                            2

Main Findings
We investigated four themes: the drivers behind adoption of residential solar in
Britain and Germany, the extent to which batteries and EVs can add value, the
potential for grid services markets to boost adoption, and the impact on adoption of
continued cost reductions over the next decade. We summarise our main findings,
for various combinations of market standard systems for residential solar (4kW),
battery (8kWh, 5kW) and a small EV (35kWh).

1. Solar feed-in tariffs and higher retail power prices in Germany result in far
   shorter payback periods for residential solar systems. In Britain, the
   payback period for stand-alone solar is 19 years, compared with six years in
   Germany. Stand-alone solar in Britain currently has an annual return on
   investment (ROI) of minus 2.7% compared to 10.3% in Germany. Phasing out
   feed-in tariffs in Germany would double present payback periods to 12 years
   (ROI 1.5%). After removing solar feed-in tariffs and export income, Britain is
   now also poised to scrap reduced VAT for solar and battery installations. Such a
   move would increase the upfront cost of solar installations by 14%; add more
   than a year to payback periods (to above 20 years); and lower ROI further to
   minus 3%.

2. Smart devices almost halve solar payback periods in Britain, to 10 years.
   Such devices, produced by the likes of Smappee and Tiko, can intelligently
   operate large controllable loads, such as electric heat pumps (where available),
   to coincide with daytime solar generation. In this way, they increase energy bill
   savings. They also cut solar payback periods in Germany.

3. Adding an EV and/or battery system reduces solar payback periods in
   Britain. EVs in Britain generate net annual savings of around £700 compared
   with an equivalent conventional vehicle, paying off the upfront price premium in
   less than six years and generating a positive ROI of 4%. In Germany, EVs have a
Electric Vehicles and Batteries Can Drive
Growth of Residential Solar                                                             3

    longer payback period because of higher power prices and lower road tax
    savings. By providing a new outlet for residential solar generation, EVs increase
    self-consumption and enhance bill savings. A combined solar-battery-EV system
    in Britain today has a payback period of nine years and an ROI of 0.9%; in
    Germany it is seven years with an ROI of 6.4%.

4. Solar-battery-EV systems presently compete on an unlevel playing field in
   grid services markets. These markets offer incentives for electricity generation
   and storage that can help balance network demand and supply in real time. At
   present, they unfairly benefit large, conventional power plants, for example
   through codes which make it costly to certify small energy assets. In Britain,
   some battery providers, such as Moixa and Powervault, give households a small
   income annually in return for permission to access their batteries for the sale of
   aggregated grid management services. We assume this income is presently
   £25/kW battery power/year. Doubling it reduces the solar plus battery payback
   period to 12 years, from 14 years. In this report, we assume zero grid-services
   income for management of EV batteries. In reality, EVs are likely to become an
   important or even critical source of grid stability over the next decade, as a
   massive, and largely idle, grid-connected energy source.

5. Combined solar-battery-EV systems could quickly become an obvious
   choice for households with available roof-space and EV home-charging if
   our cost reduction assumptions bear out. By 2025, in Britain, a solar-battery-
   EV system will have a four-year payback period, falling to one year in 2030.
   Similarly, in Germany, the same combined system has a three-year payback in
   2025, falling to below one year in 2030. In Britain, we conservatively assume no
   policy change to the export tariff, keeping residential solar power unrewarded
   through 2030. Systems would become even more attractive under seemingly no-
   brainer regulatory reform that allows households to sell their solar power at
   wholesale power market prices, and by doubling today’s grid services income.
Electric Vehicles and Batteries Can Drive
Growth of Residential Solar 4
Table of Contents
Executive Summary .............................................................................................................................. 1
Main Findings .................................................................................................................................. 2
Introduction ............................................................................................................................................. 5
Our Approach .......................................................................................................................................... 8
Savings on Energy Bills ................................................................................................................ 8
Government-backed Financial Support ................................................................................ 9
Access to Grid Services Markets............................................................................................ 10
Cost Reductions............................................................................................................................ 11
Our Method .................................................................................................................................... 12
Findings .................................................................................................................................................. 12
Stand-alone Solar ........................................................................................................................ 13
Solar Plus Battery ........................................................................................................................ 14
Solar Plus Battery Plus EV ....................................................................................................... 14
Conclusions ........................................................................................................................................... 15
Appendix ................................................................................................................................................ 17
About the Authors .............................................................................................................................. 19
Table of Figures
Figure 1: Cumulative Solar PV Capacity, Germany .................................................................. 6
Figure 2: Cumulative Solar PV Capacity, Britain ....................................................................... 7
Figure 3: Cumulative EVs and Public Chargers, Germany and Britain ............................ 8
Figure 4: Stand-alone Solar Payback Period and ROI .......................................................... 13
Figure 5: Solar Plus Battery Payback Period and ROI ......................................................... 14
Figure 6: Solar-Battery-EV Payback Period and ROI ........................................................... 15Electric Vehicles and Batteries Can Drive Growth of Residential Solar 5 Introduction This report investigates how small-scale solar PV, batteries and EVs in combination can add value and drive mutual growth. We see these technologies as having strong complementarity, given expected cost reductions; a close fit with energy sector trends of decarbonisation, decentralisation, digitalisation and democratisation; and with energy and climate policy prioritising electrification of transport and heating.1 Integration of the electricity, transport and heating sectors is expected to help achieve energy system decarbonisation affordably, while preserving reliability and adequacy. We also seek to understand how regulatory changes can boost growth in solar, batteries and EVs by increasing access to grid services markets. These markets help network operators balance electricity demand and supply and maintain grid stability, and today are typically restricted to conventional power plants. We assess the potential for solar, batteries and EVs, focusing on Britain and Germany. However, we expect the trends discussed here to apply equally or more in sunnier countries in southern Europe and beyond. Historically, solar power has proved popular in both Britain and Germany, as a result of feed-in tariffs that In Britain and Germany, provided a guaranteed price premium over a certain contract length, typically 10 to 20 solar feed-in tariffs are years. These subsidies were intended to foster now being withdrawn, a low-carbon transition, and to provide a threatening growth return on investment for households. Solar feed-in tariffs are now being withdrawn, in the sector. however, threatening such growth. In Britain, all support for solar power ended as of end- March 2019. That support has not been replaced, which means that, at present, new projects will earn zero income from electricity generation and grid exports. In Germany, the feed-in of electricity from solar power into the public grid is still subsidised. However, this tariff is falling over time, linked with rising installed capacity. Present legislation requires grid operators to end feed-in tariffs for new rooftop installations, once total installed capacity reaches 52 gigawatts (GW).2 At present installation rates, that point might be reached in the second half of 2020.3 1 European Parliament, 2018. Sector Coupling: How can it be enhanced in the EU to foster grid stability and decarbonise? 2 Buzer.de. Gesetz für den Ausbau erneuerbarer Energien (Erneuerbare-Energien-Gesetz - EEG 2017). 3 PV Magazine, 2019. Verbände-Allianz fordert Abschaffung des Photovoltaik-Förderdeckels. February 27, 2019
Electric Vehicles and Batteries Can Drive
Growth of Residential Solar                                                              6

Regarding solar PV growth to date, Germany and Britain rank in the top four by
cumulative capacity in Europe. As of end-2018, Germany had 45.4GW cumulative
installed solar PV capacity, and 1.7 million PV systems.4 Small-scale rooftop
installations, below 10kW capacity, accounted for 59% of solar installations by
number in 2017.5 Solar PV in total accounted for 8.4% of all electricity generation in
Germany last year.6 As of end-2018, Britain had 13GW cumulative installed solar PV
capacity, across 976,000 systems, according to the Department for Business, Energy
and Industrial Strategy (BEIS).7 Small-scale installations, below 10kW capacity,
accounted for 97% of these installations by number. Solar PV accounted for 4% of
total electricity generation in Britain last year.8

Figure 1: Cumulative Solar PV Capacity, Germany

Source: Energy Charts, based on data from AGEE, BMWi, Bundesnetzagentur, German TSOs,
Destatis and EEX.

4 Fraunhofer Institute, 2019. Photovoltaics Report.
5 Fraunhofer, 2019. Aktuelle Fakten zur Photovoltaik in Deutschland, p. 31.
6 Fraunhofer Institut für Solare Energiesysteme (Fraunhofer ISE), 2019. Öffentliche

Nettostromerzeugung in Deutschland im Jahr 2018, p. 12.
7 BEIS, 2019. Solar Photovoltaics Deployment, 2019.
8 BEIS, 2019. Energy Trends: renewables.
Electric Vehicles and Batteries Can Drive
Growth of Residential Solar                                                            7

Figure 2: Cumulative Solar PV Capacity, Britain

Source: Department for Business, Energy and Industrial Strategy (BEIS).

Looking at small-scale battery storage, German consumer data company Finanztip
estimates that some 120,000 households and commercial enterprises had installed
batteries alongside PV systems, as of February 2019.9 The German government
agency, Germany Trade and Invest (GTAI) sees a growing business case, and a
potential annual market of 50,000 PV-battery systems by 2020.10 Britain lags in
small-scale residential battery storage, with no central database recording
installations to date.

As for battery EVs, excluding plug-in hybrids, both Britain and Germany rank among
the top seven markets globally, and top four in Europe, according to the latest data
from the International Energy Agency.11 The IEA estimates that Germany and
Britain saw 25,070 and 13,550 new EV registrations in 2017, with a market share of
0.7% and 0.5% respectively. The IEA also charts growth in EV chargers, finding
Germany and Britain again among the top seven countries worldwide for
cumulative installed chargers, as of the end of 2017. The IEA estimated that
Germany had 24,289 publicly accessible chargers, and Britain some 13,534.

9 Finanztip, 2019: Sonnenstrom im Akku speichern.
10 GTAI, 2018. The Energy Storage market in Germany.
11 IEA 2018, Global EV Outlook 2018.
Electric Vehicles and Batteries Can Drive
Growth of Residential Solar                                                               8

Figure 3: Cumulative EVs and Public Chargers, Germany and Britain

Source: IEA.

Our Approach
Our analytical approach was to estimate how many years it would take for various
energy bill savings to recoup the initial investment on various combinations of solar,
batteries and EVs, as well as to calculate an initial annualised return on investment
(ROI). The models were developed using actual cost data as provided by a range of
solar, battery and EV providers in Britain and Germany. We made various cost
reduction assumptions to calculate the payback periods for new projects through
2030.

We see four key factors affecting revenues for residential solar, batteries and EVs, in
combination or isolation. These are: energy bill savings, financial support, access to
grid services markets, and cost reductions. The modelling assumptions for each
factor are described in the section that follows.

Savings on Energy Bills
In the case of solar and batteries, energy bill savings are generated by substituting
grid electricity with solar power, and in the case of EVs, by avoiding gasoline or
diesel fuel purchases. Savings will increase, the higher the domestic energy prices.

•   In terms of electricity bill savings, a key measure is the solar self-consumption
    rate. The higher the self-consumption rate, the more solar generation is being
    used by the household instead of being exported to the grid, and the greater the
    energy bill savings. Smart devices can increase the self-consumption rate by
    intelligently switching on controllable appliances during the daytime, when
    solar is available. We assume that stand-alone solar has a self-consumption rate
Electric Vehicles and Batteries Can Drive
Growth of Residential Solar 9
of 30%, and that such smart devices double
this to 60% (but we note these only apply to
households with large controllable loads,
such as electric heat pumps). By allowing use
of solar generation after sunset, batteries can
increase the solar self-consumption rate up
to 100%, depending on the relative size of the
battery and rooftop solar system. We do not
take account of seasonality in this report.
By allowing use of
Seasonality complicates the task of solar generation after
optimising the size of the battery and solar sunset, batteries can
PV system, since the battery may be too small
and solar PV system too large in winter and
increase the solar
vice versa in summer. In general, the self-consumption rate
economics are slightly poorer if we take into up to 100%.
account seasonality, because either self-
consumption rates are lower in summer, or
the battery is over-sized in winter. The latter
problem can be mitigated by exploiting time-
of-use tariffs to use spare battery capacity to
arbitrage between winter peak and off-peak
power prices.
• Another key metric in electricity bill savings is total consumption as the ceiling
on potential savings: the higher the annual consumption, the greater the
potential energy bill savings from investing in solar and batteries. EVs can help
drive solar and battery adoption partly for this reason, by increasing domestic
power use. We use national averages for domestic electricity use in Britain and
Germany (3,100 and 3,400 kilowatt-hours [kWh] respectively). We assume
annual EV travel of 15,000 kilometres, and EV efficiency of 0.15kWh per
kilometre.
• We make various other assumptions relevant to energy savings, such as
residential electricity tariffs and tariff inflation (German tariffs are almost
double those in Britain, at 32 euro cents per kWh compared with 15 pence); and
gasoline prices and fuel price inflation (see Appendix).
Government-backed Financial Support
Government support for solar, batteries and EVs includes solar feed-in tariffs, EV
capital grants and reduced value added tax (VAT). Support is falling as these
technologies become more competitive.
• Traditionally, rooftop solar was supported both in Britain and Germany with
feed-in tariffs (FiT), which guaranteed a certain price per unit of exports to the
grid (in Germany, presently around 12 euro cents per kWh), or per unit of both
generation and grid exports (formerly in Britain, around 3 pence per kWh, or
just 20% of the retail power price). Britain has now scrapped even this support,
meaning new solar systems earn zero income from either generation or gridElectric Vehicles and Batteries Can Drive
Growth of Residential Solar 10
exports, unless households or their
aggregators can negotiate private
contracts with electricity suppliers. The
UK energy regulator, Ofgem, is now
considering a “smart export guarantee”,
where utilities would offer to buy this
solar power.12 It is unclear how much
such a scheme might offer, or when it
would come into force, and it is, therefore, Britain has now scrapped
excluded from this report. In Germany,
we find solar income at present is divided
rooftop solar support,
equally between the FiT and electricity meaning new systems
bill savings, underlining the impact of earn zero income from
scrapping the FiT altogether, as in Britain.
At present, in Germany, the solar rooftop
either generation or
FiT is due to be phased out when installed grid exports.
solar capacity reaches 52GW, a level
expected to be reached in the second half
of 2020. That may change, under pressure
from various political parties. In this
report, we assume that the FiT in
Germany falls in a straight line from 12
euro cents per kWh in 2019 to 4 euro
cents in 2030.
• Other financial support for solar power includes reduced VAT on capital
expenditure, at 5% versus the standard 20% in Britain, and at 0% versus 19% in
Germany (provided that in Germany the installer instead pays full VAT on self-
consumed solar power for the first five years). In both Britain and Germany,
these VAT exemptions only apply to batteries if they are installed with solar
panels, rather than retrofitted at a later date.13 We assume 20% VAT on
batteries in Britain, as batteries are often installed after the solar panels. We
note that Britain plans to scrap the reduced VAT rate, but in our base case we
continue to assume 5% VAT for solar, as this change is not enacted yet.
• In both Britain and Germany, EVs qualify for zero road tax, and a capital grant at
purchase. In our analysis, we compare the VW e-Golf with the conventional Golf
1.5, two vehicles with similar power. In Britain, the e-Golf avoids annual road tax
of £160, and in Germany a tax of €62. In Britain, the capital grant is worth
£3,500; it is €4,000 in Germany. We assume the grant is phased out from 2021,
as seems in line with present plans in Germany.14
Access to Grid Services Markets
Aggregators can package multiple small-scale solar and battery systems, to sell
various energy services to grid operators to maintain security of supply, including to
12 BEIS, 2019. Consultation on Smart Export Guarantee Scheme: Impact Assessment.
13 Finanztip, 2019. Sonnenstrom im Akku speichern.
14 Reuters, 2019. German ministry wants to extend electric car subsidies: document.Electric Vehicles and Batteries Can Drive
Growth of Residential Solar 11
balance demand and supply. These markets remain heavily tilted in favour of
conventional power plants, with regulatory change required to give small-scale
applications equal access.
• At present, grid services markets are in their infancy for small-scale generation.
For example, in Britain, participation in balancing markets still requires
aggregators to certify individual battery assets, even if these number in the
thousands, when there are alternative options for ensuring they deliver. Other
markets are still exclusively open only to large generators, such as black-start
services (to cover large power outages without outside transmission network
support). In Germany, primary energy markets that reward fast-response assets
only recently opened to aggregators. One of the largest battery aggregators,
Sonnen, passed a 1MW availability test in December 2018.15 Local energy
markets that reward distributed assets including residential batteries are
expected to become increasingly prevalent under new market rules introduced
by the EU’s recent “Clean Energy Package.” One change will make local grid
operators responsible for managing the low-voltage network more cost-
effectively, which may motivate these firms to contract flexible generation and
battery storage rather than to build out grid infrastructure. How and when
network operators implement market reform is uncertain, however.
• Already, some battery operators, such as Sonnen in Germany and Moixa and
Powervault in Britain, reward customers for making their batteries available for
aggregated grid services, as they seek to build a customer base. Based on this
income, in this report we assume household grid services income of £25/kW
battery power/year in Britain. In Germany, we base grid services income on
actual income in primary reserve energy markets, at €115/kW/year, and
assume half this would be made available to the household, i.e. €58/kW/year.16
• In this report, we assume zero grid services income for EVs, because of the lack
of clarity over how and when such services will be remunerated. In reality, EVs
could become the backbone of grid balancing and stability in the 2020s, as a
massive, grid-connected, distributed electrical resource which is idle most of the
time. At present, extremely few EV chargers are bidirectional, where batteries
can equally charge from or discharge to the grid. To optimise EV assets,
governments will have to mandate bidirectional chargers in the near future.
Payment for grid services by EVs could significantly boost the economics of the
EVs, solar and batteries considered in this report, and accelerate wider
adoption.
Cost Reductions
• We use various published market prices for solar, optimisers, batteries and EVs
in 2019 (see Appendix for full details).
15 https://sonnengroup.com/households-replacing-power-stations-germany-sonnen-putting-
largest-virtual-battery-its-kind/
16 https://www.regelleistung.net/ext/tender/Electric Vehicles and Batteries Can Drive
Growth of Residential Solar 12
a. Solar PV: we assume wholesale module prices of 30 pence per watt (25
euro cents in Germany); developer margins of 15%; balance of system
(BoS) costs of 40p/W (30 cents); labour costs at 25% (Germany: 30%) of
full installed cost; and annual solar operational expenditure at £50
(€50).
b. Solar consumption optimisers: capital cost of £300 each (€300) before
VAT.
c. Stationary batteries, in Britain, are assumed at a cost of £355/kWh for
an 8 kWh battery, based on a range of installer estimates (Germany:
€428/kWh, based on published LG Chem estimates17); developer
margins of 15%; fixed BoS costs of £1,000 (€1,000); and labour costs at
20% of full installed cost.
d. EVs: battery pack costs of £150/kWh (€150), and an e-Golf price
premium of £1,500 over the conventional Golf 1.5, excluding the cost of
the battery pack.
• We then apply annual reductions to these numbers, from 2020 to 2030, to take
into account expected improvements in technology and manufacturing
economies of scale. Our cost reduction assumptions include: solar modules @
minus 10% annually; solar BoS -5%; stationary batteries -15%; battery BoS -
5%; solar and battery developer margins -5%; EV battery pack -10%; and EV
price premiums -£400 (-€400).
Our Method
For calculating the payback period, we calculate the number of years it takes for
total cumulative income to pay off upfront and cumulative costs, using Excel “What-
if Analysis.” Costs include capital cost, debt financing and operational costs. For the
financing cost, we assume the EV is 100% debt-funded and other systems (solar,
battery, optimiser) are 50% debt-funded, where the cost of debt is 3.6%-4% and
cost of equity is zero. Income includes government-backed financial support and
energy bill savings as described in the previous sections.
For calculation of ROI, we divide initial net annual income by the upfront capex. Net
income includes the variables as described above, such as financial support plus
energy bill savings (year 1) minus costs including operational costs, financing costs
and depreciation over seven to 20 years (see Appendix). Upfront capex includes full
installed cost of the installation or EV, including VAT.
Findings
While our modelling, in theory, allows us to analyse any combination of any size of
solar system, battery and EV, for the sake of brevity, we selected what we consider
17https://www.dp-solar-shop.de/Speichersysteme/batteriesysteme/lg-pv-speicher/lg-resu-10-
48v-lithium-ionen-speicher.html?refID=04Electric Vehicles and Batteries Can Drive Growth of Residential Solar 13 to be “typical” installations. These typical systems were 4kW rooftop solar, 8kWh (5kW) battery, and a small 35kWh EV. We calculated the payback period and ROI for these systems in isolation and in various combinations. We also considered a smart solar optimiser that doubles the solar self-consumption rate by allocating solar generation to controllable daytime loads. Stand-alone Solar We find stand-alone solar presently has a payback period of 19 years in Britain, and an ROI of -2.7%. Because of solar export tariffs and higher domestic energy bills, stand-alone solar is far more attractive in Germany, with a six-year payback and an ROI of 10%. Assuming no policy change through 2030, stand-alone solar will remain less attractive in Britain than it is in Germany, today. Figure 4: Stand-alone Solar Payback Period and ROI Britain Germany
Electric Vehicles and Batteries Can Drive
Growth of Residential Solar                                                            14

Solar Plus Battery
Because of the disadvantages for solar in Britain (zero grid export revenues, lower
residential power prices), solar plus battery systems only become attractive around
2025 (six-year payback, 7% ROI), and increasingly thereafter with further solar
module cost deflation. In Germany, solar plus batteries become increasingly
attractive from the early 2020s, when payback periods fall below five years, and ROI
reaches double digits.

Figure 5: Solar Plus Battery Payback Period and ROI
Britain

Germany

Solar Plus Battery Plus EV
In Britain, EVs already boost the economics of solar and batteries, because they
deliver cost savings compared with conventional vehicles, and so have a low
payback period compared with solar on its own. By 2025, we find a combined solar-
battery-EV system in Britain has a payback period of four years, falling further to
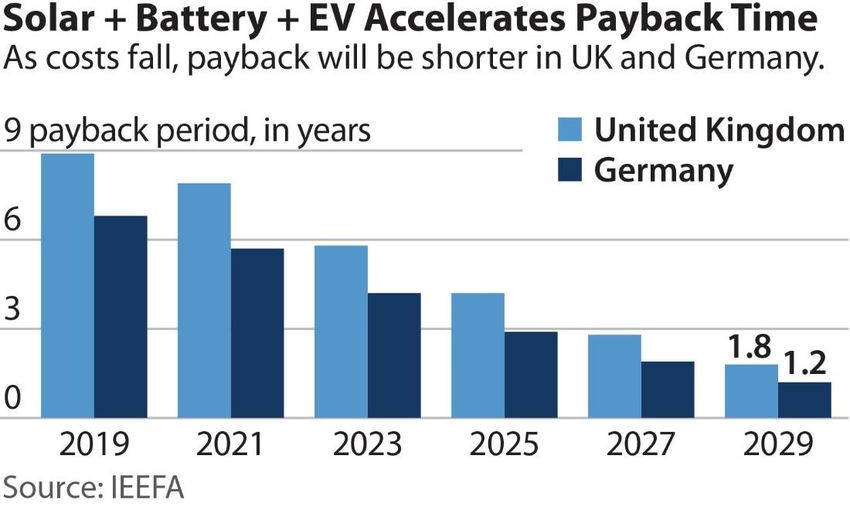
Electric Vehicles and Batteries Can Drive
Growth of Residential Solar                                                              15

one year in 2030. Similarly, in Germany, by 2025 a combined solar-battery-EV
system appears a no-brainer, with payback periods falling below three years, and
below one year by 2030.

Figure 6: Solar-Battery-EV Payback Period and ROI
Britain

Germany

Conclusions
We conclude that EVs will be an increasingly potent driver of change in home
energy systems and wider electric grids over the next five to 10 years, supporting
the societal shift from electricity consumption to more active “prosumption.” EVs,
solar and batteries fit well together, because home-charging of EVs provides a new
source of domestic demand for rooftop solar and batteries, to self-generate and
store electricity, and thereby reduce energy bills. While our focus was on Britain and
Germany, as two forward-looking countries that have advanced growth in these
fields, we expect the benefits of integrating residential solar, battery storage and
EVs to follow in sunnier countries, including in southern Europe and beyond.
Electric Vehicles and Batteries Can Drive
Growth of Residential Solar                                                              16

EVs are already relatively low-cost, with a
payback period of six years in Britain
(Germany: 9 years, because of higher power
prices, and lower road tax savings), and a
positive ROI of 4% annually (Germany: 0%).
The annual cost of driving an EV in Britain is
barely one-third of the cost of a conventional
internal combustion engine (Germany: two-
thirds), which means that as the EV price
premium disappears altogether through the          Both countries should
2020s, they are likely to become the              continue to support the
investment of choice for transportation. For
households with off-street parking and              further rollout of EV
south-facing roof space, EVs could provide        chargers, which are vital
an important new source of demand for             to encourage adoption.
rooftop solar and battery storage. Cost
reductions from each technology can drive
bigger cost reductions in combination.
Already in Britain, adding an EV reduces the
payback period for solar or solar-plus-
battery. By 2025, payback periods for
combined solar-battery-EV systems may fall
to levels low enough to accelerate more
rapid adoption of all three technologies.

Such an energy transition will benefit not only private households with capital,
power supplies and off-street parking, but also society at large. The wider public
benefits of private investment in solar-battery-EV systems include the
decarbonisation of road transport, reduced fossil fuel imports, cleaner air, and
reduced grid upgrades by utilities and network operators whose costs are typically
passed on to all energy consumers.

It makes sense for regulators to accelerate adoption of small-scale solar generation
and battery storage by allowing these resources to compete on a level playing field
with conventional technologies. In Britain, that includes introducing new market
rules that pay households for exporting solar power to the grid, at least at wholesale
power market rates. In both Britain and Germany, it will also entail improving
access for residential energy systems to grid services markets, for example via
virtual aggregation of batteries. Both countries should continue to support the
further rollout of EV chargers, which are vital to encourage adoption. That will
include bidirectional chargers, which at present are almost non-existent, and are
vital to help EVs contribute to grid stability, by both charging from and discharging
to the grid, as required by electricity network operators.
Electric Vehicles and Batteries Can Drive
Growth of Residential Solar                                                                                             17

Appendix
Our basic input assumptions, for modelling of ROI and payback periods in Britain
and Germany follow.

             INPUT VARIABLES (2019)                             Britain                          Germany
HOUSEHOLD                                               Units             Value              Units         Value
            Annual power consumption excl EV         kWh                     3,100 kWh                        3,400
            Domestic tariff inflation                %                       6.92% %                          4.50%
            Domestic tariff                          £/kWh                   0.156 €/kWh                      0.320
            RPI inflation                            %                       2.97% %                          2.00%
SOLAR PV
          Capacity                                    kWp                      4 kWp                                4
          Average load factor                         %                  10.8% %                              10.8%
          Self-consumption rate                       %                     30% %                                30%
          PV Module cost, annual change               %                    -10% %                               -10%
          PV Module cost                              £/watt                0.30 €/watt                          0.25
          BoS materials cost, annual change           %                   -5.0% %                              -5.0%
          BoS materials cost                          £/watt                0.40 €/watt                          0.30
          Labour cost (% of total materials cost)     %                     25% %                                30%
          Opex (incl. any insurance & contingency) £/ year               -50.00 €/ year                       -50.00
          VAT                                         %                       5% %                                0%
          Solar degradation rate                      %                 -0.40% %                             -0.40%
          Solar generation FiT                        £/kWh                 0.00 €/kWh                           0.00
          Solar export FiT                            £/kWh                 0.00 €/kWh                           0.12
          Solar export FiT annual change              £/kWh                 0.00 €/kWh                          -0.01
          Depreciation period                         # years             20.00 # years                        20.00
SMART OPTIMISER
          Price, excl VAT                             £                 300.00 €                             300.00
          VAT                                         %                  5.00% %                                0%
          Depreciation period                         # years             15.00 # years                       15.00
BATTERY
          Battery system, rated capacity              kWh                      8 kWh                              8
          Battery system, rated discharge power       kW                       5 kW                               5
          Battery system efficiency rate              %                     98% %                               98%
          Battery system inverter loss impact         %                     96% %                               96%
          Battery depth of discharge                  %                     90% %                               90%
          Battery cost, annual change                 %                    -15% %                             -15%
          Battery cost                                £/kWh             355.00 €/kWh                         427.50
          BoS materials cost, annual change           %                      -5% %                              -5%
          BoS materials cost                          £                    1000 €                              1000
          Labour, year 1 cost (% of battery system cost)
                                                      %                     20% %                               20%
          VAT                                         %                     20% %                                0%
          Grid share income                           £/kW battery power 25.00 €/kWh battery capacity         58.00
           Depreciation period                       # years                 10.00 # years                    10.00
SOLAR + BATTERY
           Developer margin, annual change           %                        -5% %                             -5%
           Developer margin                          %                        15% %                            15%
           % debt funded                             %                        50% %                            50%
           Cost of debt                              %                         4% %                          2.75%
           Cost of equity                            %                         0% %                              0%
           WACC                                      %                      2.00% %                          1.38%
           Borrowing term                            # years                  3.00 # years                     3.00
           VAT charged on self-consumption           %                         0% %                            19%
EV
           Battery system, rated capacity            kWh                      35.8 kWh                          35.8
           Battery cost, annual change               %                       -10% %                            -10%
           Battery cost                              £/kWh                     150 €/kWh                         150
           VW e-Golf price premium, annual reduction £                         400 €                             400
Electric Vehicles and Batteries Can Drive
Growth of Residential Solar 18
INPUT VARIABLES (2019) Britain Germany
EV Units Value Units Value
Battery system, rated capacity kWh 35.8 kWh 35.8
Battery cost, annual change % -10% % -10%
Battery cost £/kWh 150 €/kWh 150
VW e-Golf price premium, annual reduction £ 400 € 400
VW e-Golf price premium excl battery pack £ £1,500 € 1,500 €
EV subsidy, annual change % -10% % -10%
EV subsidy £ -£3,500 € -4,000 €
Annual mileage km/ year 15,000 km/ year 15,000
Conventional veh efficiency, annual change -2% -2%
Conventional vehicle efficiency litres/km 0.048 litres/km 0.048
Conventional fuel price £/litre £1.20 €/litre 1.36 €
Annual conventional fuel savings £/ year £864.00 €/ year 979.20 €
Annual road tax, annual change % 2.97% % 4.81%
Annual road tax, Golf 1.5 £/ year £160.00 €/ year 62.00 €
EV efficiency, annual change % -5% % -5%
EV efficiency kWh/km 0.15 kWh/km 0.15
WACC - EV % 3.60% % 3.60%
Borrowing term - EV # years 3.00 # years 1.99
Depreciation period # years 7.00 # years 7.00Electric Vehicles and Batteries Can Drive
Growth of Residential Solar 19
About IEEFA
The Institute for Energy Economics and Financial Analysis conducts
research and analyses on financial and economic issues related to energy
and the environment. The Institute’s mission is to accelerate the transition
to a diverse, sustainable and profitable energy economy. www.ieefa.org
About the Authors
Gerard Wynn
Gerard Wynn is an energy finance consultant at IEEFA, specialising in the
economics and finance of renewables and fossil fuel generation. He has
previously worked as an analyst, editor and writer, in the energy and
environment sectors. He worked for a decade as a reporter and columnist at
Reuters News Agency, covering energy and climate change. He started his
career with a PhD in agricultural economics.
Christian Kunze
Christian Kunze is a senior energy management researcher at Smart
Innovation Norway, specialising in the implementation of smart energy
market projects. He has previously worked for a decade in the electricity
trading industry and runs his own trading company. He started his career
with a PhD in business administration.
Arjun Flora
Arjun Flora is an analyst with a particular focus on the new energy
technology sector. He previously spent 5 years working on M&A and
capital-raising transactions at Alexa Capital. He started his career in
Technology investment banking at Jefferies and holds a MEng from the
University of Cambridge.You can also read