VIRTUS KAR SMALL-CAP CORE FUND - June 30, 2021
←
→
Page content transcription
If your browser does not render page correctly, please read the page content below
VIRTUS KAR SMALL-CAP
CORE FUND

June 30, 2021
IMPORTANT RISK CONSIDERATIONS

Equity Securities   The market price of equity securities may be adversely affected by financial market, industry, or
                    issuer-specific events. Focus on a particular style or on small or medium-sized companies may
                    enhance that risk.

Limited Number of   Because the portfolio has a limited number of securities, it may be more susceptible to factors
Investments         adversely affecting its securities than a portfolio with a greater number of securities.

Market Volatility   Local, regional, or global events such as war, acts of terrorism, the spread of infectious illness or
                    other public health issues, recessions, or other events could have a significant impact on the
                    portfolio and its investments, including hampering the ability of the portfolio manager(s) to invest
                    the portfolio’s assets as intended.

Prospectus          For additional information on risks, please see the fund’s prospectus.

                                                                                                                            2
VIRTUS INVESTMENT PARTNERS
MULTI-BOUTIQUE, MULTI-STRATEGY MODEL
Key Facts:
Virtus affiliates4 Select external
subadvisers
$178.6
Billion in
AUM1
AFFILIATE
9 SHARED SUPPORT
Affiliates OPERATIONS AND IT
HUMAN RESOURCES
FUND SERVICES
+ 7 Select
LEGAL AND COMPLIANCE
Subadvisers
FINANCE
PRODUCT MANAGEMENT
DISTRIBUTION AND MARKETING
34
Funds Rated
4 or 5 Stars2
3
Past performance is not indicative of future results.
1As of 6/30/21. 2The Overall Morningstar Rating is based on risk-adjusted returns, derived from a weighted average of the three-, five-, and 10-year (if applicable) Morningstar metrics.
Analysis includes rated retail mutual funds only (funds with at least three years of history). Funds with A and I or Institutional shares use I or Institutional shares for Ratings otherwise,
A share is used. Please see page 17 for additional Morningstar disclosure. Strong ratings are not indicative of positive performance. 3Virtus has an ownership interest in the firm.
3KAYNE ANDERSON RUDNICK
PROFILE
At a Glance ◼ Originally established to manage founder capital
◼ Year Founded: 1984 ◼ Over three decades of experience
◼ Headquarters: ◼ A differentiated “business analyst” investment approach focusing on
Los Angeles, CA high-quality businesses
◼ AUM: $61.2 billion* ◼ A disciplined and repeatable investment process that produces high-
◼ Number of Investment conviction portfolios
Professionals: 16
◼ A wholly owned, independent subsidiary of Virtus Investment Partners
◼ Average Investment
Experience: 17 Years
Investment Philosophy
◼ A wholly owned,
Kayne Anderson Rudnick believes that purchasing high-quality
independent subsidiary
of Virtus Investment businesses with competitive protections at attractive valuations may lead
Partners to the achievement of excess returns over a complete market cycle
STRIVES TO
◼ Achieve a return meaningfully above that of the Russell 2000® Index
◼ Achieve this return objective with a portfolio that exhibits lower
overall risk characteristics than the benchmark
Source: Kayne Anderson Rudnick
*AUM as of June 30, 2021. 4SMALL-CAP CORE TEAM
Research Years
Portfolio Manager/Analyst Responsibility Sector Coverage Experience with KAR
Douglas S. Foreman, CFA Chief Investment Officer 35 Years 10 Years
Todd Beiley, CFA Portfolio Manager and Senior Research Analyst Energy 22 Years 19 Years
Communication Services
Jon Christensen, CFA Portfolio Manager and Senior Research Analyst Health Care 26 Years 20 Years
Julie Biel, CFA Senior Research Analyst Information Technology 13 Years 8 Years
Julie Kutasov Senior Research Analyst Materials 20 Years 20 Years
Industrials
Craig Stone Senior Research Analyst Industrials 32 Years 21 Years
Chris Wright, CFA Senior Research Analyst Financials 9 Years 9 Years
Real Estate
Sean Dixon Research Analyst Consumer Discretionary 12 Years 3 Years
Industrials
Adam Xiao, CFA Research Analyst Consumer Staples 6 Years 3 Years
Financials
Industrials
Jordan Greenhouse Managing Director – Senior Client Portfolio Manager 24 Years* 5 Years
James B. May, CFA Managing Director – Client Portfolio Manager 33 Years* 2 Years
Source: Kayne Anderson Rudnick
*Represents years of industry experience.
5KAYNE ANDERSON RUDNICK TENETS OF QUALITY
QUALITATIVE BUSINESS ASSESSMENT
Competitive Protection Owner-Oriented Management
◼ Brand/Reputation ◼ Cultivates Competitive Advantage
◼ Network Effect ◼ Rational Capital Allocation
◼ Scale/Cost Advantage ◼ Considers Stakeholder Interests
◼ Benchmarking Standard
◼ High Customer Switching Costs
◼ Barriers to Entry/Unique Asset
◼ Low Obsolescence Risk
KAR HIGH-QUALITY BUSINESS
◼ Protect and Grow Market Share
◼ High Economic Return on Capital
◼ Business Returns Shareholder Returns
Source: Kayne Anderson Rudnick
The commentary is the opinion of Kayne Anderson Rudnick. This material has been prepared using sources of information generally believed to be reliable; however, its accuracy is not
guaranteed. Opinions represented are subject to change and should not be considered investment advice or an offer of securities.
6KAYNE ANDERSON RUDNICK SOURCES OF QUALITY
EXAMPLES OF HIGH-QUALITY BUSINESS MODELS
Network Effect Cost Advantage
High Customer Brand Equity
Switching Costs
Source: Kayne Anderson Rudnick
The trademarks shown are the property of their respective owners. Percent of Virtus KAR Small-Cap Core Fund as of 6/30/21: Rightmove: 5.2%; Jack Henry & Associates: 1.7%;
Primerica: 4.8%; Acushnet Holdings Corp.: 4.7%.
The securities presented on this page are chosen based upon objective criteria. Companies are chosen to exemplify diversification. We typically select companies that operate in large,
vast industries, but have overwhelming market share for their particular niches. All information is provided for informational purposes only and should not be deemed as a
recommendation to purchase the securities mentioned. It should not be assumed that securities recommended in the future will be profitable. Holdings are subject to change.
7HIGH-QUALITY UNIVERSE DEVELOPMENT
KAYNE ANDERSON RUDNICK SOURCES ITS INVESTMENT UNIVERSE
IN A NUMBER OF WAYS
SMALL CAP UNIVERSE
Quantitative Screens Other Resources
◼ High return on capital over a full ◼ Research on existing portfolio holdings
economic cycle
◼ Meetings with companies
◼ Long and resilient earnings history
◼ Industry reviews
◼ High return on net operating assets
◼ Investment conferences
◼ Minimal debt
◼ Third-party research
KAYNE ANDERSON RUDNICK
UNIVERSE
Source: Kayne Anderson Rudnick
8INTENSIVE FUNDAMENTAL RESEARCH
Research Analysts and Portfolio Managers Work Together to Develop In-depth Business Knowledge
Qualitative Analysis Financial Analysis
Purpose: Determine if competitive advantage Purpose: Evaluate source, level, and sustainability
exists and evaluate its strength. of economic profitability.
Understand
◼ Review regulatory filings, company materials, link between ◼ Seek:
industry data, and third-party research
business – High and resilient return on capital
◼ Conduct comprehensive interviews with character and – Persistent earning power
management; contact other relevant parties financial
– Abundant discretionary cash flow
◼ Understand basis of competition within industry character
– Under-levered balance sheet
◼ Assess competitive threats and obsolescence
risk: What protects the business? ◼ Assess management’s capital allocation
practices; favor high insider ownership
Valuation Analysis
Purpose: Estimate total return over several year period; compare to other
opportunities considering varying levels of certainty
◼ Consider economic earning power in relation to enterprise value
◼ In our view, Mispricing can be created by: underfollowed company, investors’
over-reaction to short-term challenges, improved competitive position not yet
recognized
9PORTFOLIO CONSTRUCTION
Investment Guidelines Sell Discipline
Position Weights Extended Valuation
◼ 20-40 holdings ◼ Significant premium to intrinsic value
◼ Maximum Initial position is 5% (at cost) ◼ Expected annual return insufficient
◼ Maximum position size is 10% (at market)
Portfolio Upgrade
Sector Tolerances ◼ Better business
◼ Seek broad diversification, but no sector constraints ◼ Better price
Non-U.S. Holdings Acquisition Activity
◼ Our holding acquired at an attractive premium
◼ Up to 20%
◼ Our holding acquires a company diminishing its
Holding Period business or value
◼ Typically 3 to 5 years, but is often longer
Negative Company or Industry Changes
◼ Portfolio turnover typically 25% to 35%
◼ Position review research report written for any of the
following conditions:
Cash Levels
– Stock price declines 20% or more in a short time period, absent
◼ Typically will not exceed 10% once a portfolio is
a broad market decline
fully invested; review by CIO triggered if over 10%
– Validity deteriorates for one or more of the reasons for purchase
– Credit-quality profile deteriorates
◼ Quality parameters reviewed by the Chief Investment
Officer with the Portfolio Managers
10RISK MANAGEMENT AND PORTFOLIO MONITORING
Risk Management Portfolio Monitoring
Investment Philosophy Risk and Compliance Committee
◼ Focus on “high-quality” companies ◼ Meets quarterly to independently evaluate portfolio risk
◼ Company’s “business risk” is primary risk control factor exposures with findings presented to the Chief
Investment Officer
Portfolio Level Controls
◼ Broad sector diversification
CIO/PM Meetings
◼ Provides a forum for the Chief Investment Officer and
◼ Individual security weights initiated at 1% to 5% of portfolio
the Portfolio Managers to review, discuss, and explain
each strategy’s portfolio positioning and its performance
Position Reviews
◼ “Position Review” report when a portfolio holding declines
Research Meetings
20% absent a broad market decline
◼ Provides a forum to discuss and evaluate portfolio
◼ Re-validate reasons for original purchase or sell position
holdings and overall industry trends
Trading Guidelines Performance Analytics and Portfolio Attribution
◼ Guidelines provided by Portfolio Managers when entering
◼ Allows Portfolio Managers to quantify investment
and exiting portfolio holdings decisions and understand drivers of return and risk
◼ Relative benchmarks and transaction costs are monitored characteristics
in real time to ensure investments are implemented both
efficiently and effectively
11HIGH-QUALITY CHARACTERISTICS
NET MARGIN* ROA*
17.60% 14.06%
5.72% 1.25%
4.68%
-2.41%
Percentile Rank in Category (%) 1 1
ROE* ROIC*
26.07% 23.36%
2.61%
5.79%
2.05%
-5.37%
Percentile Rank in Category (%) 1 1
■ Virtus KAR Small-Cap Core Fund (PKSFX)
■ Russell 2000® Index
■ Combined Morningstar Small Blend, Small Growth, and Small Value Categories
(based on total return; number of funds ranked: Net Margin: 1,750, ROA: 1753, ROE: 1,752, ROIC: 1,751)
Past performance is not indicative of future results. *Trailing 12 months as of 6/30/21.
As of 6/30/21. Class I shares. Source: Morningstar Direct. The Morningstar Percentile Ranking compares a Fund’s Morningstar risk and return scores with all the Funds in the same
Category, where 1% = Best and 100% = Worst. Rankings shown are for the I share. Rankings for other share classes may vary.
The Russell 2000® Index is a market capitalization-weighted index of the 2,000 smallest companies in the Russell Universe, which comprises the 3,000 largest U.S. companies. The
index is calculated on a total return basis with dividends reinvested. The index is unmanaged, its returns do not reflect any fees, expenses, or sales charges, and is not available for
direct investment. Characteristics are defined on page 19. 12CHARACTERISTICS
10 YEARS
Standard Sharpe Upside Downside
Alpha Beta
Deviation % Ratio Capture Ratio Capture Ratio
18.88 18.92
1.00 100.00 100.00
6.40 0.96 95.69 95.57
1.05
83.03
14.31
0.68
57.84
0.62 0.59
0.00
-0.08
Percentile Rank in Category (%)
2 2 2 1 94 2
■ Virtus KAR Small-Cap Core Fund (PKSFX)
■ Russell 2000® Index
■ Combined Morningstar Small Blend, Small Growth, and Small Value Categories
(based on total return; number of funds ranked: 1,029)
Past performance is not indicative of future results.
As of 6/30/21. Class I shares. Source: Morningstar Direct.
The Morningstar Percentile Ranking compares a Fund’s Morningstar risk and return scores with all the Funds in the same Category, where 1% = Best and 100% = Worst. Rankings
shown are for the I share. Rankings for other share classes may vary.
Characteristics are defined on page 19. 13PORTFOLIO CHARACTERISTICS
Virtus KAR Russell
Small-Cap 2000®
Quality Core Fund Index Description**
Return on Equity—Past 5 Years 21.9% 7.5% In a market of average businesses, we seek to own
protected proprietary businesses that have generated
Total Debt/EBITDA 1.0 x 6.4 x
exceptional returns on shareholders’ capital without
Earnings Variability—Past 10 Years 30.5% 82.0% employing significant debt.
Growth
Earnings Per Share Growth—Past 10 Years 13.0% 6.2% In a market of cyclical businesses requiring growth capital
from fickle markets, we seek to own companies that have
Dividend Per Share Growth—Past 10 Years 12.9% 6.1%
produced self-funded strong, consistent growth
Capital Generation—{ROE x (1-Payout)} 15.9% 6.0% sustainable into the future.
Value
P/E Ratio—Trailing 12 Months 27.6 x 101.1 x And we have been able to achieve this high quality and
Free Cash Flow Yield † 4.4% 2.8% strong growth at a discount valuation to the market.
Market Characteristics
$ Weighted Average Market Cap—3 Year Average
$7.7 B $2.6 B
(by Issuer)
Largest Market Cap—3 Year. Average (by Issuer) $16.4 B $11.4 B
Risk Statistics
Annualized Standard Deviation—Since Inception* 16.1% 20.2%
Past performance is no guarantee of future results.
As of 6/30/21.
† Free cash flow data is as of March 31, 2021. Prices are as of June 30, 2021. Excludes financials.
*October 18, 1996. 11/1/96 used for calculation purposes of quarterly data. Gross of fees.
**Description reflects past results and is not an indicator of future performance results. Description is relative to the Fund’s primary benchmark.
Data is obtained from the Frank Russell Company and FactSet and is assumed to be reliable. Other principal consultant firms may use different algorithms to calculate selected
statistics. Estimates are based on certain assumptions and historical information.
Please see page 19 for definitions of characteristics shown. 14SECTOR ALLOCATIONS
Virtus KAR Small-Cap Core Fund (PKSFX)
Russell 2000® Index
43.6%
21.2% 21.1%
14.3% 14.9%
13.6%
11.2% 11.9%
9.0%
6.9%
5.1% 4.9%
3.7% 4.3% 3.8%
3.2%
2.2% 2.4%
1.5% 1.4%
0.0% 0.0%
Industrials Financials Information Communication Health Consumer Consumer Energy Materials Real Estate Utilities
Technology Services Care Discretionary Staples
As of 6/30/21. Sector allocations are subject to change. The sector information represented above is based on Russell sector classifications.
15TOP HOLDINGS
Top Ten Holdings Sector % of Portfolio
FTI Consulting Inc. Industrials 5.7
EMCOR Group Inc Industrials 5.3
Rightmove PLC Communication Services 5.2
Teledyne Technologies Inc. Industrials 4.9
Primerica Inc. Financials 4.8
Manhattan Associates Inc. Information Technology 4.8
Acushnet Holdings Corp. Consumer Discretionary 4.7
Simpson Manufacturing Co. Inc. Industrials 4.6
First Hawaiian Inc. Financials 4.5
Graco Inc. Industrials 4.5
Total 48.9
Virtus KAR
Small-Cap Russell 2000®
Core Fund Index
Number of Holdings 27 1,985
Average Position Size (%) 3.7 0.1
Weight of Top 10 Holdings (%) 48.9 3.1
Active Share (%) 98.7 —
As of 6/30/21.
Source: Virtus Performance and Analytics.
Holdings and weightings are subject to change. The sector information represented above is based on Russell sector classifications.
16PERFORMANCE REVIEW
JUNE 30, 2021 (%)
MORNINGSTAR RATINGSTM
PKSFX Index Mid-Cap
62.03 I Share Growth
Time Period # of Stars # of Funds
Overall ★★★★ 546
3 Year ★★★ 546
38.78 5 Year ★★★★ 489
10 Year ★★★★★ 379
Morningstar ratings are based on risk-adjusted returns as of June 30, 2021.
22.24 Strong ratings are not indicative of positive fund performance.
17.54 18.50
16.47 15.71
13.52 12.34
10.67 11.43 The Morningstar RatingTM for funds, or “star rating”, is calculated for
9.40
managed products (including mutual funds, variable annuity and variable life
3.73 4.29 subaccounts, exchange-traded funds, closed-end funds, and separate
accounts) with at least a three-year history. Exchange-traded funds and
open-ended mutual funds are considered a single population for comparative
purposes. It is calculated based on a Morningstar Risk-Adjusted Return
QTD YTD 1 Year 3 Year 5 Year 10 Year Since measure that accounts for variation in a managed product’s monthly excess
Inception* performance, placing more emphasis on downward variations and rewarding
*Inception: Class I: 10/18/96. consistent performance. The top 10% of products in each product category
Performance data quoted represents past performance. Past performance does not receive 5 stars, the next 22.5% receive 4 stars, the next 35% receive 3 stars,
the next 22.5% receive 2 stars, and the bottom 10% receive 1 star. The
guarantee future results. Investment return and principal value will fluctuate so that
Overall Morningstar Rating for a managed product is derived from a weighted
shares, when redeemed, may be worth more or less than their original cost. Current average of the performance figures associated with its three-, five-, and 10-
performance may be lower or higher than the performance data quoted. Please visit year (if applicable) Morningstar Rating metrics. The weights are: 100% three-
virtus.com for performance data current to the most recent month end. This share year rating for 36-59 months of total returns, 60% five-year rating/40% three-
class has no sales charges and is not available to all investors. Other share classes year rating for 60-119 months of total returns, and 50% 10-year rating/30%
have sales charges. See virtus.com for details. five-year rating/20% three-year rating for 120 or more months of total returns.
While the 10-year overall star rating formula seems to give the most weight to
Class I: The fund class gross expense ratio is 1.00%. the 10-year period, the most recent three-year period actually has the
greatest impact because it is included in all three rating periods. Ratings do
Average annual total return is the annual compound return for the indicated period and reflects the
not take into account the effects of sales charges and loads.
change in share price and the reinvestment of all dividends and capital gains. Returns for periods of one
year or less are cumulative returns. © 2021 Morningstar, Inc. All rights reserved. The information contained herein:
(1) is proprietary to Morningstar and/or its content providers; (2) may not be
Index: The Russell 2000® Index is a market capitalization-weighted index of the 2,000 smallest copied or distributed; and (3) is not warranted to be accurate, complete, or
companies in the Russell Universe, which comprises the 3,000 largest U.S. companies. The index is timely. Neither Morningstar nor its content providers are responsible for any
calculated on a total return basis with dividends reinvested. The index is unmanaged, its returns do not damages or losses arising from any use of this information. Past performance is
reflect any fees, expenses, or sales charges, and is not available for direct investment. no guarantee of future results.
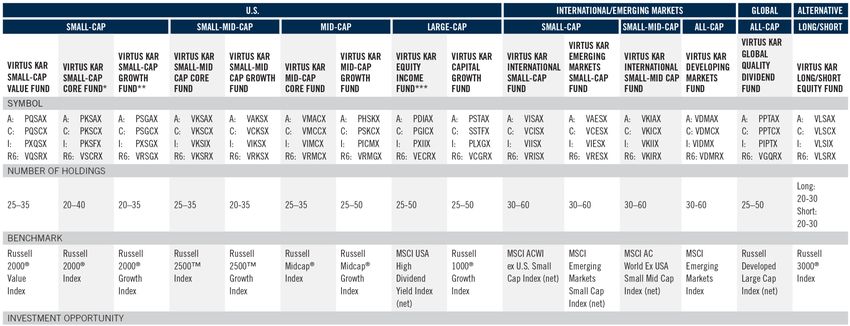
17VIRTUS KAR HIGH-QUALITY EQUITY FUNDS
Quality-Driven Strategies Across Market Caps and Borders
Kayne Anderson Rudnick’s investment philosophy is rooted in quality, with a focus on wealth preservation. Decades of
management experience has yielded a rigorous definition of quality, which guides where the firm invests, across market
caps and geographic regions.
KAR believes that superior risk-adjusted returns can be achieved by investing in high-quality companies with market dominance, excellent management, financial strength, and consistent
growth, purchased at reasonable prices.
For more information about Kayne Anderson Rudnick’s high-conviction, high-quality equity strategies,
visit virtus.com or call 800-243-4361.
*Effective July 31, 2018, this Fund is closed to new investors. Please see the prospectus for exceptions. **Effective September 28, 2018, this Fund is closed to new investors. Please see the
prospectus for exceptions. ***Effective September 1, 2020, the Fund changed its name from Virtus Rampart Enhanced Core Equity Fund to Virtus KAR Equity Income Fund. The Fund’s
portfolio managers, principal investment strategies, and certain principal risks have been revised. Please see the prospectus for more information.
18DEFINITIONS
QUALITY MARKET CHARACTERISTICS
Return on Equity - Past 5 Years—relates how well the company is using the money $ Weighted Average Market Cap - 3 Year Average—is the average of the market
invested in it so that it can bring a return to its investors. A high portfolio ROE indicates capitalizations (price times the number of common shares outstanding) of the companies
that the portfolio is invested in historically profitable companies. in the portfolio weighted by the size of each company’s position within the portfolio.
Total Debt/EBITDA—is calculated by dividing total debt by earnings before interest, Largest Market Cap - 3 Year Average—provides information about the range of the
taxes, depreciation, and amortization. It is a measure of a company’s ability to pay off its market capitalization held in the portfolio.
incurred debt.
Active Share – A measure of the percentage of stock holdings in a manager’s portfolio
Earnings Variability - Past 10 Years—measures the volatility of the annual earnings per that differ from the benchmark index.
share over the past 10 years. On a portfolio level, a high EPS variability means the
portfolio is heavily invested in companies with volatile earnings. Unlike earnings growth, Alpha – A measure of performance on a risk-adjusted basis.
this statistic looks at the companies’ earnings patterns. Newer companies and smaller Beta – A quantitative measure of the volatility of a given portfolio relative to the overall
companies tend to have highly variable earnings. market. Higher beta suggests higher volatility. Beta can also refer to relative volatility to a
portfolio’s stated benchmark.
GROWTH
Up/Down Capture Ratio – A measure of how well a manager was able to replicate or
Earnings/Share Growth—indicates the earnings available to each common share. improve on phases of positive benchmark returns and how badly the manager was
Earnings/share growth is the growth rate of these earnings per share. On a portfolio level, impacted by phases of negative benchmark returns.
this statistic measures the trailing earnings per share growth of a portfolio’s holdings.
Net Margin – The ratio of net profits to revenues for a company or business segment that
Dividend/Share Growth—on a portfolio level, this statistic measures the trailing shows how much of each dollar earned by the company is translated into profits.
dividends/share growth of a portfolio’s holdings.
ROA (Return on Assets) – An indicator of how profitable a company is relative to its total
Cap. Generation - {ROE x (1-Payout)}—indicates how quickly the firm can grow without assets. ROA gives an idea as to how efficient management is at using its assets to
changing its financing and dividend policies. The retention ratio is calculated as one generate earnings.
minus the dividend payout ratio. Capital generation illustrates the importance of
profitability (return on equity) and the firm’s dividend policy on the company’s growth. ROE (Return on Equity) – The amount of net income returned as a percentage of
shareholders’ equity. Return on equity measures a corporation’s profitability by revealing
how much profit a company generates with the money shareholders have invested.
VALUE
ROIC (Return on Invested Capital) – A calculation used to assess a company’s
P/E Ratio - Trailing 12 Months—The P/E (price-earnings) ratio is calculated by dividing efficiency at allocating the capital under its control to profitable investments. The return on
the company’s stock price divided by its earnings per share times 100. The higher the P/E invested capital measure gives a sense of how well a company is using its money to
ratio, the more an investor pays for the company’s earnings. A low P/E generally indicates generate returns.
a better value, while a high P/E denotes an expensive stock with earnings that investors
expect will grow rapidly. A negative P/E is generally indicative of companies with losses or Sharpe Ratio – A statistic that measures the efficiency, or excess return per unit of risk,
negative earnings. of a manager’s returns. The greater the Sharpe Ratio, the better the portfolio’s risk
adjusted return.
Free Cash Flow Yield—An overall return evaluation ratio of a stock, which standardizes
the free cash flow per share a company is expected to earn against its market price per Standard Deviation – Measures variability of returns around the average return for an
share. Free cash flow yield is similar in nature to the earnings yield metric, which is investment portfolio. Higher standard deviation suggests greater risk.
usually meant to measure GAAP earnings per share divided by share price. Generally, RISK CHARACTERISTICS
the lower the ratio, the less attractive the investment is and vice versa. The logic behind
this is that investors would like to pay as little price as possible for as many earnings as Annualized Standard Deviation - Since Inception—is a statistical measure of the
possible. Some investors regard free cash flow (which takes into account capital dispersion about an average over a certain period and measures the volatility (risk) of a
expenditures and other ongoing costs a business incurs to keep itself running) as a more portfolio’s returns.
accurate representation of the returns shareholders receive from owning a business, and
thus prefer to free cash flow yield as a valuation metric over earnings yield.
19INDEX DEFINITIONS
The Russell 2000® Value Index is a market capitalization-weighted index of value- The MSCI ACWI ex U.S. Small Cap Index (net) is a free float-adjusted market
oriented stocks of the smallest 2,000 companies in the Russell Universe, which capitalization-weighted index that measures small cap equity performance of developed
comprises the 3,000 largest U.S. companies. The index is calculated on a total return and emerging markets, excluding the U.S. The index is calculated on a total return basis
basis with dividends reinvested. with net dividends reinvested.
The Russell 2000® Index is a market capitalization-weighted index of the 2,000 smallest The MSCI Emerging Markets Small Cap Index (net) is a free float-adjusted market
companies in the Russell Universe, which comprises the 3,000 largest U.S. companies. capitalization-weighted index designed to measure small cap equity market performance
The index is calculated on a total return basis with dividends reinvested. in the global emerging markets. The index is calculated on a total return basis with net
dividends reinvested.
The Russell 2000® Growth Index is a market capitalization-weighted index of growth-
oriented stocks of the smallest 2,000 companies in the Russell Universe, which The MSCI AC World Ex USA Small Mid Cap Index (net) is a free float-adjusted market
comprises the 3,000 largest U.S. companies. The index is calculated on a total return capitalization-weighted index that measures mid- and small-cap performance across 22
basis with dividends reinvested. of 23 Developed Market countries (excluding the U.S.) and 24 Emerging Markets
countries. The index is calculated on a total return basis with net dividends reinvested.
The Russell 2500™ Index is a market capitalization-weighted index of the 2,500 smallest
companies in the Russell Universe, which comprises the 3,000 largest U.S. companies. The MSCI Emerging Markets Index is a free float-adjusted market capitalization-
The index is calculated on a total return basis with dividends reinvested. weighted index designed to measure equity market performance in the global emerging
markets. The index is calculated on a total return basis with gross dividends reinvested.
The Russell 2500™ Growth Index is a market capitalization-weighted index of growth-
oriented stocks of the 2,500 smallest companies in the Russell Universe, which The Russell Developed Large Cap Index is a free-float market capitalization-weighted
comprises the 3,000 largest U.S. companies. The index is calculated on a total return index constructed to provide a comprehensive and unbiased barometer for the large-cap
basis with dividends reinvested. segment in the developed world, calculated on a total return basis with net dividends
reinvested.
The Russell Midcap® Index is a market capitalization-weighted index of medium-
capitalization stocks of U.S. companies. The index is calculated on a total return basis The Russell 3000® Index is a market capitalization- weighted index that measures the
with dividends reinvested. performance of the 3,000 largest U.S. companies. The index is calculated on a total
return basis with dividends reinvested. The indexes are unmanaged, their returns do not
The Russell Midcap® Growth Index is a market capitalization-weighted index of reflect any fees, expenses, or sales charges, and they are not available for direct
medium-capitalization, growth-oriented stocks of U.S. companies. The index is investment.
calculated on a total return basis with dividends reinvested. The Russell 1000® Growth
Index is a market capitalization- weighted index of growth-oriented stocks of the 1,000
largest companies in the Russell Universe, which comprises the 3,000 largest U.S.
companies. The index is calculated on a total return basis with dividends reinvested.
The MSCI USA High Dividend Yield Index is based on the MSCI USA Index, its parent
index, and includes large and mid cap stocks. The index is designed to reflect the
performance of equities in the parent index (excluding REITs) with higher dividend
income and quality characteristics than average dividend yields that are both
sustainable and persistent. The index also applies quality screens and reviews 12-month
past performance to omit stocks with potentially deteriorating fundamentals that could
force them to cut or reduce dividends. The index is calculated on a total return basis
with net dividends reinvested.
20Virtus (NASDAQ: VRTS) is a distinctive partnership of boutique investment managers,
singularly committed to the long-term success of individual and institutional investors.
◼ We are not constrained by a single investment approach; rather, we provide access to independent,
specialized investment philosophies through our multi-discipline, multi-strategy approach.
◼ We have the flexibility, agility, and responsiveness of a boutique asset management firm with similar product
breadth and investment talent of our larger peers.
◼ We are committed to thoughtfully providing investment solutions, adhering to the highest standards of
product quality, operational excellence, and fiduciary responsibility.
Please consider a Fund’s investment objectives, risks, charges, and expenses carefully before investing. For this
and other information about any Virtus Fund, contact your financial professional, call 800-243-4361, or visit
virtus.com for a prospectus or summary prospectus. Read it carefully before investing.
Not all products or marketing materials are available at all firms.
Not insured by FDIC/NCUSIF or any federal government agency. No bank guarantee. Not a deposit. May lose value.
Mutual Funds distributed by VP Distributors, LLC member FINRA and subsidiary of Virtus Investment Partners, Inc.
3390 07-21 © 2021 Virtus Mutual FundsYou can also read