A Modularized and Scalable Multi-Agent Reinforcement Learning-based System for Financial Portfolio Management
←
→
Page content transcription
If your browser does not render page correctly, please read the page content below
A Modularized and Scalable Multi-Agent Reinforcement Learning-based System
                                                                for Financial Portfolio Management

                                                                                  Zhenhan Huang , Fumihide Tanaka∗ ,
                                                                                   University of Tsukuba, Tsukuba, Japan
                                                                            huang@ftl.iit.tsukuba.ac.jp, fumihide.tanaka@gmail.com
arXiv:2102.03502v2 [q-fin.PM] 9 Feb 2021

                                                                          Abstract                            By the resemblance of nature of the problem, researchers un-
                                                                                                              surprisingly want to adapt the Reinforcement Learning (RL)
                                                   Financial Portfolio Management is one of the               framework to portfolio management, and with the incorpo-
                                                   most applicable problems in Reinforcement Learn-           ration of Deep Learning (DL), they have built robust and
                                                   ing (RL) by its sequential decision-making na-             valid Deep RL-based methods [Jiang et al., 2017] [Ye et al.,
                                                   ture. Existing RL-based approaches, while inspir-          2020] [Liang et al., 2018]. Akin to receiving information
                                                   ing, often lack scalability, reusability, or profundity    from various sources as portfolio managers will do, existing
                                                   of intake information to accommodate the ever-             approaches incorporate heterogeneous data [Ye et al., 2020].
                                                   changing capital markets. In this paper, we de-            Researchers also propose Multi-agent Reinforcement Learn-
                                                   sign and develop MSPM, a novel Multi-agent Re-             ing (MARL) approaches [López et al., 2010] [Sycara et al.,
                                                   inforcement learning-based system with a modu-             1995] [Lee et al., 2020]. In [Lee et al., 2020], the authors
                                                   larized and scalable architecture for portfolio man-       design a system including a group of Deep Q-Network [Mnih
                                                   agement. MSPM involves two asynchronously up-              et al., 2013] based agents as the resemblance of independent
                                                   dated units: Evolving Agent Module (EAM) and               investors to make investment decisions, and end up with a
                                                   Strategic Agent Module (SAM). A self-sustained             diversified portfolio. However, while inspiring, these cutting-
                                                   EAM produces signal-comprised information for a            edge approaches lack scalability, reusability, or profundity of
                                                   specific asset using heterogeneous data inputs, and        intake information to accommodate the ever-changing mar-
                                                   each EAM possesses its reusability to have connec-         kets. For example, SARL [Ye et al., 2020] as a general
                                                   tions to multiple SAMs. A SAM is responsible for           framework, the encoder’s intake is either financial news data
                                                   the assets reallocation of a portfolio using profound      for embedding or stock prices for trading signals generation,
                                                   information from the EAMs connected. With the              and the lack of scalability prevents the encoder from effi-
                                                   elaborate architecture and the multi-step conden-          ciently producing holistic information and eventually limit
                                                   sation of the volatile market information, MSPM            the RL-based agents to learning. Additionally, agents in ex-
                                                   aims to provide a customizable, stable, and ded-           isting multi-agent based systems are mostly ad-hoc and rarely
                                                   icated solution to portfolio management that ex-           reusable. As one of the first tries, MAPS [Lee et al., 2020] is
                                                   isting approaches do not. We also tackle data-             a reinforcement-learning implementation of Ensemble Learn-
                                                   shortage issue of newly-listed stocks by transfer          ing [Rokach, 2010] by its very nature, an implicit solution
                                                   learning, and validate the necessity of EAM. Ex-           with stacking multiple Deep Q-Network agents, which can be
                                                   periments on 8-year U.S. stock markets data prove          as reliable as explicit solutions implementing policy gradient
                                                   the effectiveness of MSPM in profits accumulation          methods [Jiang et al., 2017].
                                                   by its outperformance over existing benchmarks.
                                                                                                                 In this paper, we design and develop MSPM, a novel Multi-
                                                                                                              agent Reinforcement learning-based system with a modu-
                                                                                                              larized and scalable architecture for portfolio management.
                                           1       Introduction                                               In MSPM, assets are vital and organic building blocks.
                                           Portfolio management is a continuous process of reallocating       This vitalness is reflected in that each asset has its exclu-
                                           capital into multiple assets [Markowitz, 1952], and it aims        sive module which takes heterogeneous data and utilizes
                                           to maximize accumulated profits with an option to minimize         a Deep Q-Network (DQN) based agent to produce signal-
                                           the overall risks of the portfolio. To perform such a practice,    comprised information. This module, as a dedicated system,
                                           portfolio managers who focus on stock markets convention-          is called Evolving Agent Module (EAM). Once we have set
                                           ally read financial statements and balance sheets, pay atten-      up and trained the EAMs corresponding to the the assets in
                                           tion to news from media and announcements from financial           a portfolio, we connect them to a decisive system: Strate-
                                           institutions like central banks, and analyze stock price trends.   gic Agent Module (SAM), a Proximal Policy Optimization
                                                                                                              (PPO) [Schulman et al., 2017] based agent. A SAM rep-
                                               ∗
                                                   Corresponding Author                                       resents a portfolio and uses the profound information from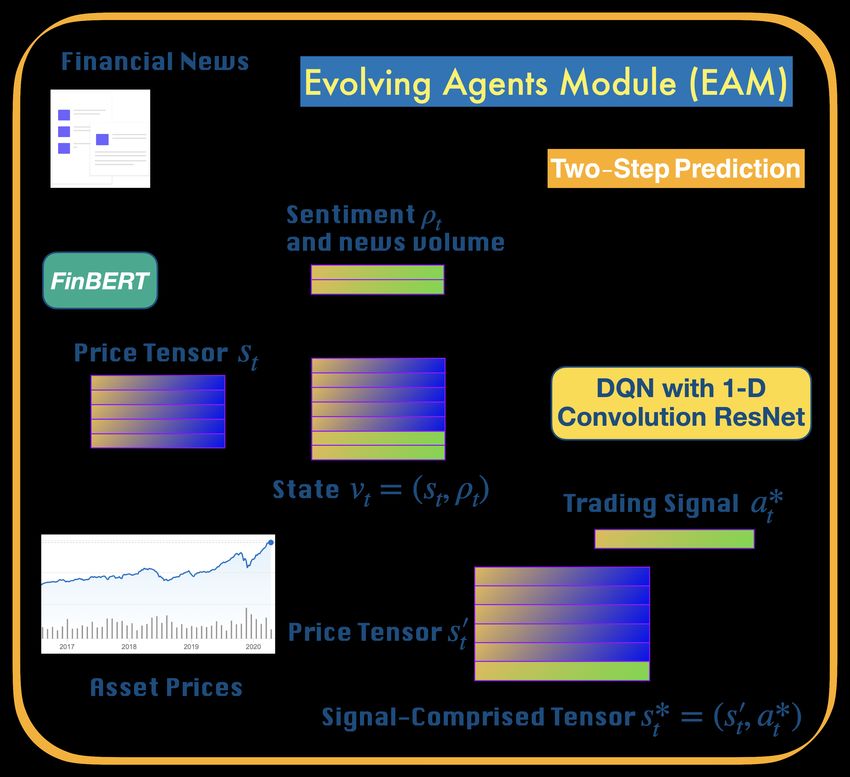
the EAMs connected for assets reallocation. EAM and SAM
are asynchronously updated, and EAM possesses its reusabil-
ity which mean an EAM can connect to multiple SAMs and
these connections can be arbitrary. With the power of parallel
computing, we are able to perform the capital reallocation for
various portfolios at scale simultaneously. By experiment and
comparison, we confirm the necessity of the Evolving Agent
Module (EAM) and validate MSPM’s outperformance over
the classical trading strategies in terms of both accumulated
portfolio value and Sortino Ratio. Our contribution can be
listed as follows:
• To our knowledge, MSPM is the first approach to for-
malize a modularized and scalable multi-agent rein-
forcement learning system using signal-comprised infor-
mation for financial portfolio management.
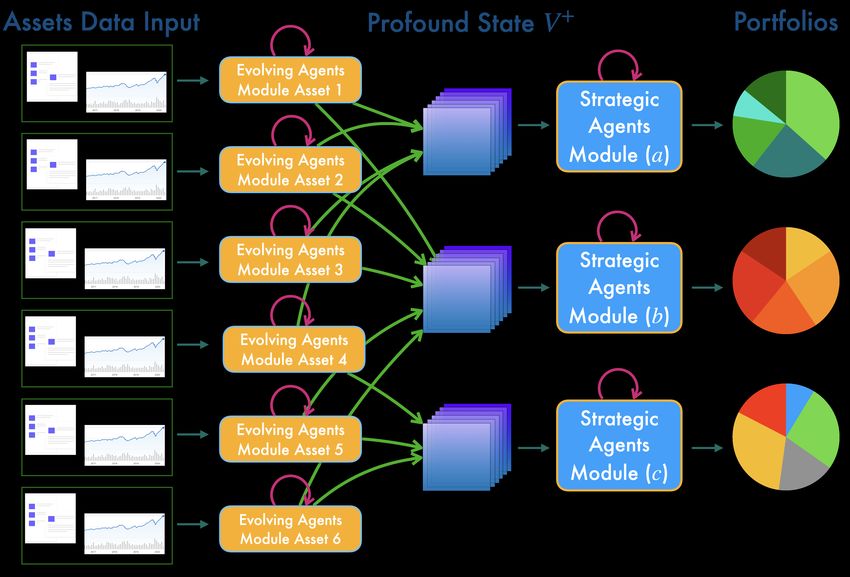
• We tackle data-shortage issue of newly-listed stocks by Figure 1: This figure illustrates the surjection relationship between
transfer learning for RL-based systems, and revise EIIE- EAMs and SAMs better. Each Evolving Agent Module (EAM)
style neural network architecture to better accommodate is responsible for a single asset, and involves a DQN agent and
Actor-Critic methods. FinBERT model with utilization of heterogeneous data to produce
signal-comprised information. Each Strategic Agent Module (SAM)
• We validate MSPM’s outperformance by at least 100% is a module for a portfolio, involves a PPO agent, and reallocates the
and 343% higher than the benchmarks in terms of accu- assets with stacked signal-comprised 3-D tensor Profound State V +
mulated rate of return, under extreme market conditions from the EAMs connected. Moreover, trained EAMs are reusable
of U.S. stock markets from March to December 2020 for different portfolios and combined at will. By parallel comput-
during the global pandemic. ing, capital reallocation may be performed for various portfolios at
scale simultaneously.
2 Problem Setting
To address portfolio management problem, we first assume 3.2 State
a composition of the minimal-viable market information: 1.
The state, which agent in EAM observes at any given peri-
historical prices from U.S. stock markets and 2. asset-related
odic (daily) time-step t, is a 2-D tensor vt stacked by the re-
news from media, as the environment with which agents in
cent n-day historical prices st and the 1-D tensor of sentiment
Evolving Agent Modules (EAMs) interact. Then, the com-
polarities of designated asset ρt . Specifically,
bination of the signal-comprised information which EAMs
generates become the state that decisive agents in SAMs ob- vt = (st , ρt ) (1)
serve. SAMs consequently reallocate assets in the portfolios.
where sentiment polarities ρ, which range continuously from
Each EAM is reusable, which means we may connect it to
-1.0 to 1.0 to indicate bearishness (-1.0) or bullishness (1.0),
any portfolios/SAMs once set up and trained, and a SAM is
are classified using pre-trained FinBERT classifier [Araci,
connected with at least one EAM. The relationship between
2019] [Devlin et al., 2019] with asset-related financial news,
EAMs and SAMs is illustrated in Figure 1. EAM is retrained
and then averaged. Furthermore, we not only feed agent the
periodically using the latest information from the market, me-
news sentiments but also comprise news volumes which is
dia, financial institutions, etc, but in this paper we will imple-
the number of news items used for generating sentiment po-
ment only the former two sources of data, and we leave rest
larities of each asset. This method is trying to alleviate the
sources of input as an open question for study in the future.
unbalanced-news issue the existing research has [Ye et al.,
For next sections, we will introduce details about EAM and
2020].
SAM.
3.3 Deep Q-Network
3 Evolving Agent Module (EAM) We train a Deep Q-Network (DQN) agent [Mnih et al., 2013]
In the following sections, we introduce the details about for the sequential decision-making in Evolving Agent Mod-
EAM, and Figure 2 provides an overview of the EAM’s ar- ule. In Deep Q-Learning, the agent acts based on the state-
chitecture. value function P∞
3.1 Data Source Qθ (st , at ) = Eπθ [ k=0 γ k rt+k+1 | st = s, at = a]
which we use a Residual Network with 1-D Convolution
An Evolving Agent Module (EAM) has two data sources: 1. to represent.
asset’s historical prices, and 2. asset-related financial news.
The historical prices used for training EAMs are fetched us- DQN Extensions
ing Quandl’s End-Of-Day-Data through Quandl’s API. The We also implement three extensions of the original DQN [La-
financial news data of each asset are from news websites (e.g. pan, 2018], which are dueling architecture [Wang et al.,
finance.yahoo.com) and social media (e.g. twitter.com) on a 2016], Double DQN [Hasselt et al., 2016] and two-step Bell-
daily basis. man unrolling.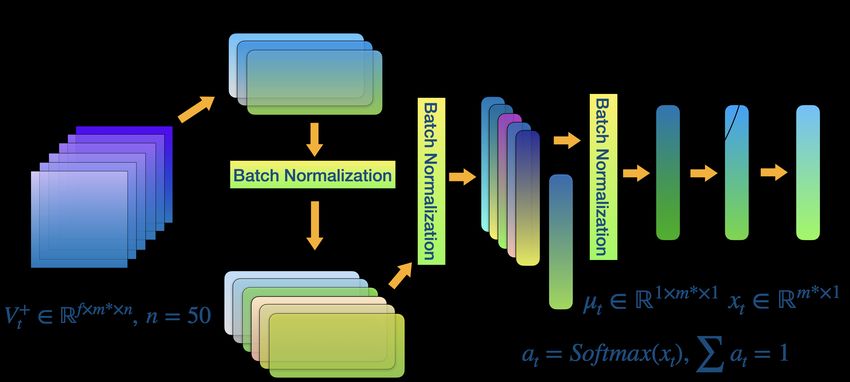
Transfer Learning
Instead of training every EAM from scratch, we initially train
a Foundational EAM, using historical prices of AAPL (Ap-
ple Inc.) and then train all other EAMs based on this pre-
trained EAM. By doing so, the EAMs would have a prior pat-
tern recognition of stock trends, and this approach also tack-
les the data-shortage issue of newly-listed stocks.
3.4 Action
The DQN agent in EAM acts to trade the designated asset
with an action of either buying, selling, or skipping at every
time step t. The choice of an action, at = {buying, closing,
or skipping}, is called asset trading signal. As indicated in
the actions, there is no short (selling) position, but only long
(buying) position, and a new position can be opened only after
an existing position has been closed.
3.5 Reward Function
The reward rt (st , ιt ) agent receives at each time-step t is:
Figure 2: An EAM is a module for a designated asset. Each Evolv-
100(Pt (close)
vt ing Agent Module (EAM) takes two types of heterogeneous data:
i=tι (close) − 1 − β), if ιt 1. designated asset’s historical prices, and 2. asset-related financial
rt (st , ιt ) = vt−1 (2) news. At the center of EAM is an extended DQN agent using a 1-D
0, if not ι
t Convolution ResNet for the sequential decision-making. Instead of
training every EAM from scratch, we train EAMs by transfer learn-
(close) ing using Foundational EAM. At every time step t, the DQN agent
where vt is the close price of the given asset at time
step t, tl is the time step when a long position was opened in EAM observes state vt of historical prices st and news sentiments
ρt of designated asset, and acts to trade with an action a∗t of either
and commissions were deducted, β stands for the commission
buying, selling, or skipping, and eventually generates a 2-D signal-
of 0.002 and ιt is the indicator of opening position (i.e., an comprised tensor s∗t using new prices s0t and signals a∗t .
position is still open).
3.6 Signal-Comprised Tensor 4.3 Proximal Policy Optimization
As illustrated in Figure 2, after the EAMs are trained, we It is a Proximal Policy Optimization (PPO) [Schulman et al.,
feed new historical prices s0t and financial news of the desig- 2017] agent at the center of SAM to perform reallocation of
nated assets to generate predictive trading signals a∗t . Then assets . PPO is a actor-critic style policy gradient method, and
we stack the same new historical prices to a∗t to formalize has been widely used on continuous action space problems
a 2-D signal-comprised tensor s∗t as the data source to train because of its balance between good performance and ease
SAM. of implementation. A policy πθ is a parametrized mapping:
S × A → [0, 1] from state space to action space. Among
4 Strategic Agent Module (SAM) the different objective functions of PPO, we implement the
Clipped Surrogate Objective [Schulman et al., 2017]:
We introduce the detailed facts about SAM in the next sec-
0 0
tions. Figure 3 provides an overview of the EAM’s architec- L(θ) = Êπθ0 [min(rt (θ)Aθt , clip(rt (θ), 1 − , 1 + )Aθt )]
ture. (3)
where
4.1 Data Source πθ (at |st )
rt (θ) =
SAM is dependent on EAMs it is connected with as its data πθ0 (at |st )
source is a combination of the signal-comprised information 0
from these EAMs. and Aθt is the advantage function is expressed as:
0 0 0
4.2 State Aθt = Qθ (st , at ) − V θ (st )
The 2-D signal-comprised tensors from the EAMs connected 0
will be stacked and transformed into a 3-D signal-comprised where the state-action value function Qθ (st , at ) is:
tensor called Profound State vt+ which is the state SAM ob- ∞
0
serves at each time-step t. Figure 4 shows the abstract of the
X
Qθ (st , at ) = Eπθ0 [ γ k rt+k+1 | st = s, at = a]
profound state vt+ . k=0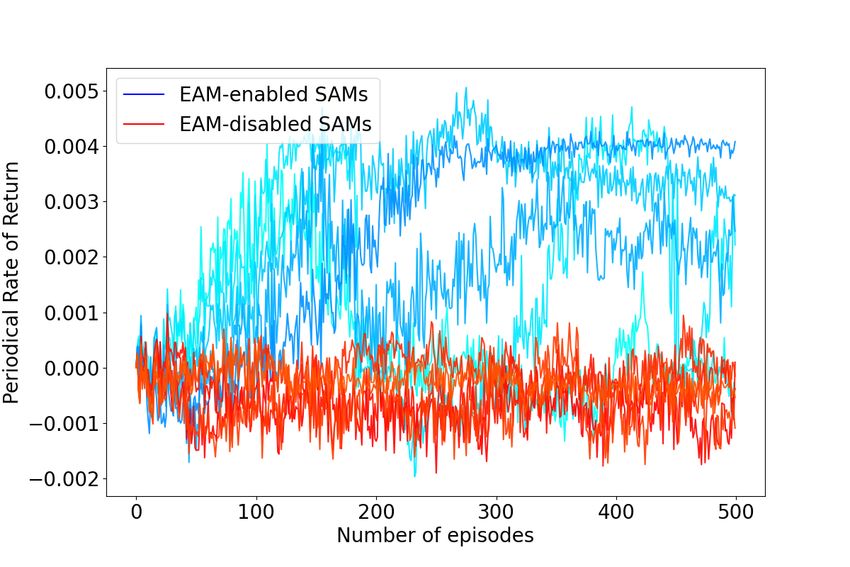
Figure 5: The policy network (θ0 ) of Strategic Agent Module to ac-
                                                                                                                  ∗
                                                                    commodate PPO algorithm. After xt ∈ Rm ×1 are sampled from
                                                                    the normal distributions N (µt , σ), we calculate log probability of
                                                                    xt and the get reallocation weights at = Sof tmax(xt ). ReLu acti-
                                                                    vation function is set after every convolutional layer, except the last
                                                                    one. f is the number of features, m∗ is the number of assets in the
                                                                    portfolio, and n = 50 is the fixed rolling-window length.

Figure 3: A SAM is a module for a portfolio. Each SAM takes the
signal-comprised 3-D tensor which is stacked and transformed from
2-D tensors from EAMs connected with, and then SAM generates
the reallocation weights for the assets in the portfolio.
                                                                    Figure 6: Allocation weights transform due to the assets’ prices fluc-
                                                                    tuation.

                                                                    4.4    Action
                                                                    The action the PPO agent takes at each time step t is
Figure 4: The input of Strategic Agent Module, Profound State
               ∗
Vt+ ∈ Rf ×m ×n , is a 3-D tensor, where f is the number of fea-                         at = (a0,t , a1,t , ..., an,t )T                     (4)
       ∗
ture, m = m + 1 is the number of assets m in the portfolio plus        which is Pthe vector of reallocating weights at each time-
cash and n is the fixed rolling-window length.                                      n
                                                                    step t, and i=0 ai,t = 1. Figure 6 shows the details of
                                                                    prices of fluctuation.
                           0
and the value function V θ (st ) is:                                   After the assets are reallocated by at , the allocation
                                                                    weights of the portfolio eventually becomes
                                ∞
              0                 X                                                                       yt at
           V θ (st ) = Eπθ0 [        γ k rt+k+1 | st = s]                                       wt =                                         (5)
                               k=0
                                                                                                         yt · at

   For the PPO agent, we design a policy network architecture          at the end of time step t due to the price fluctuation during
targeting the uniqueness of continuous action space in finan-       the time step period, where
cial portfolio management problems inspired by follow the                           +(close)            +(close)             +(close)
Ensemble of Identical Independent Evaluators (EIIE) topol-                        vt                   v1,t                 vm,t
                                                                           yt =    +(close)
                                                                                               = (1,    +(close)
                                                                                                                   , ...,    +(close)
                                                                                                                                        )T   (6)
ogy [Jiang et al., 2017]. Since assets’ reallocation weights at                   vt−1                 v1,t−1               vm,t−1
at time-step t is strictly required to be summed to 1.0, we set
                                                          ∗
from m∗ normal distributions N1 (µ1t , σ), ..., Nm (µm  t   , σ),     is the relative price vector, namely the asset price changes
                                           ∗                                                                               +(close)
where m∗ = m + 1 and µt ∈ R1×m ×1 is the linear out-                over time, involving prices of assets and cash. vi,t
put of the last layer the neural network and with standard          denotes the closing price of the i-th asset at time t, where
deviation σ = 0, and we sample from these distributions             i = {1, ..., m} and m is the number of assets in the portfolio.
              ∗
for xt ∈ Rm ×1 . We eventually can obtain the reallocation
weights at = Sof tmax(xt ) and the log probability of xt for        4.5    Reward Function
the PPO agent to learn.                                             Risk-adjusted Periodic Rate of Return
   Figure 5 shows details of the Policy Network (Actor),            The Risk-adjusted Periodic (daily) Rate of Return is:
namely θ0 , of Strategic Agent Module. Due to the resem-
blance and equivalence, architectures of the Value Network                                                n
(Critic) and Target Policy Network, namely θ, will not be il-
                                                                                                          X
                                                                       rt∗ (st , at ) = ln (at · yt − β         |ai,t − wi,t | − φσt2 )      (7)
lustrated.                                                                                                i=0
Date Range     #Data          2. Accumulated Rate of Return (ARR)
    EAM-Traning           2013-01-01∼2017-12-31             6295           [Ormos and Urbán, 2013] pT /p0 , where pT stands for the
    EAM-Predicting        2018-01-01∼2020-12-31             3780          portfolio value at the terminal time step, p0 is the portfolio
                                                                          value at the initial time step, and
    SAM-Traning           2018-01-18∼2019-12-31             1476
    SAM-Testing           2020-01-01∼2020-12-31              759                                   T           b
                                                                                                  X            Y
                                                                                     pT = p0 exp (   rt ) = p0   βt at · yt           (10)
Table 1: EAM-Training dataset involves the historical prices (st )
                                                                                                      t=1         t=1
and news sentiments (ρt ) of all 5 assets in both portfolios (a) and
(b), and is used to training the AAPL-based Foundational EAM and
                                                                          3. Sortino Ratio (SR)
then transfer learning for other 4 assets. EAM-Predicting dataset in-
volves new historical prices (s0t ) and news sentiments (ρ∗t ) for EAMs   Sortino Ratio [Sortino and Price, 1994] is often referred to
generate signal-comprised tensors (s∗t = (s0t , a∗t )) to formalize the   as a risk-adjusted return, which measures the portfolio per-
SAM-Traning (v + ) datasets. SAM-Testing dataset has the same str-        formance compared to a risk-free return after adjusted by the
cuture with the SAM-Training but is solely for back-testing purpose.      portfolio’s downside risk. In our case, Sortino Ratio is calcu-
                                                                          lated:
   where wt represents the allocation weights of the assets at
                                                                                                      PT
the end of time step t [Jiang et al., 2017] [Liang et al., 2018],                                 1
                                                                                                                       − rf
                                                                                                  T     t=1 exp(rt )
and                                                                                       SR =                                        (11)
                                                                                                         σtdownside
                             n
                                                                             where rt is the risk-unadjusted
                             X
                         β         |ai,t − wi,t |                  (8)                       q               peridoic (daily) rate of re-
                                                                                 downside              l
                             i=0                                          turn, σt         = V art (rt − rf ). rf is the risk-free return
   is the transaction cost, where β = 0.0025 is the commis-               and conventionally equals zero, rtl is the return in rt less than
sion rate, with σt2 measuring the volatility of assets’ prices            0, and t = T is the terminal time step.
fluctuation during the last 50 days and φ is the risk discount
which can be fine-tuned as a hyperparameter.
                                                                          6.2   Benchmarks
5     Portfolios                                                          We compare the performance of our MSPM system to the
We propose two portfolios in this paper: Portfolio(a) which               benchmarks which are classical portfolio investment strate-
involves three stocks [AAPL, AMD, GOOGL], and Portfo-                     gies. [Li and Hoi, 2014] [MLFinLab, 2021]
lio(b) which involves another three stocks [GOOGL, NVDA,                     • CRP stands for (Uniform) Constant Rebalanced Port-
TSLA]. To build the Portfolio(a) and Portfolio(b), we train                    folio, and it is about investing an equal proportion of
two SAMs: SAM(a) and SAM(b). It is also worth mention-                         capital to each asset, namely 1/N , which sounds quite
ing that two SAMs will share the same EAM for the stock in                     simple but, in fact, challenging to beat [DeMiguel et al.,
common (GOOGL).                                                                2007].
Datasets
                                                                             • Buy and Hold (BAH) strategy is to invest without rebal-
Stock historical prices are Quandl’s End-Of-Day-Data from                      ance. Once the capital is invested, no further allocation
2013-01-01 to 2020-12-31 fetched using Quandl’s API. We                        will be made.
also implement web news sentiment data (FinSentS) from
Quandl provided by InfoTrie, and on stock AAPL, FinSentS                     • Exponential Gradient Portfolio (EG) strategy is to in-
and news sentiments generated by FinBERT are close. Due                        vest capital into the latest stock with the best perfor-
to the restriction of APIs and limitation of web scraping, the                 mance and use a regularization term to keep the portfolio
news sentiments data utilized for the EAMs in the following                    information.
experiments are majorly relied on FinSentS.
                                                                             • Follow the Regularized Leader (FTRL) strategy
                                                                               tracks the Best Constant Rebalanced Portfolio until the
6     Results and Discussion                                                   previous period with an additional regularization term.
6.1    Performance Metrics                                                     Follow the Regularized Leader strategy reweights based
Except for daily rate of return, two performance metrics are                   on the entire history of the data with an expectation to
also compared:                                                                 have had the maximum returns.
1. Daily Rate of Return (DRR)
                            T
                                                                          6.3   Experimental Results
                         1X
                   rT =        exp(rt ),                           (9)    We set initial portfolio value as p0 = 10, 000. The testing
                         T t=1
                                                                          data of past 50-day Profound State v + from 2020-03-03 to
   where T is the terminal time step, and rt is the risk-                 2020-12-31. As shown in the Figure 7 and Figure 8 EAM-
unadjusted peridoic (daily) rate of return obtained every time            enabled SAMs by at least 100% and 343% higher than the
step.                                                                     benchmarks in terms of ARR for both portfolios.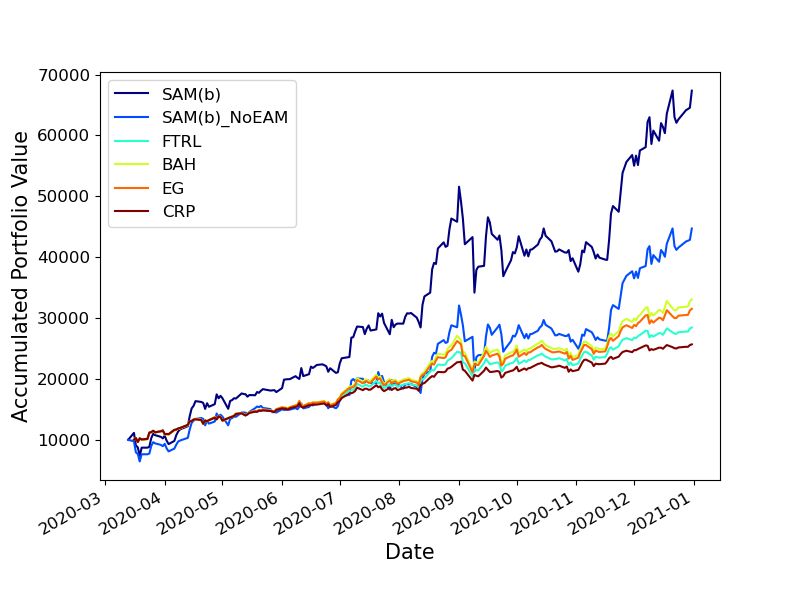
Figure 9: According to the learning curves, EAM-enabled SAMs
Figure 7: SAM(a) outperforms all benchmarks on Portfolio(a) in   always learn better than EAM-disabled SAMs, which validates
Back-testing in terms of accumulated portfolio value.            EAM’s indispensability in our MSPM system.

                                                                    Portfolios (a) & (b)          DRR%       ARR%     SR
                                                                    1. CRP                           0.29     75.90   4.41
                                                                                                     0.49    156.81   5.81
                                                                    2. Buy and Hold                  0.31     80.18   4.29
                                                                                                     0.63    230.57   5.75
                                                                    3. FTRL                          0.30     77.95   4.14
                                                                                                     0.55    184.47   5.65
                                                                    4. EG                            0.31     79.47   4.19
                                                                                                     0.61    215.17   5.69
                                                                    5. MSPM-SAM                      0.57    180.66   4.62
                                                                                                     1.09    573.58   5.31
                                                                    6. MSPM-SAM-NoEAM                0.29     69.74   3.04
                                                                                                     0.87    347.08   4.24
                                                                    Best Performed                MSPM       MSPM     -
Figure 8: SAM(b) outperforms all benchmarks on Portfolio(b) in                    Table 2: Back-testing Results
Back-testing in terms of accumulated portfolio value.

                                                                 to financial portfolio management. We prove that MSPM is
Validation of EAM                                                qualified as a stepping stone to inspire more creative system
Since EAMs provide the trading signal-comprised informa-         designs of financial portfolio management by its novelty and
tion to SAMs, we want to verify EAM’s indispensability           outperformance over the existing benchmarks. Moreover, we
by comparing the system performance with and without the         confirm the necessity of Evolving Agent Module, a essential
EAMs. It is clearly shown in both Figure 7 and Figure 8 that     component of the system.
the EAM-disabled SAMs, which have hyperparameters with
EAM-enabled SAMs, perform poorer. Moreover, we train
a set of SAMs for 500 episodes with learning rates of 1e-
                                                                 References
3 and 1e-4, risk discount of 0.05, and 0.01, and gamma of        [Araci, 2019] Dogu Araci. Finbert: Financial sentiment
0.99, for portfolio (a). As the learning curves shown in the       analysis with pre-trained language models, 2019.
Figure 9, EAM-disabled SAMs never reach as good results          [DeMiguel et al., 2007] Victor DeMiguel, Lorenzo Gar-
as EAM-enabled SAMs in terms of periodical rate of return.         lappi, and Raman Uppal. Optimal Versus Naive Diversifi-
The results validate that only with the trading signals from       cation: How Inefficient is the 1/N Portfolio Strategy? The
the EAMs, the SAMs can have an ideal performance.                  Review of Financial Studies, 22(5):1915–1953, 12 2007.
                                                                 [Devlin et al., 2019] Jacob Devlin, Ming-Wei Chang, Ken-
7   Conclusion                                                     ton Lee, and Kristina Toutanova. BERT: Pre-training of
We propose MSPM, a modularized multi-agent                         deep bidirectional transformers for language understand-
reinforcement-learning based system, aiming to bring               ing. In Proceedings of the 2019 Conference of the North
scalability, reusability and profundity of intake information      American Chapter of the Association for Computational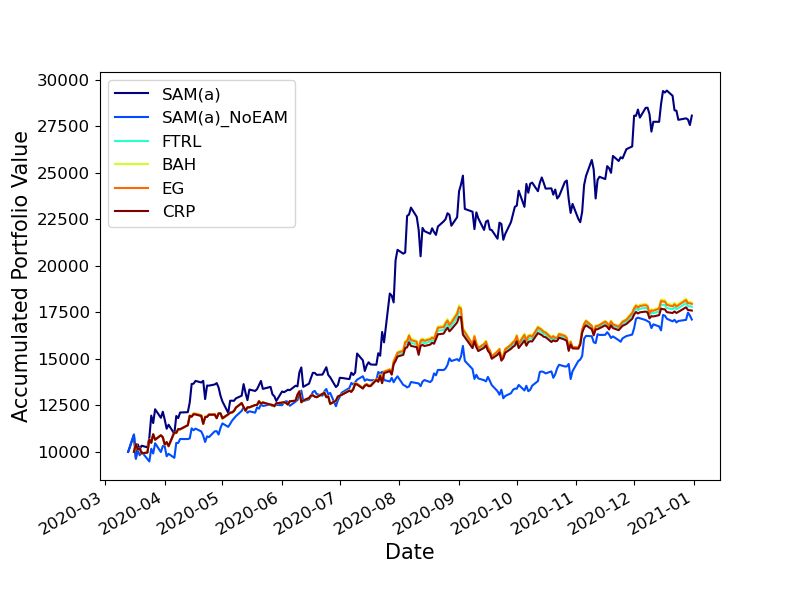
Linguistics: Human Language Technologies, Volume 1            [Sortino and Price, 1994] Frank A. Sortino and Lee N. Price.
   (Long and Short Papers), pages 4171–4186, Minneapo-              Performance measurement in a downside risk framework.
   lis, Minnesota, June 2019. Association for Computational         The Journal of Investing, 3(3):59–64, 1994.
   Linguistics.                                                  [Sycara et al., 1995] Katia Sycara, K. Decker, and Dajun
[Hasselt et al., 2016] Hado van Hasselt, Arthur Guez, and           Zeng. Designing a multi-agent portfolio management sys-
   David Silver. Deep reinforcement learning with double q-         tem. In Proceedings of the AAAI Workshop on Internet
   learning. In Proceedings of the Thirtieth AAAI Conference        Information Systems, October 1995.
   on Artificial Intelligence, AAAI’16, page 2094–2100.          [Wang et al., 2016] Ziyu Wang, Tom Schaul, Matteo Hes-
   AAAI Press, 2016.                                                sel, Hado van Hasselt, Marc Lanctot, and Nando de Fre-
[Jiang et al., 2017] Zhengyao Jiang, Dixing Xu, and Jinjun          itas. Dueling network architectures for deep reinforcement
   Liang. A deep reinforcement learning framework for the           learning, 2016.
   financial portfolio management problem, 2017.                 [Ye et al., 2020] Yunan Ye, Hengzhi Pei, Boxin Wang, Pin-
[Lapan, 2018] Maxim Lapan. Deep Reinforcement Learn-                Yu Chen, Yada Zhu, Ju Xiao, and Bo Li. Reinforcement-
   ing Hands-On: Apply Modern RL Methods, with Deep                 learning based portfolio management with augmented as-
   Q-Networks, Value Iteration, Policy Gradients, TRPO, Al-         set movement prediction states. Proceedings of the AAAI
   phaGo Zero and More. Packt Publishing, 2018.                     Conference on Artificial Intelligence, 34(01):1112–1119,
[Lee et al., 2020] Jinho Lee, Raehyun Kim, Seok-Won Yi,             Apr. 2020.
   and Jaewoo Kang. Maps: Multi-agent reinforcement
   learning-based portfolio management system. Proceed-
   ings of the Twenty-Ninth International Joint Conference
   on Artificial Intelligence, Jul 2020.
[Li and Hoi, 2014] Bin Li and Steven C. H. Hoi. Online port-
   folio selection: A survey. ACM Comput. Surv., 46(3), Jan-
   uary 2014.
[Liang et al., 2018] Zhipeng Liang, Hao Chen, Junhao Zhu,
   Kangkang Jiang, and Yanran Li. Adversarial deep rein-
   forcement learning in portfolio management, 2018.
[López et al., 2010] Vivian F. López, Noel Alonso, Luis
   Alonso, and Marı́a N. Moreno.           A multiagent sys-
   tem for efficient portfolio management. In Yves De-
   mazeau, Frank Dignum, Juan M. Corchado, Javier
   Bajo, Rafael Corchuelo, Emilio Corchado, Florentino
   Fernández-Riverola, Vicente J. Julián, Pawel Pawlewski,
   and Andrew Campbell, editors, Trends in Practical Appli-
   cations of Agents and Multiagent Systems, pages 53–60,
   Berlin, Heidelberg, 2010. Springer Berlin Heidelberg.
[Markowitz, 1952] Harry Markowitz. Portfolio selection.
   The Journal of Finance, 7(1):77–91, 1952.
[MLFinLab, 2021] MLFinLab. Machine learning financial
   laboratory, 2021.
[Mnih et al., 2013] Volodymyr Mnih, Koray Kavukcuoglu,
   David Silver, Alex Graves, Ioannis Antonoglou, Daan
   Wierstra, and Martin Riedmiller.              Playing atari
   with deep reinforcement learning.             2013.    cite
   arxiv:1312.5602Comment: NIPS Deep Learning Work-
   shop 2013.
[Ormos and Urbán, 2013] Mihály Ormos and András Urbán.
   Performance analysis of log-optimal portfolio strate-
   gies with transaction costs.          Quantitative Finance,
   13(10):1587–1597, 2013.
[Rokach, 2010] Lior Rokach. Ensemble-based classifiers.
   Artif. Intell. Rev., 33:1–39, 02 2010.
[Schulman et al., 2017] John Schulman, Filip Wolski, Pra-
   fulla Dhariwal, Alec Radford, and Oleg Klimov. Proximal
   policy optimization algorithms, 2017.

You can also read


