Listed Property Australian Unity Office Fund (ASX Code: AOF) - 6 September 2017 Defensive office fund with medium term opportunities
←
→
Page content transcription
If your browser does not render page correctly, please read the page content below

Listed Property

Australian Unity Office Fund
(ASX Code: AOF)
6 September 2017

Defensive office fund with medium term opportunities
Listed Property Research

 Australian Unity Office Fund (AOF)

 Contents

 1.      Overview                                                   2
 2.      Investment Summary                                         3
 3.      Fund Overview                                              3
 4.      Portfolio Overview                                         6
 5.      Financial Forecasts                                        8
 6.      Valuation                                                  9
 7.      Board & Management                                        10
 8.      Appendix 1: Properties in the Portfolio                   12
 9.      Appendix 2: Financial Summary                             16
 10.     Ratings Process for A-REITs                               17
 11.     Disclaimer & Disclosure                                   18

 About Core Property Research

 Core Property Research Pty Ltd was established in July 2017 to provide market leading and insightful research on the property
 funds sector for its clients and investors. Our ratings and research covers sector level research, ratings and recommendations
 on listed and unlisted property funds, and is built upon the extensive research experience of its staff.

 The Core Property team collectively, has over 50 years' experience across property, financial services and investment markets.
 The team has also evaluated over 500 different funds across multiple sectors and a range of investment structures over the last
 decade.

 IMPORTANT NOTICE
 This document is published by Core Property Research Pty Ltd ABN 31 620 084 880 (“Core Property) and should be read before
 making any investment decision about the product(s). This publication has been prepared by Core Property which is an
 Authorised Representative ASIC number 001257225 of Odyssey Capital Funds Management LTD (AFSL No. 297283).

 For further information, please refer to the Disclaimer & Disclosure notice at the end of this document.

Copyright © 2017 Core Property Research Pty Ltd                                                                          1
Listed Property Research
6 September 2017 Australian Unity Office Fund (AOF)
Recommendation: Hold Initiation of Coverage: Defensive office fund with
See the end of this document for a medium term opportunities
description of Core Property’s ratings
process. The rating must be viewed in the
context of comparable A-REITs and not
AOF provides a conservative exposure to mix of CBD and
across all products. metropolitan office assets across Australia.
Relatively low risk rental profile over the next 3 years with 6.8%+
Forecast Distribution: 6.8%
yield at current price levels. Upside potential from development
Forecast 12 Month Capital
Return:
0.2% activity plus moderate increase in portfolio valuation.
Total Expected Return: 7.0% Trading slightly above NTA of $2.23 per unit.
Experienced management team with Fund Manager, Grant Nichols, having been with
the Fund for 10 years. The three key managers of the Fund have over 50 years combined
Company Data
experience.
ASX Code: AOF
Portfolio consists of 8 properties in CBD and core metropolitan locations valued at
Price: $2.30
$441.1M on a weighted average capitalisation rate 7.5%, 93.5% occupancy, and a
Market Weighted Average Lease Expiry Profile (WALE) of 4.6 years. AOF’s portfolio metrics
$323M
Capitalisation:
Securities on compares favourably with its peer group.
140.4M
Issue:
The two key properties are Telstra House (30 Pirie St, Adelaide SA, 27% of portfolio)
52 Week Range: $1.97 - $2.335 with 91.7% leased to Telstra and lease expiring in FY23, and 10 Valentine St, Parramatta
NSW (20% of portfolio) leased primarily to the NSW government until FY22.
Conservative valuation of portfolio with 21% of portfolio valued on 8.0% - 9.0%
capitalisation rates, providing potential valuation upside. The possible redevelopment at
10 Valentine St, Parramatta could also provide valuation upside in 2-3 years.
Lease expiries in the medium term are relatively low risk with 3-10% of NLA falling
due each year for the next four years, supported by average rent increases of 3.5% p.a.
Conservative gearing of 27.4% (June 2017) providing headroom for AOF to fund
additional capex and development expenditure and still remain within its target gearing of
under 40%.
Attractive distribution yield of 6.8% in FY18 with AOF trading slightly above its NTA
of $2.23 per unit.
Valuation metrics: Core Property has a 12-month price target for AOF of $2.31 per unit.
With a reasonably attractive yield and the security trading at close to our current target,
investors may consider opportunities to purchase on price weakness.
Price performance (12 mths) Year Ended 30 June FY17A FY18F FY19F FY20F
NPAT - Reported - $M 60.6 21.2 20.7 21.2
NPAT - adj - $M 24.0 24.2 24.8 25.5
Price/Earnings Ratio 13.4 13.3 13.0 12.6
EPU - adj - cents 17.1 17.3 17.7 18.1
EPU - Growth NA 1.0% 2.4% 2.6%
DPU - cents 15.0 15.6 15.9 16.3
Distribution Yield 6.6% 6.8% 6.9% 7.1%
NTA per unit $2.23 $2.25 $2.30 $2.36
Gearing 27.4% 28.4% 28.3% 28.0%
Source: IRESS Source: Core Property estimates,
Note: Gearing = (net debt – cash) / (net debt – cash + net assets)
Copyright © 2017 Core Property Research Pty Ltd 2
Australian Unity Office Fund (AOF)
6 September 2017
Investment Summary
Core Property initiates coverage on Australian Unity Office Fund (ASX: AOF). Our review incorporates
AOF’s full year results to 30 June 2017, released on 8 August 2017. AOF is managed by Australian
Unity Investment Real Estate Limited (AUIRE) as the Responsible Entity ("RE"), which is part of the
Australian Unity group. Core Property considers the key investment criteria for AOF to be:
Experienced Property Management team: The Fund Manager, Grant Nichols has been
with the Fund for 10 years. The three key managers in the Fund have over 50 years
combined experience.
Conservative portfolio valuations: We consider AOF's property portfolio to be
conservatively valued at $441.1M on a 7.5% capitalisation rate at June 2017. This compares
to peer capitalisation rates for Centuria Metropolitan REIT (ASX: CMA) at 7.2% and Investa
Office Fund (ASX: IOF) at 5.74%. AOF provides potential valuation upside from
conservatively valued properties, as well as possible development upside from it’s property
at 10 Valentine St, Parramatta NSW.
Low risk to medium term distributions: AOF's income at risk is quite low with around
23% of leases (by NLA) falling due in the next four years (FY18-FY21). In addition, the
existing leases have average annual increases of 3.5% p.a., providing a firm base for growth
in future distributions.
Low gearing: AOF is geared at 27.4%, which is well below AOF's target to remain below
40%. Core Property considers the low gearing to be prudent and provides sufficient
headroom to increase debt levels to fund development and refurbishment capex.
Attractive distribution yield: At current levels AOF offers an attractive FY18 forecast
yield of 6.8%, increasing in FY19 to 6.9% based on Core Property’s forecasts.
Valuation metrics: Core Property has a 12-month price target for AOF of $2.31 per unit.
This is a 3.6% premium above the NTA per unit of $2.23 at 30 June 2017.
Fund Overview
Fund Strategy
AOF states that its objective is: “To provide unitholders with sustainable income returns via quarterly
distributions and the potential for capital growth over the long term by investing in a diversified
portfolio of Australian office properties.”
The Fund’s portfolio of office properties is currently located in CBD and metropolitan locations. Core
Property considers AOF to represent a defensive investment in the office investment space, for a
number of reasons:
Core Property consider management to be conservative. The key Fund Manager and
Portfolio Manager have been with the Fund for 10 years and the Fund has not made any
acquisitions or disposals in the past three years.
Management has advised that it will not undertake any substantial acquisitions without
raising additional equity from unitholders.
Capex will be funded through debt and undistributed earnings. Given that the majority of
the properties were constructed prior to 2000, Core Property expects AOF’s will use its
undistributed earnings as well as additional debt for development capex and incentives.
The current debt facility is 80% hedged with an all-in cost of debt of 3.6%. The high level
of hedging provides a level of certainty to future distributions.
In Core Property’s opinion, valuations across the portfolio may have a degree of
conservatism factored in. This may provide a bit of a safety cushion for AOF to ride out any
potential bumps in the market.
Copyright © 2017 Core Property Research Pty Ltd 3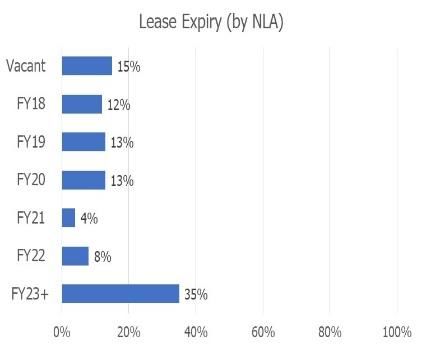
Australian Unity Office Fund (AOF)
 6 September 2017

                           History of the Fund

                           AOF was originally established in March 2005 as the Investa Diversified Office Fund, an unlisted
                           property fund which was managed by Investa Properties as the Responsible Entity.

                           In 2011 Australian Unity acquired the management rights to the Fund and listed the fund on the
                           ASX in June 2016. The ASX listing was undertaken to: 1) provide liquidity for investors wishing to
                           exit the Fund, and 2) reduce debt levels, which were around 50%. The ASX listing raised $152.1M
                           through the issue of 76.0M additional units at $2.00 per unit. Currently the Fund has a total of
                           140.4M units on issue, with around 13.9% of the units owned by Australian Unity entities and funds
                           managed by Australian Unity subsidiaries. As part of the ASX listing, AOF management advised that
                           it would not undertake any substantial acquisitions without raising additional equity from
                           unitholders. AOF has not acquired or sold any properties since its ASX listing in June 2016.

                           Figure 1: History of the Fund

                            Date                Event

                            23 Mar 2005         The Fund is established as the Investa Diversified Office Fund with Investa
                                                Properties Limited as the Responsible Entity.
                            31 Jan 2007         Investa Funds Management Limited becomes the Responsible Entity.

                            8 Aug 2011          Australian Unity Investments announces it will acquire the Responsible Entity,
                                                Investa Funds Management Limited
                            30 Sep 2011         The Responsible Entity changes its name to Australian Unity Property Investment
                                                Management Limited.
                            2 Nov 2012          Australian Unity Funds Management Limited becomes the Responsible Entity.
                            17 Jun 2016         Australian Unity Investment Real Estate Limited becomes the Responsible Entity.
                            20 Jun 2016         The Fund is listed on the ASX.
                           Source: Core Property, Australian Unity, Investa Office

                           Figure 2: AOF operational performance since June 2016

 AOF portfolio has been     As at                                                    30-Jun-16      31-Dec-16        30-Jun-17
 stable since listing on    Properties                                                         8               8                  8
 the ASX in June 2016.
                            Valuation (Book Value)                                     $392.8M          $412.8M         $441.1M
                            Ave Cap Rate                                                 8.00%            7.80%           7.50%
                            NLA (sqm)                                                    97,595           97,595          97,580
                            Occupancy                                                    94.7%            94.7%           93.5%
                            WALE                                                      4.77 years      4.45 years        4.6 years
                            NTA per security                                              $1.95            $2.08              $2.23
                            LVR                                                          30.1%            28.4%           28.0%
                            ICR                                                           2.87x            4.06x              6.45x
                            Gearing                                                      27.5%            27.9%           27.4%
                            Distributable Earnings per security (6 months)                   NA          9.1 cpu          8.0 cpu
                            Distributions per security (6 months)                            NA          7.4 cpu          7.6 cpu

                           Source: AOF, Core Property Research

Copyright © 2017 Core Property Research Pty Ltd                                                                               4
Australian Unity Office Fund (AOF)
 6 September 2017

                          Capital Structure

 Conservatively geared    AOF has a target gearing of
Australian Unity Office Fund (AOF)
6 September 2017
Portfolio Overview
AOF owns a portfolio of eight properties valued at $441.1M. At 30 June 2017 its portfolio metrics are:
WALE of 4.6 years.
Occupancy of 93.5% across the portfolio. Occupancy levels have fallen from 94.7% in the
prior six months as a result of 2 vacant floors at 30 Pirie St, Adelaide SA.
Lease expiries are between 3% and 10% of NLA each year over the next four years.
Around 69% of leases (by NLA) fall due in FY22 onwards.
AOF’s key property is Telstra House, 30 Pirie St, Adelaide SA, which accounts for 27% of
69% of leases fall due the portfolio. The building is 91.7% occupied, with Telstra vacating 2 floors that it did not
in FY22 onwards require in the 23-floor building in February 2017. The building is the second tallest in the
Adelaide CBD and Telstra has occupied the building since it was constructed in 1987 with
its current lease expiry in February 2023.
2 key properties AOF’s second largest property, 10 Valentine St, Parramatta NSW accounts for 20% of the
account for 47% of the portfolio. The two largest properties in the portfolio have lease expiries in FY22 and FY23.
portfolio Around 21% of the portfolio is valued on capitalization rates of between 8.0% - 9.0%.
Figure 4: AOF property portfolio – at 30 June 2017
Book WALE Cap
Grade NLA sqm Occup
Value $M (yrs) Rate
30 Pirie Street, Adelaide, A 119.0 24,781 5.7 91.7% 7.50%
SA
10 Valentine Avenue, A 86.0 15,995 4.8 100.0% 7.75%
Parramatta, NSW
32 Phillip Street, B 41.7 6,759 6.0 100.0% 7.00%
Parramatta, NSW
5 Eden Park Drive, North A 52.4 11,018 6.6 89.9% 6.75%
Ryde, NSW
468 St Kilda Road, B 51.0 11,186 3.1 90.8% 6.75%
Melbourne, Vic
241 Adelaide Street, B 36.8 11,078 2.5 85.3% 8.50%
Brisbane, Qld
2 Eden Park Drive, North Office/ 34.5 10,345 2.7 100.0% 8.00%
Ryde, NSW warehouse
64 Northbourne Avenue, B 19.7 6,418 3.7 92.6% 9.00%
Canberra, ACT
Total Portfolio 441.1 97,580 4.6 93.5% 7.50%
Source: AOF
Figure 5: WALE (by net lettable area) – at 30 June 2017
Lease Expiry (by NLA)
60% 49%
40%
20%
20% 6% 10% 6% 6% 3%
0%
Vacant FY18 FY19 FY20 FY21 FY22 FY23+
Source: AOF
Copyright © 2017 Core Property Research Pty Ltd 6
Australian Unity Office Fund (AOF)
6 September 2017
Tenants
AOF’s top 5 tenants account for 62% of gross property income. The largest tenant is Telstra (at 30
Pirie Street Adelaide SA) which accounts for 28% of the portfolio’s gross property income with its
lease due in February 2023.
Figure 6: Tenancy Distribution and Geographic Distribution – at 30 June 2017
Tenancy Distribution Geographic Distribution
Source: AOF
Property Valuations
Potential valuation AOF’s policy is to undertake an independent external valuation of its properties at least once in any
upside from … 12 month period. The AOF portfolio is valued on a 7.50% capitalisation rate, which appears
conservative in comparison to the capitalisation rates across the listed office sector. AOF’s closest
listed comparable is CMA which has a portfolio capitalisation rate of 7.19% at 30 June 2017. Core
Property considers the AOF portfolio has valuation upside potential from the following:
10 Valentine St, 10 Valentine St, Parramatta NSW is currently valued at $86M on a 7.75%
Parramatta NSW capitalisation rate at June 2017. The valuation does not take into account any
potential development potential for the site, which is currently being considered by AOF. We
development… calculate that, subject to development approval, a valuation upside of $10M - $15M would
imply a capitalisation rate of 6.6% - 6.95% and add between $0.07 - $0.11 per unit to the
NTA of AOF. We expect AOF will be considering development opportunities at the
property in the next 2-3 years.
2 Eden Park Drive, North Ryde NSW is an office/warehouse which was last
2 Eden Park Drive,
independently valued at $34.0M in December 2016 on a 8.0% capitalisation rate. The
North Ryde NSW
property appears to be conservatively valued when compared to its neighbouring
potential valuation
properties, which include 1) a data centre owned by Asia Pacific Data Centres (ASX: AJD)
upside, and…
valued on a 6.25% capitalisation rate, and 2) 5 Eden Park Drive, also owned by AOF,
which is valued on a 6.75% capitalisation rate. We estimate a $3M - $4M valuation upside
would imply a capitalisation rate of 7.0% - 7.35% and add $0.02 - $0.04 per unit to the
NTA of AOF.
… improvements in Two other assets appear to have conservative capitalisation rates which are
leasing profiles for reflective of their tenancy profiles – 241 Adelaide St, Brisbane Qld (8.5% cap rate)
other assets. and 64 Northbourne Ave, Canberra ACT (9.0% cap rate). These assets may offer upside
through refurbishment initiatives and improved tenancies.
It should be noted that these are Core Property’s hypothetical scenarios and may not represent
actual independent valuation results. The estimates should be used only as an illustrative example
of the valuation upside potential in AOF’s portfolio.
Copyright © 2017 Core Property Research Pty Ltd 7Australian Unity Office Fund (AOF)
6 September 2017
The following table is comparison of AOF’s portfolio against other listed A – REITs with office major
office property weightings. The two most comparable A-REITs to AOF are CMA and IDR, both of
which have portfolios above $600M, however are valued on lower capitalisation rates.
Figure 7: Portfolio Metrics - Listed peer comparison – as at 30 June 2017.
Portfolio Cap
Code: Company Portfolio Description Occ WALE Gearing
Size ($M) Rate
5.1
IOF: Investa 20 properties (100% 3,810.4 5.74% 97% 21.4%
Office Fund office) years
6.1
GOZ: Growthpoint 48 properties (66% 3,283.8 6.50% 99% 39.0%
Properties office/34% industrial) years
7.6
IDR: Industria 15 properties (54% 638.0 6.70% 95% 30.8%
REIT office/46% industrial) years
3.9
CMA: Centuria 15 properties (93% 610.0 7.19% 97.3% 29.5%
Metropolitan REIT office/7% industrial) years
AOF: Australian 8 properties, (8% in 4.6
Unity Office one office/warehouse 441.1 7.50% 93.5% 27.4%
years
Fund asset)
Source: Core Property, company announcements
Financial Forecasts
AOF’s guidance for AOF provided guidance for FY18 on 8 August 2017 as follows:
FY18 is
FY18 FFO of between 17.1 and 17.3 cents per unit – implying growth of between 0% -
FFO growth of 1.2% on FY17.
0% - 1.1% and FY18 distributions of 15.6 cents per unit - a 4% increase on FY17 distributions of 15.0
cents per unit.
Distribution growth of
4% … Core Property notes the following:
AOF’s guidance implies a payout ratio of 90.2% - 91.2%. This is in the middle of AOF’s
distribution policy which is to payout between 80% - 100% of its distributable
earnings.
We expect AOF’s long term payout ratio to move to the lower end of the range, at around
80% - 90% of distributable earnings. This would free up around $2.5M - $5.0M to be
reinvested as capital expenditure on its properties, representing about 0.6% - 1.1% of the
portfolio at current prices. We estimate that over the medium to long term, AOF’s portfolio
need to maintain its capex at around $4M - $5M p.a., which we expect will be funded
through a combination of undistributed earnings and small draw downs on debt. At
current levels, AOF has a sufficient buffer in its debt to facilitate this. We forecast FY18
gearing to be 28.4%, which is well below AOF’s target of below 40% and bank covenants
of 50%. For every $1M increase in debt, AOF’s gearing increases by around 0.16%.
Core Property expects AOF will need to consider additional capex in prior to the February
2023 renewal of the Telstra lease at 30 Pirie St, Adelaide SA. A major refurbishment of
around $19M was undertaken in 2012, however this was one of the largest expenditures
on the building since it was built in 1987. Core Property is assuming around 1.0% of
property valuations will be spent on capex, with an additional $7M capex spend in FY21-
FY23 to assist in major lease expiries (including 30 Pirie St., Adelaide SA).
Copyright © 2017 Core Property Research Pty Ltd 8Australian Unity Office Fund (AOF)
6 September 2017
Core Property’s FFO forecasts are presented as follows:
Figure 8: FFO Forecast – Core Property
Core Property is Financial Forecasts FY17A FY18F FY19F FY20F
forecasting AOF to Property Revenue ($m) 47.5 48.5 49.7 50.9
come in at the high
Property Expenses ($m) -15.8 -16.1 -16.5 -16.9
end of its FY18
guidance. RE Fees ($m) -2.5 -2.6 -2.7 -2.8
Finance Costs ($m) -4.4 -4.6 -4.7 -4.8
Other Expenses ($m) -0.9 -0.9 -0.9 -1.0
Funds from Operations ($m) 24.0 24.2 24.8 25.5
FFO (cents per unit) 17.1 17.3 17.7 18.1
Guidance – FFO (cents per unit) 17.1 – 17.3
Payout Ratio 88% 90% 90% 90%
Distributions (cents per unit) 15.0 15.6 15.9 16.3
AOF Guidance - Distn per unit 15.6
Source: Core Property forecasts, AOF Guidance is as per its results announcement on 8 August 2017.
Valuation
Core Property has a 12-month price target for AOF of $2.31 per unit based on a DCF Valuation
rolled forward by 12 months. We calculate our DCF valuation using a Discount Rate of 9.0% and
terminal growth rate of 3.0% with a current DCF Valuation of $2.21 per unit. We roll this forward
by 12 months to arrive at a DCF target of is $2.31 per unit.
At a current price of $2.30 AOF is trading at a 3.1% premium to its NTA of $2.23 per security (at 30
June 2017). Based on a 12-month price target of $2.31 we forecast a 12-month Total Return for
FY18 of 7.0%, consisting of a 6.8% yield plus 0.2% of capital gains.
Figure 9: Price - Listed peer comparison
Disc / FY18F
Market NTA per FY18F
Code: Company Price Prem to Distn per
Cap unit Yield
NTA unit
IOF: Investa Office $4.44 $2.726M $4.79 -7.3% $0.203 4.6%
Fund
GOZ: Growthpoint $3.17 $2,096M $2.88 10.1% $0.220 6.9%
Properties
IDR: Industria REIT $2.45 $400M $2.57 -4.7% $0.165 6.7%
CMA: Centuria $2.46 $438M $2.32 6.0% $0.181 7.4%
Metropolitan REIT
AOF: Australian $2.30 $323M $2.23 3.1% $0.156 6.8%
Unity Office Fund
Source: Core Property, company announcements. Prices and market capitalisation as at 6 September 2017. FY18F
represents forecast guidance as provided by companies.
Copyright © 2017 Core Property Research Pty Ltd 9Australian Unity Office Fund (AOF)
6 September 2017
Board & Management
AOF is managed by the Australian Unity Group, a mutual organisation that operates in healthcare,
investments, retirement living and financial services. Australian Unity promotes itself as having
300,000 members, and almost a million customers in Australia. The mutual was formed in 1993 by
the merger of the Australian Natives’ Association Friendly Society (ANA) and the Manchester Unity
Independent Order of Oddfellows (Manchester Unity) in Victoria. Manchester Unity was established
in Victoria in 1840.
The Board of the Responsible Entity, Australian Unity Investment Real Estate Limited (AUIRE)
consists of five members. The Chairman, Peter Day, was the Deputy Chairman of the ASIC, and is
one of two independent directors on the Board. The Fund Manager and Portfolio Manager have
continuously managed the Fund since 2007 when it was part of Investa Property Group. The
following table summarises AOF’s Board and management experience.
Figure 10: Board of the Responsible Entity (AUIRE) and Senior Management of the Fund
Board of AUIRE
(William) Peter Day - Independent Chairman
Previous senior executive roles in finance and general management in mining, manufacturing,
food and financial services including Bonlac Foods, Rio Tinto, CRA and Comalco. Previously CFO of
Amcor for seven years until 2007. Former non-executive director of Federation Centres (2009-
2014), former Chairperson of Orbital Corporate Limited (2007-2014), former Chairman of the
Australian Accounting Standard Board and was Deputy Chairman of the ASIC. Currently non-
executive director of Alumina, Ansell, Boart Longyear and is a member of the Takeovers Panel.
Don Marples - Independent Director
Over 30 years’ experience in senior management positions in real estate funds management,
infrastructure, construction, banking and investment banking. Currently on the Boards of NSW
Crown Holiday Parks Trust, Northern Sydney Local Health District, and MPC Funding Limited. Was
Joint Managing Director of Fortius Funds Management (2006-2009); General Manager/Global
Head of Project, Finance & Infrastructure at the Commonwealth Bank (1999-2006); Chief
Executive, Project Finance and Executive Director, Lend Lease Capital Services (1991-1999).
Eve Crestani - Non-Executive Director
Over 35 years’ experience in financial and professional services. Current director of booking.com
Limited, Seres Capital Management Limited (Caymans), Seres Asset Management Limited (Hong
Kong), Zurich Financial Services Australia Limited and Zurich Australia Limited. Former non-
executive director of Australian Unity Limited (1996-2016), former Chairman of Mercer
Superannuation Australia Limited and Mercer Outsourcing (Australia) Limited. Current member of
the ASX Appeal Tribunal and a founding Fellow of the Australian Institute of Company Directors.
Greg Willcock - Non-Executive Director
Over 33 years’ experience in banking and financial services in Australia, the USA and UK, including
seven years in general management at national Australia Bank in risk management, strategy and
change management. Has been a director of Australian Unity since 2012. Currently the Chairman
of Big Sky Building Society Limited and director of the Customer Owned Banking Association.
Kirsty Dullahide - Executive Director
Has held senior roles in funds management, insurance and banking. Has been the Board member
of Australian Unity Investments joint venture businesses in equities and fixed interest asset
management. Recently was the Chair of Altius Asset Management Limited. Currently the General
Manager, Strategy for Australian Unity Investments.
Copyright © 2017 Core Property Research Pty Ltd 10Australian Unity Office Fund (AOF)
6 September 2017
Senior Management of the Fund
Grant Nichols – Fund Manager
Has over 10 years’ experience in the property industry, primarily in funds and asset management.
Joined Australian Unity in 2011 and was previously a Fund Manager at Investa Property Group.
Holds a Bachelor of Land Economics from the University of Technology Sydney, a Masters of
Applied Finance from FINSIA, is a Fellow of FINSIA and is a Licensed Real Estate Agent.
Simon Beake – Portfolio Manager
Has over 20 years of financial and transaction experience with 10 years in property. Joined
Australian Unity in 2011 and was previously Senior Fund Analyst at Investa Property Group for
four years. Has also held roles in the UK at Biwater and Cascal Services. Holds a Bachelor of Arts
(Accounting and Finance) from Lancaster University (UK), a Masters of Applied Finance from
Macquarie University, Sydney, and is a Member of the Chartered Institute of Management
Accountants (UK).
Giovanna Reale – Asset Manager
Has over 20 years’ property experience, including management and leasing at leading real estate
agencies and owner managers in industrial, healthcare, commercial and retail property. Joined
Australian Unity in 2006 and is responsible for the asset management of the Fund. Holds a
Bachelor of Business in Property from RMIT.
Source: AOF
Copyright © 2017 Core Property Research Pty Ltd 11Australian Unity Office Fund (AOF)
6 September 2017
Appendix 1: Properties in the Portfolio
30 Pirie Street, Adelaide, SA – 27% of portfolio
Key asset is Telstra As at 30 June 2017
House in Adelaide Book Value $119.0M
(27% of portfolio) … Capitalisation Rate 7.50%
Floors 23
NLA (sqm) 24,781
Occupancy-by NLA 91.7%
WALE 5.7 yrs
Year Constructed 1987
Last Refurbishment 2012
Major Tenant Telstra
A grade office known as “Telstra House”, the second tallest building in the Adelaide CBD.
… Telstra are long
Telstra has occupied the building since construction in 1987.
term tenants,
Extensive c.$19M refurbishment in 2012 as part of new 11 year Telstra lease (expiring Feb 2023).
occupying the building
Telstra handed back the top two floors (8% of NLA, levels 22 and 23) in February 2017, however
since construction in
still pay rent until December 2017. The floors have been refurbished and available for lease.
1987, 2 floors vacant,
Annual rent reviews of 3.5% p.a.
major refurbishment in
The property is the largest asset in the portfolio (27% of the portfolio, by value).
2012 with lower capex
Telstra have occupied the building since it was constructed in 1987 and currently use
likely at lease expiry in
21 of the 23 floors. The significant capital expenditure (c$19M) was undertaken when
FY23.
the building was 25 years old. Core Property does not expect significant refurbishment
expenditure would be required at lease expiry in FY23. A relatively stable income flow
is expected with 3.5% p.a. increases.
10 Valentine Avenue, Parramatta, NSW – 20% of portfolio
10 Valentine Ave, As at 30 June 2017
Parramatta NSW is the Book Value $86.0M
second largest asset in Capitalisation Rate 7.75%
the portfolio Floors 14
NLA (sqm) 15,995
Occupancy-by NLA 100%
WALE 4.8 yrs
Year Constructed 1987
Last Refurbishment Current
Major Tenant NSW govt
A grade office property with adjacent six level carpark, located within 100 metres of Parramatta
…which Core Property
transport and shopping.
considers to be
Predominantly leased to the NSW state government, who have occupied the building since its
conservatively valued
construction in 1987. Lease expiry June 2022. Annual fixed rent reviews of 3.25% p.a.
on a 7.75%
NSW state government has the ability to hand back five floors (4,5,6,7,13) between December
capitalisation rate, with
2019 and December 2020, provided notice is given by December 2018.
potential
Core Property consider this asset to offer considerable valuation upside due to 1) a
redevelopment upside.
conservative valuation based on a 7.75% capitalisation rate, 2) strong demand in the
Parramatta district may provide an opportunity to sell the asset, and 2) potential to
redevelop the carpark space into commercial offices, estimated in FY19-FY21.
Copyright © 2017 Core Property Research Pty Ltd 12Australian Unity Office Fund (AOF)
6 September 2017
32 Phillip Street, Parramatta, NSW – 10% of portfolio
As at 30 June 2017
Book Value $41.7M
Capitalisation Rate 7.00%
Floors 14
NLA (sqm) 6,759
Occupancy-by NLA 100%
WALE 6.0 yrs
Year Constructed 1991
Last Refurbishment 2013
Major Tenant GE
B grade office property located in the north of the Parramatta commercial precinct, close to the Church
Street retail strip.
Fully refurbished in 2013 and fully leased to GE under a 10 year lease expirng in June 2023.
Annual fixed rent reviews of 3.5% p.a. with a market review in 2018 (0% - 7.5% capped).
Core Property considers this property to offer secure income for the portfolio until around
FY22-FY23 when the Manager may consider options for additional development, including
residential options. Strong demand in the Parramatta district may provide an opportunity for
AOF to sell the asset prior to the current lease expiry.
5 Eden Park Drive, North Ryde, NSW – 12% of portfolio
As at 30 June 2017
Book Value $52.4M
Capitalisation Rate 6.75%
Floors 4
NLA (sqm) 11,018
Occupancy-by NLA 89.9%
WALE 6.6 yrs
Year Constructed 2004
Last Refurbishment NA
Major Tenant CPSA
(57%)
A grade office property with three levels of office and a hi tech production and warehouse, close to
Macquarie Park railway station.
Purpose built for Contract Pharmaceutical Services Australia (CPSA) who occupy 57%. CPSA recently
renewed its lease for a further eight years. The Commonwealth government and PACOM Systems
occupy 33%. A vacant suite is on Level 2.
Annual fixed rent reviews of 3.5% p.a.
The property is well located and Core Property expects AOF will look to fill the vacant suite
as a priority for this asset.
Copyright © 2017 Core Property Research Pty Ltd 13Australian Unity Office Fund (AOF)
6 September 2017
468 St Kilda Road, Melbourne, Victoria – 12% of portfolio
As at 30 June 2017
Book Value $51.0M
Capitalisation Rate 6.75%
Floors 13
NLA (sqm) 11,186
Occupancy-by NLA 90.8%
WALE 3.1 yrs
Year Constructed 1985
Last Refurbishment Since 2010
Major Tenant EGA (9%),
TLC (8%)
B grade office property located on St Kilda Road, approximately 3kms south of the Melbourne CBD.
Property is divided in to a number of smaller tenancies with the largest tenants being EGA Corporate
Advisors (9% of NLA) and TLC Aged care (8% of NLA).
Rent reviews of around 3.5% p.a.
Core Property considers AOF will need to improve the occupancy and WALE a this property,
or consider the potential for residential conversion in the medium term.
241 Adelaide Street, Brisbane, Qld – 8% of portfolio
As at 30 June 2017
Book Value $36.8M
Capitalisation Rate 8.5%
Floors 21
NLA (sqm) 11,078
Occupancy-by NLA 85.3%
WALE 2.5 yrs
Year Constructed 1988
Last Refurbishment Since 2012
PPC
Major Tenant (4.6%)
Trust Co
(4.6%)
B grade office, known as “The Brisbane Club Tower” located in the core Brisbane CBD, adjacent to Post
Office Square and close to the railway station.
The property has 33 tenancies with the largest tenants being PPC World-wide (4.6% of NLA) and Trust
Company (4.6% of NLA).
Rent reviews of around 3.5% p.a.
Core Property considers the property to offer potential upside from 1) the potential for AOF
to improve the tenancy profile – improved occupancy levels and longer WALE, 2)
conservative valuation based on 8.5% capitalisation rate.
Copyright © 2017 Core Property Research Pty Ltd 14Australian Unity Office Fund (AOF)
6 September 2017
2 Eden Park Drive, North Ryde, NSW – 8% of portfolio
As at 30 June 2017
Book Value $34.5M
Capitalisation Rate 8.00%
Floors 3
NLA (sqm) 10,345
Occupancy-by NLA 100%
WALE 2.7 yrs
Year Constructed 1999
Last Refurbishment NA
Major Tenant NuSkin
(14%)
An office/warehouse property comprising 16 attached units with office and warehouse components,
located in the Macquarie Park business park, close to the Macquarie Park railway station.
The units consist of small offices with high clearance warehouses attached, providing a high occupancy
level since construction.
Lease expires are staggered with around 10% - 27% of NLA falling due each year.
Rent reviews of around 3.5% p.a.
Core Property considers the property to be an attractive industrial asset with potential
valuation upside.
64 Northbourne Avenue, Canberra, ACT – 5% of portfolio
As at 30 June 2017
Book Value $19.7M
Capitalisation Rate 9.00%
Floors 6
NLA (sqm) 6,418
Occupancy-by NLA 92.6%
WALE 3.7 yrs
Year Constructed 1985
Last Refurbishment 2012
Cushman&
Major Tenant Wakefield
(27%)
B grade office property located on a prominent canberra CBD corner with close proximity to retail and
bus interchange.
Around 7% of the property is vacant, fully refurbished and on the market.
Around 33% of NLA falls due in FY18 and 9% in FY19. The Manager is considering subdividing floors to
attract smaller tenancies.
Rent reviews of around 3.5% p.a.
Core Property expects the B grade property will require some refurbishment with 33% of
leases falling due in FY18. An improvement in the occupancy and WALE would support a
higher valuation.
Copyright © 2017 Core Property Research Pty Ltd 15Australian Unity Office Fund (AOF)
6 September 2017
Appendix 2: Financial Summary
Profit & Loss FY17A FY18F FY19F FY20F Summary FY17A FY18F FY19F FY20F
Operating Revenue 47.5 48.5 49.7 50.9 NPAT - adj 24.0 24.2 24.8 25.5
Property Expenses -15.8 -16.1 -16.5 -16.9 Price Earnings Multiple 13.5 13.3 13.0 12.7
Net Property Income 31.8 32.4 33.2 34.0
Other Income & Expenses -0.9 -0.9 -0.9 -1.0 Revenue Growth NA 2.0% 2.4% 2.5%
RE Fees -2.5 -2.6 -2.7 -2.8 EBIT Growth NA 1.6% 2.4% 2.4%
EBITDA 28.4 28.9 29.6 30.3
Depn & Amort 0.0 0.0 0.0 0.0 Value of Properties 441.1 458.5 465.0 476.5
EBIT 28.4 28.9 29.6 30.3 Net Assets 313.7 315.9 322.4 331.6
Net Interest -4.4 -4.6 -4.7 -4.8 NTA per Unit $2.23 $2.25 $2.30 $2.36
Pre Tax Profit 24.0 24.2 24.8 25.5 Prem(Disc) to NTA per unit 2.9% 2.2% 0.1% -2.6%
Tax 0.0 0.0 0.0 0.0
Minorities 0.0 0.0 0.0 0.0 DPU 15.0 15.6 15.9 16.3
NPAT - adj 24.0 24.2 24.8 25.5 Payout Ratio 87.7% 90.1% 90.0% 90.0%
Non Recurring Items 36.6 -3.0 -4.1 -4.3 DPU Growth 3.7% 2.3% 2.6%
NPAT - Statutory 60.6 21.2 20.7 21.2 Yield 6.5% 6.8% 6.9% 7.1%
Cashflow FY17A FY18F FY19F FY20F Key Ratios FY17A FY18F FY19F FY20F
Operating Activities 30.3 28.4 29.1 29.8
Net Interest -4.2 -4.6 -4.7 -4.8 EPU (adj) 17.1 17.3 17.7 18.1
Tax Paid 0.0 0.0 0.0 0.0 EPU - Reported 43.2 15.1 14.7 15.1
Other 0.0 0.0 0.0 0.0 EPU (adj) - Growth 1.0% 2.4% 2.6%
Operating Cashflow 26.1 23.8 24.3 24.9
Capex -12.8 -8.8 -4.4 -4.4 LVR 27.8% 27.5% 27.6% 27.3%
Maintainable Operating CF 13.2 15.0 19.9 20.5 Net Debt/(Net Debt + Equity) 27.4% 28.4% 28.3% 28.0%
Net interest Cover 6.4 6.2 6.2 6.3
Distributions -16.2 -21.7 -22.1 -22.6
Acquisitions 0.0 0.0 0.0 0.0 Distn / Maintainable CF 122.5% 145.2% 110.8% 110.2%
Disposals 0.0 0.0 0.0 0.0
Other -8.0 0.0 0.0 0.0 ROE 7.9% 7.5% 7.6% 7.6%
Free Cashflow -11.0 -6.8 -2.2 -2.1
Change in Debt 4.5 6.4 1.9 1.9
Change in Equity 0.0 0.0 0.0 0.0
Net Cashflow -6.5 -0.3 -0.2 -0.2
Balance Sheet FY17A FY18F FY19F FY20F Valuation
Cash 4.1 1.0 1.0 1.0
Debtors 0.4 0.4 0.5 0.5 Discount Rate 9.0%
Investments 0.0 0.0 0.0 0.0 Terminal Growth Rate 3.0%
Other Assets 441.7 450.4 459.2 470.6 DCF Valuation per Share $2.21
Total Assets 446.2 451.9 460.6 472.1 12 Month Target Price $2.31 DCF rolled forward 12 mths
Creditors 4.3 4.4 4.5 4.7 12 month Dividend Yield 6.8%
Borrowings 122.8 126.1 128.2 130.2 12 month Target Price 0.2%
Provisions 0.0 0.0 0.0 0.0 Total Est. 12 mth return 7.0%
Other Liabilities 5.3 5.4 5.5 5.7
Total Liabilities 132.5 136.0 138.2 140.5
Net Assets 313.7 315.9 322.4 331.6
Source: Core Property estimates,
Note: Gearing = (net debt – cash) / (net debt – cash + net assets)
Copyright © 2017 Core Property Research Pty Ltd 16Australian Unity Office Fund (AOF)
6 September 2017
Ratings Process for A - REITs
Core Property Research evaluates recommendations on listed A-REITs continuously, based on a range of qualitative and
quantitative criteria ranging from management, appropriateness of the A-REIT’s capital structure and the property portfolio
metrics. From a quantitative perspective, Core Property’s recommendations are based on Total Expected Returns (forecast
distribution yield plus forecast capital gain or loss) for a 12-month time horizon, using a range of valuation methodologies.
The two most commonly used valuation techniques are Discounted Cash Flow (DCF), which uses an A-REI’s expected free
cash flow, and the net Asset Valuation (NAV) approach.
The 12-month Total Return is compared with set total return bands and assigned a 12-month recommendation based on the
Recommendation Definitions below.
Recommendation Definitions
Recommendation Definition
Buy If the 12-month Total Expected Return is forecast to be 15% or more.
If the 12-month Total Expected Return is forecast to be at least 10% and less than
Accumulate
15%.
If the 12-month Total Expected Return is forecast to be at least 5% and less than
Hold
10%.
If the 12-month Total Expected Return is forecast to be at least 0% and less than
Reduce
5%.
Sell If the 12-month Total Expected Return is forecast to be less than 0%.
At times of extreme volatility, it is quite possible that the recommendations will swing between each of our bands. During such
times, Core Property will adopt a more flexible approach to recommending stocks, based on a slightly longer duration, and as
such, recommendations may appear to be inconsistent when compared with the bands. This is to avoid clouding value judgments
with short-termism.
Copyright © 2017 Core Property Research Pty Ltd 17Australian Unity Office Fund (AOF) 6 September 2017 Disclaimer & Disclosure Core Property has received a fee from the Manager for researching the product(s) which has then been subject to a detailed review and assessment by Core Property and its analysts to produce this report. In compiling this report, Core Property’s views remain fully independent of influence or conflicts of interest. Our team of analysts undertake an objective analysis of the offer and conclusions are presented to senior officers for review. The company specified in the Report (the “Participant”) has provided Core Property with information about its activities. Whilst the information contained in this publication has been prepared with all reasonable care from sources that Core Property believes are reliable, no responsibility or liability is accepted by Core Property for any errors, omissions or misstatements however caused. Any opinions, forecasts or recommendations reflects the judgement and assumptions of Core Property as at the date of publication and may change without notice. Core Property and the Participant, their officers, agents and employees exclude all liability whatsoever, in negligence or otherwise, for any loss or damage relating to this document to the full extent permitted by law. This publication is not and should not be construed as, personal financial product advice, an offer to sell or the solicitation of an offer to purchase or subscribe for any investment. Any opinion contained in the Report is unsolicited general information (general financial product advice) only. Neither Core Property nor the participant is aware that any recipient intends to rely on this Report or of the manner in which a recipient intends to use it. In preparing our information, it is not possible to take into consideration the investment objectives, financial situation or particular needs of any individual recipient. Investors should obtain individual financial advice from their investment advisor to determine whether opinions or recommendations (if any) contained in this publication are appropriate to their investment objectives. Investors should obtain a copy of, and consider the PDS/ Information Memorandum, which can be obtained by contacting the issuer. This publication is not for public circulation or reproduction whether in whole or in part and is not to be disclosed to any person other than the intended recipient, without obtaining the prior written consent of Core Property. This report is intended for the residents of Australia. It is not intended for any person(s) who is resident of any other country. Core Property and/or the Participant, their officers, employees or its related bodies corporate may, from time to time hold positions in any securities included in this Report and may buy or sell such securities or engage in other transactions involving such securities. Core Property and the Participant, their directors and associates declare that from time to time they may hold interests in and/or earn brokerage, fees or other benefits from the securities mentioned in this publication. Core Property discloses that from time to time it or its officers, employees and related bodies corporate may have an interest in the securities, directly or indirectly, which are the subject of these statements and/or recommendations (if any) and may buy or sell securities in the companies mentioned in this publication; may effect transactions which may not be consistent with the statements and/or recommendations (if any) in this publication; may have directorships in the companies mentioned in this publication; and/or may perform paid services for the companies that are the subject of such statements and/or recommendations (if any). However, under no circumstances has Core Property been influenced, either directly or indirectly, in making any statements and/or recommendations (if any) contained in this Report. The information contained in this publication must be read in conjunction with the Legal Notice that can be located at http://www.coreprop.com.au/Public/Disclaimer. For more information regarding our services please refer to our website www.coreprop.com.au. Copyright © 2017 Core Property Research Pty Ltd 18
You can also read