JANUARY 2020 - Texas Comptroller
←
→
Page content transcription
If your browser does not render page correctly, please read the page content below

J A N UA RY 2 0 2 0
GLENN HEGAR   • TE X AS COMPTROLLER OF PUBLIC ACCOUNTS

A FIELD GUIDE TO THE TAXES OF TEXAS
S TAT E TA X C O L L E C T I O N S A N D P E R S O N A L I N C O M E
The data represented in this report is available in accessible data form (Excel). F I S C A L 2 010 - 2 01 9
Cumulative Growth Rates
E very year, the state of Texas collects billions of dollars in state taxes and fees, State tax collections saw slightly higher cumulative growth rates than Texas personal income from fiscal 2010 through
federal receipts and other sources of revenue. These funds are used to pay 2014 then saw a decline in 2016 due to franchise tax cuts and a slowdown in the oil and gas industries. Tax collections
saw a rebound in 2018 mostly due to increased remittances from taxpayers in the oil and gas industries, followed by
for all of the responsibilities of the state government, including the education of moderate growth in 2019 as taxable spending in these industries pleateaued.
more than 5 million public school students and the provision of health insurance 57.4%
50 Tax Collections (All Funds, Excluding Trust) Personal Income 57%
for more than 4 million low-income Texans.
40
This guide provides an overview of the major Texas state taxes. Read on to: 30
20
• learn how major taxes have contributed to state revenue during the past 10 years;
10
• see on one page the future revenue estimates, exemption value estimates and tax allocations; and 0
-10
• connect to other in-depth resources about state taxes and finances. 2010 2011 2012 2013 2014 2015 2016 2017 2018 2019
Sources: Texas Comptroller of Public Accounts; U.S. Bureau of Economic Analysis
State Tax Revenue By Source Where Does Texas’ Tax Revenue Come From?
FISCAL 2019
All Funds, Excluding Trusts
% OF While Texas is a relatively low tax state, it does rely on revenue generated by more than 30 different taxes to
TOTAL = $59,380,722,097 TAXES SALES AND USE TAXES fund the functions of state government. Nearly all of this revenue is generated by the following major taxes:
57.3% $34,023,916,225
MOTOR VEHICLE SALES AND RENTAL TAXES • Texas imposes a 6.25 percent sales and use tax • Texas’ severance taxes are imposed on entities
8.4% $5,010,592,018 on sales, leases and rentals of goods, as well as that extract nonrenewable natural resources
MOTOR FUEL TAXES
taxable services such as telecommunications such as oil or natural gas. Revenues from these
6.3% $3,743,004,327
and amusement services. taxes are highly variable and are levied at
FRANCHISE TAX
7.1% $4,217,868,701 rates of 4.6 percent of market value for oil and
• Motor vehicle sales within Texas are also taxed
OIL PRODUCTION TAX condensate, and 7.5 percent of market value for
at 6.25 percent of the sales price, minus any
6.5% $3,886,823,879 natural gas.
trade-in allowance. Motor vehicle rentals are
NATURAL GAS PRODUCTION TAX
2.8% $1,685,680,675 taxed at 6.25 or 10 percent of gross receipts, • The state’s insurance taxes include a number of
INSURANCE TAXES depending on the length of the rental contract. premium taxes levied at rates ranging from 0.5
4.4% $2,599,024,669 percent to 4.85 percent of gross premiums, and
• Texas’ motor fuel tax rates can vary depending
CIGARETTE AND TOBACCO TAXES various maintenance taxes.
2.4% $1,410,390,955 on the type of fuel; the two most common,
ALCOHOLIC BEVERAGES TAXES
gasoline and diesel, are both taxed at 20 cents • Texas’ “sin” taxes are levied on tobacco and
2.3% $1,369,402,271 per gallon. alcoholic beverage products, the largest of
HOTEL OCCUPANCY TAX which are the cigarette tax – levied at $1.41
• The state’s franchise tax is imposed on certain
1.1% $636,110,128 per pack of 20 – and the mixed beverage
kinds of businesses operating in Texas such as
UTILITY TAXES taxes, which are imposed on consumers at
0.8% $471,361,566 corporations, banks, LLCs and partnerships. Of
8.25 percent of the sales price and on business
Overall, Texas’ tax revenue increased by 6.8 percent in fiscal OTHER TAXES the millions of businesses across the state, only
permit holders at 6.7 percent of gross receipts.
2019 to $59.4 billion, with sales, franchise, oil and natural gas pro- 0.5% $326,546,683 around 130,000 filers usually owe any tax.
duction taxes, posting significant gains over the previous year. Source: A nnual Cash Report 2019, Texas Comptroller of
Public Accounts
Note: P ercentages do not sum to 100.0 due to rounding.
2 G L E N N H E G A R • TE X AS COMPTROLLER OF PUBLIC ACCOUNTS 3
Where Does Texas’ Tax Revenue Go? Want More Details?
For accounting and budgeting purposes, state revenue the SHF. Over the 2020-21 BIENNIUM, the Comptroller’s The Comptroller’s office publishes many reports that assist state government planning and decision-making
is deposited or transferred into various funds, with office estimates the SHF will receive $28.9 BILLION from and account for state spending to the taxpayers of Texas. This guide highlights some of the current data from
most going into the General Revenue Fund (GR) to be all sources. several of these reports, and provides links to find more in-depth or updated data. The full reports can be found
appropriated by the Legislature. However, some tax revenue at comptroller.texas.gov/transparency/reports.
is deposited directly or transferred into special funds for The PTRF is used, along with GR and other funds, to
KEY TO SOURCES, PAGES 6-17
specific purposes. Three of the state’s more prominent finance the state’s K-12 public education system. The
special revenue funds are the State Highway Fund (SHF), major revenue sources for this fund include the amount of
the Property Tax Relief Fund (PTRF) and the Economic franchise tax collections generated by its restructuring in
Stabilization Fund (ESF). fiscal 2006, and revenue generated from the $1.00 increase
in the cigarette tax rate implemented in fiscal 2007. Over
SOURCES OF REVENUE
The SHF is used for the construction, maintenance and the 2020-21 BIENNIUM, the Comptroller’s office estimates
policing of public roads. Historically, the primary revenues the PTRF will receive $4.1 BILLION from all sources.
for this fund have been federal receipts, 75 percent
of motor fuel tax net collections, most motor vehicle The ESF, also known as the Rainy Day Fund, receives
ANNUAL CASH REPORT
registration fees and — since fiscal 2015 — one-half of one-half of 75 percent of oil production and natural gas
75 percent of oil production and natural gas production production tax revenues in any fiscal year that exceed BIENNIAL REVENUE ESTIMATE/
CERTIFICATION REVENUE ESTIMATE
tax revenues that in any fiscal year exceed fiscal 1987 fiscal 1987 collections, and one-half of any unencumbered
collections. A constitutional amendment approved by GR surplus remaining at the end of each biennium. By the
voters in 2015 allocated the first $2.5 billion of state sales end of fiscal 2021, the total ending balance of the ESF
tax collections in excess of $28.0 billion in a fiscal year is projected to reach $9.4 BILLION , assuming no new
to the SHF beginning with fiscal 2018. Starting in fiscal appropriations are made from the fund during the 2020-21
2020, 35 percent of motor vehicle sales and rental taxes BIENNIUM . This balance would represent 49.8 PERCENT of
collections in excess of $5.0 billion will be transferred into the cap, as set by the Constitution.
TAX EXEMPTIONS & TAX INCIDENCE
State Highway Fund (SHF)
FISCAL 2018 FISCAL 2019 FISCAL 2020 FISCAL 2021
ACTUAL ACTUAL ESTIMATED ESTIMATED
Total State Revenue $6,259,256,738 $10,242,128,825 $9,027,948,000 $9,012,029,000
Net State Revenue By Source
Total Federal Income $3,828,212,673 $3,967,417,806 $5,619,546,000 $5,246,579,000 Non-Tax Revenue
F I S C A L 2 01 9 • A L L F U N D S , E X C L U D I N G T R U S T S
Total Revenue $10,087,469,412 $14,209,546,631 $14,647,494,000 $14,258,608,000
CHANGE The state’s major non-tax revenue sources are
FROM
Property Tax Relief Fund (PTRF) SOURCE REVENUE FISCAL 2018 federal income, fees and licenses, state health-
Tax Collections $59,380,722,097 6.8% related fees and rebates, state lottery proceeds,
Federal Income $41,904,474,352 5.8% land income and proceeds from the state’s
FISCAL 2018 FISCAL 2019 FISCAL 2020 FISCAL 2021
Licenses, Fees, Fines and Penalties $6,542,086,693 1.0%
investments.
ACTUAL ACTUAL ESTIMATED ESTIMATED
Total Revenue $1,641,074,267 $2,099,387,384 $2,020,150,000 $2,111,169,000 State Health Service Fees
and Rebates $7,087,931,884 -6.7% Taxes That Texas Does Not Levy
Net Lottery Proceeds $2,510,143,199 12.6% Texas does not collect a state property tax.
Economic Stabilization Fund (ESF)
Land Income $2,251,225,581 9.2% Property taxes are levied by local governmental
Interest and Investment Income $2,504,408,847 35.4% entities, school districts and special purpose
FISCAL 2018 FISCAL 2019 FISCAL 2020 FISCAL 2021
Settlements of Claims $646,534,920 18.8% districts (see p. 20).
ACTUAL ACTUAL ESTIMATED ESTIMATED
Ending Cash Balance $8,702,426,768 $6,834,118,067 $2,006,103,563 $2,402,911,229
Escheated Estates $693,354,839 9.0% Texans pay only federal and not state or local
Sales of Goods and Services $278,865,166 -2.2% income taxes. Federal dollars contributed
Ending Invested Balance $2,340,988,696 $3,255,348,755 $5,823,827,849 $6,950,000,248
Other Revenue $4,141,654,757 26.2% almost one-third of total state net revenues
Total Ending Balance $11,043,415,464 $10,089,466,822 $7,829,931,412 $9,352,911,477
in fiscal 2019.
Total Net Revenue $127,941,402,334 6.5%
ESF Cap $16,868,457,433 $16,868,457,433 $18,797,980,184 $18,797,980,184
4 G L E N N H E G A R • TE X AS COMPTROLLER OF PUBLIC ACCOUNTS 5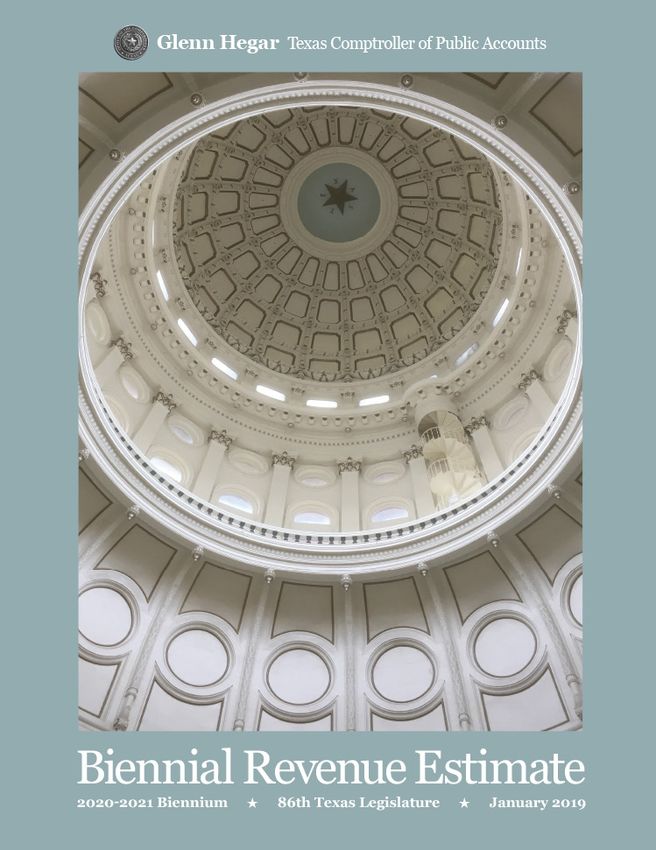
SALES AND USE TAXES
HIGHLIGHTS:
E N AC T E D I N 19 61 COLLECTIONS
All Funds, Excluding Trusts (billions)
Sales and use taxes are the state’s single
largest source of tax revenue, raising $40
about 57 cents of every state tax dollar $36.85 REVENUE
in fiscal 2019. The sales tax is levied on FISCAL 2019
$ 34.02B
transactions. In general, it is imposed on $30
final sales, rentals and leases of tangible
personal property — physical goods or
$20
their classified equivalent — and on sales
of certain services, such as the repair of
tangible personal property, amusements $10
and telephone services.
A constitutional amendment, approved
in 2015, requires up to $2.5 billion to be $0
2009 2010 2 011 2 012 2 013 2 014 2 015 2 016 2 017 2 018 2 019 2 020 2 021
transferred to the State Highway Fund
ACTUAL ESTIMATED
from net sales tax revenue in excess of $28
billion, beginning in fiscal 2018. R E V E N U E BY S O U R C E H I S T O R I C A L VO L AT I L I T Y
The passage of House Bill 1525 by the
86th Legislature, requiring online mar- TAX FUND FISCAL 2019
Year-over-year Change, All Funds, Excluding Trusts STATE RATE
6.25%
ketplace providers to collect taxes on sales 1
General Revenue Fund $22,247,552,155 Compound Annual Growth Rate (Fiscal 2009-2019): 4.9%
made through their platforms, is projected
Limited Sales and Use Tax GR Account - Emissions
to result in an estimated additional $550
Reduction Plan2 $77,532,476 15.0
million in 2020-21 sales tax collections. 12.6%
This revenue will be deposited outside of Prepayments of Limited Sales 10.5%
and Use Tax General Revenue Fund $11,563,813,014 10.0 9.4%
the General Revenue Fund to the newly
7.2% 6.5%
created Tax Reduction and Excellence in General Revenue Fund $75,603,603 5.6% 5.6% LOCAL RATE
5.0
UP TO 2%
Education Fund. Boat and Boat Motor Sales GR Account - Game, Fish,
and Use Tax3 and Water Safety $3,836,601 2.3%
Percentage of Motor Fuel Lubricants Sales Tax State Highway Fund $43,200,008
0.0
Total Tax Collection Limited Sales and -5.0 -2.3%
F I S C A L 2 01 9 FEDERAL RATE
Use Tax - State4 General Revenue Fund $12,045,073
All Funds, Excluding Trusts
$34 BILLION
Fireworks Tax5
Interest on Retail Credit Sales
GR Account - Rural
Volunteer Fire
Department Insurance
General Revenue Fund
$2,157
$274,012
-10.0
FISCAL
-6.6%
2 010 2 011 2 012 2 013 2 014 2 015 2 016 2 017 2 018 2 019
NONE
SALES AND USE TAXES
Discount for Sales Tax - State MAJOR EXEMPTIONS7
Agencies and Higher Education General Revenue Fund $57,127
TOTAL 6 $34,023,916,225.05
Items taxed under other Texas tax laws, including insurance premiums, motor vehicles and WHO PAYS?7
motor fuels; items used in manufacturing products for sale, including materials that become part
of the manufactured product; groceries, school lunches and other food sales. BUSINESS
42.4%
FOOTNOTE S
1 T axes on certain sporting goods sales are appropriated for Texas Parks and Wildlife
57.3% Department and the Texas Historical Commission from the General Revenue Fund. For
additional information on special allocations, refer to the Sources of Revenue report. RANK EXEMPTION FISCAL 2020 EST. VALUE (BILLIONS)
2 Revenue from a 1.5 percent diesel equipment surcharge.
3 C ounty tax assessor-collectors or the Texas Parks and Wildlife Department may retain 1 Total for items taxed by other law $16.7
5 percent.
4 This amount represents the taxes collected on sales made by state agencies, departments,
2 Property used in manufacturing $11.6
institutions, universities and colleges. CONSUMER
3 Food and food products $3.4
57.6 %
5 The 2 percent additional sales tax levied on fireworks was eliminated effective Sept. 1, 2015;
an equivalent amount is now transferred to GR Account – Rural Volunteer Fire Department
Insurance from General Revenue. Total Value of All Exemptions, Exclusions and Discounts
6 May not sum to total due to rounding.
7
(includes other exemptions)=
E stimated values of major exemptions in fiscal 2020 and initial distribution of total limited
sales and use tax revenue in fiscal 2021, as projected in the November 2018 Tax Exemptions
and Tax Incidence report.
$46 BILLION
6 G L E N N H E G A R • TE X AS COMPTROLLER OF PUBLIC ACCOUNTS 7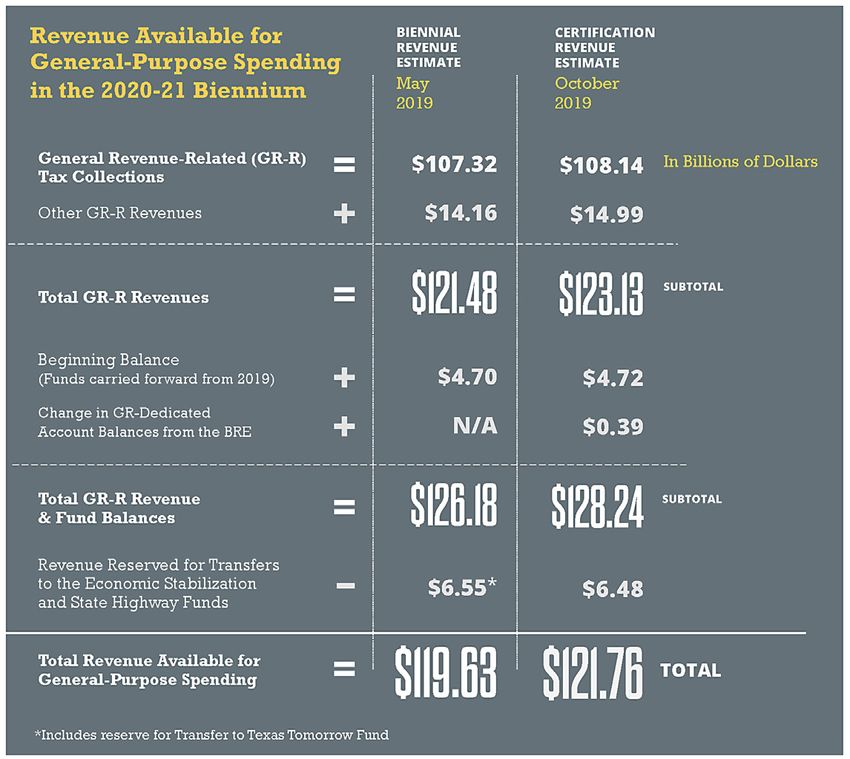
MOTOR VEHICLE SALES AND RENTAL TAXES
HIGHLIGHTS:
E N AC T E D I N 19 41 COLLECTIONS
All Funds, Excluding Trusts (billions)
The motor vehicle sales and use tax, the
largest tax in this category, is imposed $6
on the retail sales price, less trade-in
$5.13
REVENUE
allowance, of motor vehicles sold in Texas. $5 FISCAL 2019
$ 5.01B
The motor vehicle rental tax is levied as
a percent of gross receipts derived from $4
the rental of vehicles, with a varying rate
depending on the length of the rental. $3
In November 2015, voters approved
$2
a constitutional amendment to deposit
35 percent of the net revenue from these $1
taxes above $5 billion to the State Highway
Fund, beginning in fiscal 2020. The $0
2009 2010 2011 2012 2013 2014 2015 2016 2017 2 018 2 019 2 02 0 2 02 1
transfer is projected to be $5.69 million
ACTUAL ESTIMATED
in fiscal 2020, and $29.16 million in
fiscal 2021. R E V E N U E BY S O U R C E H I S T O R I C A L VO L AT I L I T Y
Year-over-year Change, All Funds, Excluding Trusts STATE RATE
TAX FUND FISCAL 2019
6.25%
General Revenue Fund1 $4,447,838,656 Compound Annual Growth Rate (Fiscal 2009-2019): 6.8% 6
Motor Vehicle Sales and Use Tax Property Tax Relief Fund2 $24,656,342 20% 19.5%
GR Account - Emissions
Reduction Plan3 $19,012,678 15%
13.2%
Motor Vehicle Rental Tax General Revenue Fund $329,492,069
10% 9.0% 9.7% LOCAL RATE
8.5%
General Revenue Fund $163,274,436 7.2%
NONE
Motor Vehicle Sales and Use Tax –
Seller-Financed Motor Vehicles GR Account - Emissions 5%
Percentage of Reduction Plan3 $30,860 2.3%
1.1% 0.7%
Total Tax Collection Manufactured Housing Sales 0%
F I S C A L 2 01 9
and Use Tax General Revenue Fund $26,286,778 FEDERAL RATE
NONE
Motor Vehicle Sales and -1.8%
-5%
All Funds, Excluding Trusts Use Tax - Motor Carriers 4 General Revenue Fund $200
$5 BILLION TOTAL 5 $5,010,592,018
FISCAL 2 010 2 011 2 012 2 013 2 014 2 015 2 016 2 017 2 018 2 019
MOTOR VEHICLE SALES & RENTAL TAXES
1
FOOTNOTE S
M A J O R E X E M P T I O N S7
S ince fiscal 2015, 95 percent of revenue is deposited into the General Revenue Fund; the
2
remaining 5 percent is retained by counties.
Motor vehicles, trailers and semi-trailers used for interstate commerce; sales to or use by WHO PAYS?7
Revenue derived from the tax based on a used vehicle’s presumptive value is deposited into
8.4% the Property Tax Relief Fund. public agencies; farm machines, trailers, semi-trailers used primarily for farming,
BUSINESS
40.2%
3 100 percent of applicable surcharge is required to be transferred into GR Account – ranching or timber operations.
Emissions Reduction Plan.
4 Repealed by S.B. 3, 74th Leg., R.S. effective Sept. 1, 1997.
5 May not sum to total due to rounding. RANK EXEMPTION FISCAL 2020 EST. VALUE (MILLIONS)
6 The 6.25 percent sales and use tax is based on the vehicle sales price less any trade-in.
Additional taxes or surcharges may apply to the sale of certain diesel trucks. Rentals: 10 Vehicles used for interstate
percent of gross receipts on rentals of 30 days or less, 6.25 percent on rentals of 31 to 180 1 $100.1
days. Manufactured housing sales: 5 percent of 65 percent of the sales price on the initial
commerce
sale or use of a new manufactured home.
2 Sales to or use by a public agency $49.5 CONSUMER
59.8 %
7 E stimated values of major exemptions in fiscal 2020 and initial distribution of total motor
vehicle sales tax revenue in fiscal 2021, as projected in the November 2018 Tax Exemptions
and Tax Incidence report. 3 Farm or timber use $43.3
Total Value of All Exemptions (includes other exemptions)=
$205 MILLION
8 G L E N N H E G A R • TE X AS COMPTROLLER OF PUBLIC ACCOUNTS 9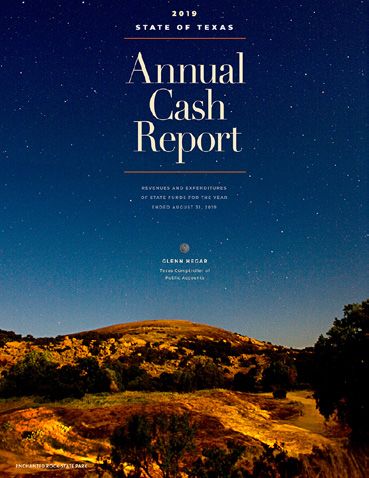
MOTOR FUEL TAXES
HIGHLIGHTS:
E NAC TE D 19 2 3 COLLECTIONS
All Funds, Excluding Trusts (billions)
Motor fuel taxes consist of the state’s
consumption taxes on gasoline, diesel $3.87
fuel and liquefied and compressed
$4
REVENUE
natural gas. In general, these taxes are FISCAL 2019
$ 3.74B
charged on each gallon of fuel sold in $3
Texas used to propel vehicles on Texas’
public roads.
$2
The rates for the gasoline and diesel
fuel taxes were last changed in 1991,
when they were both increased from $1
$0.15 per gallon.
$0
2 0 09 2 010 2 011 2 012 2 013 2 014 2 015 2 016 2 017 2 018 2 019 2 02 0 2 02 1
ACTUAL ESTIMATED
R E V E N U E BY S O U R C E H I S T O R I C A L VO L AT I L I T Y
Year-over-year Change, All Funds, Excluding Trusts GASOLINE TAX
TAX FUND FISCAL 2019
Gasoline Tax1 General Revenue Fund $2,789,006,176 Compound Annual Growth Rate (Fiscal 2009-2019): 2.1% STATE RATE
$0.20
2 4
Diesel Fuel Tax General Revenue Fund $948,047,468
Liquefied and Compressed 4 3.9%
Natural Gas Tax 2 General Revenue Fund $5,950,683 PER
PER
GALLON
GALLON
TOTAL 3 $3,743,004,327 3 2.9%
2.5% LOCAL RATE
NONE
2.0% 2.1% 2.0% 2.0%
2 1.9%
Percentage of 1
FOOTNOTE S
1.6%
fter deductions for refunds and other purposes, 25 percent is allocated to the Available
A
Total Tax Collection School Fund; 50 percent is allocated to the State Highway Fund; and the remaining 25 percent
F I S C A L 2 01 9 is also deposited to the State Highway Fund, except that the first $7.3 million is deposited to 1
the County and Road District Highway Fund. FEDERAL RATE
0.3%
$0.184
All Funds, Excluding Trusts 2 After deductions for refunds, 25 percent is allocated to the Available School Fund, and 75
5
percent is allocated to the State Highway Fund. 0
$3.74 BILLION 3 May not sum to total due to rounding. PER
GALLON
4 T his rate is for gasoline and diesel fuel (eligible transit companies qualify for a refund of 1 FISCAL 2 010 2 011 2 012 2 013 2 014 2 015 2 016 2 017 2 018 2 019
MOTOR FUEL TAXES cent per gallon on gasoline and 1/2 cent per gallon on diesel fuel). A 15 cents-per-gallon rate
exists for liquefied natural gas (LNG) and compressed natural gas (CNG).
5 The federal tax rate for diesel fuel is $0.244 per gallon.
6 E stimated values of major exemptions in fiscal 2020 and initial distribution of total gasoline M A J O R GA S O L I N E TA X E X E M P T I O N S 6 WHO PAYS? 6
tax revenue in fiscal 2021, as projected in the November 2018 Tax Exemptions and Tax
Incidence report. Collection allowances for licensed distributors, importers or suppliers that make timely tax
BUSINESS
21.1%
payments; refunds for taxes paid on gasoline for off-road use.
6.3%
RANK EXEMPTION FISCAL 2020 EST. VALUE (MILLIONS)
1 Collection allowances $57.8
2 Marine use $29.5
Industry and CONSUMER
3 $25.7
78.9 %
commercial use
Total Value of All Gasoline Tax Exemptions, Refunds and Discounts
(includes other exemptions, refunds and discounts)=
$132.9 MILLION
10 G L E N N H E G A R • T E X A S C O M P T R O L L E R O F P U B L I C A C C O U N T S 11
FRANCHISE TAX
HIGHLIGHTS:
E NAC TE D 19 07 COLLECTIONS
All Funds, Excluding Trusts (billions)
The franchise, or margins tax is one of
the state’s oldest taxes, though it has been $5
significantly reformed in recent years. $4.49 REVENUE
Levied for the privilege of doing business $4 FISCAL 2019
in Texas, the tax due is based on an
$ 4.22B
entity’s apportioned taxable margin.1 $3
In 2006, the Legislature made
significant changes to the tax, including
$2
transitioning to the taxable margin as
the sole base component and expanding
$1
the tax to limited partnerships, business
trusts and other legal entities.
In 2015, the Legislature voted to $0
2009 2010 2 011 2 012 2 013 2 014 2 015 2 016 2 017 2 018 2 019 2 02 0 2 02 1
reduce franchise tax rates by 25 percent. ACTUAL ESTIMATED
R E V E N U E BY S O U R C E H I S T O R I C A L VO L AT I L I T Y
Year-over-year Change, All Funds, Excluding Trusts
STATE RATE
FISCAL 2019
0.75%/
TAX FUND
General Revenue Fund2 $2,960,324,289 Compound Annual Growth Rate (Fiscal 2009-2019): -0.1%)
Franchise/
3 20
Margins Tax Property Tax Relief Fund $1,255,722,701
16.1%
Franchise Tax General Revenue Fund4 $1,821,711 15 13.7% 14.4%
.375%
10 6
TOTAL 5 $4,217,868,701
5 5.1%
2.0%
FOOTNOTE S
0
1 Taxable margin is defined as the total revenue less the greater of (1) the cost of goods sold,
Percentage of (2) total compensation, (3) 30 percent of total revenue, or (4) $1 million. An apportionment -5 -1.4% -1.6% LOCAL RATE
factor based on the portion of receipts that occured in Texas is then applied.
Total Tax Collection
F I S C A L 2 01 9
2
3
T he estimated amount of franchise tax revenues that would have been generated had the
2006 reforms not occurred.
ll revenue exceeding the estimated amount that would have been brought in under the
A
-10
-15
-9.3%
NONE
All Funds, Excluding Trusts previous version of the franchise tax.
-20 -16.6% -16.5% FEDERAL RATE
$4.22 BILLION
NONE
4 eflects net payments and refunds related to franchise tax liability from reports due before
R 7
the 2008 tax year. FISCAL 2 010 2 011 2 012 2 013 2 014 2 015 2 016 2 017 2 018 2 019
5 May not sum to total due to rounding.
FRANCHISE TAX 6 A tax rate of 0.375 percent applies to taxpayers in the retail or wholesale trade, and a rate
of 0.75 percent applies to other taxpayers. Firms with less than $20 million in total revenues
may elect to file an EZ return. The tax rate for EZ filers is 0.331 percent. MAJOR EXEMPTIONS8
7 T here is no federal franchise tax; however, a corporate income tax is levied at 21 percent of
net income. Reduced tax rates for eligible retail or wholesale businesses; certain nonprofits that are exempt WHO PAYS? 8
8 E stimated values of major exemptions in fiscal 2020 and initial distribution of total franchise
from federal income tax; small businesses under the no tax due thresholds.
tax revenue in fiscal 2021, as projected in the November 2018 Tax Exemptions and Tax
FISCAL 2020 EST. VALUE BUSINESS
100%
Incidence report.
RANK EXEMPTION (MILLIONS)
Reduced rate for eligible
1 $604.9
7.1% retail/wholesale entities
Nonprofit corporations exempt
2 $330.8
from federal income tax
CONSUMER
0%
3 Small business exception $246.1
Total Value of All Deductions,
Exclusions, Special Accounting Methods and Credits and Refunds (includes others)=
$2.46 BILLION
12 G L E N N H E G A R • T E X A S C O M P T R O L L E R O F P U B L I C A C C O U N T S 13
OIL PRODUCTION TAX
HIGHLIGHTS:
E NAC TE D 19 0 5 COLLECTIONS
All Funds, Excluding Trusts (billions)
The oil production tax is a severance tax
on the removal of crude oil from Texas $5
land. The rate has remained unchanged REVENUE
since 1951, longer than any other major $3.95 FISCAL 2019
$4
state tax.
$ 3.89B
Twenty-five percent of the revenue $3
from this tax is allocated to the Foundation
School Account, with the remaining amount
$2
deposited into General Revenue. Portions
of the amount deposited into General
$1
Revenue may be transferred to the
Economic Stabilization Fund and the State
Highway Fund. In 2015, the Legislature $0
2 0 09 2 010 2 011 2 012 2 013 2 014 2 015 2 016 2 017 2 018 2 019 2 02 0 2 02 1
repealed the oil regulation tax. ACTUAL ESTIMATED
R E V E N U E BY S O U R C E H I S T O R I C A L VO L AT I L I T Y
Year-over-year Change, All Funds, Excluding Trusts STATE RATE
TAX FUND FISCAL 2019
4.6%
1 Compound Annual Growth Rate (Fiscal 2009-2019): 16%
Oil Production Tax General Revenue Fund $3,886,822,399 70% 4
Oil Regulation Tax 2 General Revenue Fund $1,479 60% 60.9%
50% OF
46.0% 42.8% 42.2% MARKET
TOTAL 3 $3,886,823,879
40% VALUE
30% 29.5%
23.6%
20%
14.0% 14.6% LOCAL RATE
FOOTNOTE S
NONE
10%
1 T wenty-five percent is statutorily dedicated to public education funding and allocated to the
0%
Percentage of 2
Foundation School Account.
The 0.1875 cents-per-barrel oil regulation tax was abolished effective Sept. 1, 2015. -10%
Total Tax Collection 3 May not sum to total due to rounding. -20%
F I S C A L 2 01 9 4 Or 4.6 cents on each barrel for oil production, whichever is greater. FEDERAL RATE
-30%
NONE
5 E stimated values of major exemptions in fiscal 2020 and initial distribution of total oil -25.7%
All Funds, Excluding Trusts production tax revenue in fiscal 2021, as projected in the November 2018 Tax Exemptions and -40%
Tax Incidence report. -50% -40.8%
$3.89 BILLION
FISCAL 2 010 2 011 2 012 2 013 2 014 2 015 2 016 2017 2018 2019
OIL PRODUCTION TAX
MAJOR EXEMPTIONS5
Special tax rate for wells approved as enhanced oil recovery projects; WHO PAYS? 5
10-year exemption for wells certified as inactive.
BUSINESS
100%
RANK EXEMPTION FISCAL 2020 EST. VALUE (MILLIONS)
New or expanded
1 $45.4
enhanced recovery project
Enhanced recovery
6.5% projects using
2 $2.7
anthropogenic carbon CONSUMER
0%
dioxide
3 Inactive wells $0.2
Total Value of All Exemptions =
$48.3 MILLION
14 G L E N N H E G A R • T E X A S C O M P T R O L L E R O F P U B L I C A C C O U N T S 15
NATURAL GAS PRODUCTION TAX
HIGHLIGHTS:
E N AC T E D 19 31 COLLECTIONS
All Funds, Excluding Trusts (billions)
Natural gas production is taxed as part
of Texas' severance tax structure, which $3
taxes the removal of natural resources
REVENUE
from the state. FISCAL 2019
Twenty-five percent of the revenue
$2
$1.69B
from this tax is allocated to the
$1.58
Foundation School Account, with the
remaining amount deposited into General
Revenue. Portions of the amount deposited $1
into General Revenue may be transferred
to the Economic Stabilization Fund and
the State Highway Fund.
$0
2 0 09 2 010 2 011 2 012 2 013 2 014 2 015 2 016 2 017 2 018 2 019 2 02 0 2 02 1
ACTUAL ESTIMATED
R E V E N U E BY S O U R C E H I S T O R I C A L VO L AT I L I T Y
Year-over-year Change, All Funds, Excluding Trusts STATE RATE 3
TAX FUND FISCAL 2019
7.5%
Natural Gas Production Tax General Revenue Fund1 $1,685,680,675 Compound Annual Growth Rate (Fiscal 2009-2019): 1.8%
70 69.8%
TOTAL 2 $1,685,680,675
60
53.0%
50 45.6%
FOOTNOTE S 40 38.3%
1 Twenty-five percent is statutorily dedicated to public education funding and allocated to the
30 27.0% LOCAL RATE
NONE
Foundation School Account. 20 17.8%
2 M ay not sum to total due to rounding.
10
Percentage of 3 Tax rate for condensate is 4.6 percent.
0
Total Tax Collection 4 E stimated values of major exemptions in fiscal 2020 and initial distribution of total natural gas
production tax revenue in fiscal 2021, as projected in the November 2018 Tax Exemptions and
-10 -2.6%
F I S C A L 2 01 9 Tax Incidence report. -20 FEDERAL RATE
NONE
-30
All Funds, Excluding Trusts -40 -32.6%
$1.69 BILLION -50
-48.5%
-60
-54.8%
NATURAL GAS PRODUCTION TAX
FISCAL 2 010 2 011 2 012 2 013 2 014 2 015 2 016 2 017 2 018 2 019
WHO PAYS? 4
MAJOR EXEMPTIONS4
BUSINESS
100%
Reduced tax rates applied for approved “high-cost” gas wells based upon drilling and
completion costs for each well; exemptions applied for low-producing gas wells that
had production of 90 mcf per day.
RANK EXEMPTION FISCAL 2020 EST. VALUE (MILLIONS)
1 High-cost natural gas $272.8
CONSUMER
0%
2.8% 2 Qualifying low-producing gas wells $73.3
16 G L E N N H E G A R • T E X A S C O M P T R O L L E R O F P U B L I C A C C O U N T S 17
ADDITIONAL STATE TAXES
COLLECTIONS P E R C E N TAG E O F T O TA L TA X C O L L E C T I O N S
F I S C A L 2 0 0 9 - 2 0 21 F I S C A L 2 01 9
All Funds, Excluding Trusts (billions) All Funds, Excluding Trusts
% OF
$3.0 INSURANCE TAXES TAXES
$2,599,024,669 4.4%
$2.5 CIGARETTE AND T0BACCO TAXES
$1,410,390,955 2.4%
ALCOHOLIC BEVERAGES TAXES
$2.0
$1,369,402,271 2.3%
HOTEL OCCUPANCY TAX
$1.5
$636,110,128 1.1%
UTILITY TAXES
$1.0
$471,361,566 0.8%
OTHER TAXES
$0.5 $326,546,683 0.5%
$0
2 0 09 2010 2011 2012 2013 2014 2015 2016 2017 2 018 2 019 2 020 2 021
ACTUAL E ST I M AT E D
INSURANCE TAXES CIGARETTE AND TOBACCO TAXES ALCOHOLIC BEVERAGES TAXES UTILITY TAXES
Insurance taxes include premium taxes and more than a dozen Cigarette and tobacco taxes include the cigarette tax and the cigar Alcoholic beverage taxes consist of separate excise taxes on the Utility taxes are a group of three related revenue sources,
maintenance taxes collected on behalf of the Texas Department of and tobacco products taxes. first sale in Texas of liquor, beer, wine and malt liquor (also known including the gas, electric and water utility tax; the public utility
Insurance. Insurance premium taxes generally apply to premiums as ale); and the mixed beverage gross receipts tax and mixed gross receipts assessment; and the gas utility pipeline tax.
paid on insurance that covers risk located in Texas. FISCAL 2019 REVENUE: $1.41 BILLION beverage sales tax on alcoholic beverages sold to consumers by
mixed beverage and private club permittees. FISCAL 2019 REVENUE: $0.47 BILLION
FISCAL 2019 REVENUE: $2.6 BILLION TAX RATE
Cigarettes $70.50 per 1,000 cigarettes weighing 3 FISCAL 2019 REVENUE: $1.37 BILLION TAX RATE
TAX RATE pounds or less ($1.41 per pack of 20) Gas, electric and water utility Cities 1,000-2,499 population –
Life insurance and HMO 0.875% of the first $450,000 Cigars and tobacco Cigars weighing 3 pounds or less per 1,000 – TAX RATE 0.581% of gross receipts
1.75% in excess of $450,000 products 1 cent for each 10 cigars Beer $6.00 per 31-gallon barrel Cities 2,500-9,999 population –
Property and casualty insurance 1.6% Cigars weighing more than 3 pounds per 1,000 (19.4¢ per gallon) 1.070% of gross receipts
Accident and health insurance 1.75% and retailing for not more than 3.3 cents each – Liquor $2.40 per gallon Cities ≥10,000 population –
$7.50 per 1,000 Wine Alcohol volume ≤14% – 20.4¢ per 1.997% of gross receipts
Unauthorized, independently 4.85%
procured and surplus lines Cigars weighing more than 3 pounds per gallon; >14% – 40.8¢ per gallon; Public utility gross receipts One-sixth of 1% of gross receipts
insurance 1,000 and retailing for over 3.3 cents each, Sparkling wine – 51.6¢ per gallon assessment
containing no substantial amount of non- Malt liquor (Ale) 19.8¢ per gallon Gas utility pipeline 0.5% of gross income of
Licensed captive insurance 0.5%
tobacco ingredients – $11 per 1,000 gas utilities
companies Mixed beverage 6.7% of gross receipts
Cigars weighing more than 3 pounds per 8.25% sales tax
Title insurance 1.35% 1,000 and retailing for over 3.3 cents each,
containing a substantial amount of non-
NOTE tobacco ingredients – $15 per 1,000
In 2015, the Legislature eliminated the following taxes: Each can or package of tobacco products HOTEL OCCUPANCY TAX OTHER TAXES
(other than cigars, cheroots or stogies) – $1.22
• Airline/passenger train • Fireworks tax
per ounce and a proportionate rate on all The hotel occupancy tax is imposed on a person who pays for a Other taxes include the cement tax, oil and gas well servicing tax,
beverage tax • Liquefied gas tax
fractional parts of an ounce hotel room or space that costs $15 or more per day. occupation tax, combative sports admissions tax, coin-operated
• Bingo rental tax • Oil regulation tax
amusement machine tax, unemployment assessments and the
• Controlled substances tax • Sulphur tax FISCAL 2019 REVENUE: $0.64 BILLION tax refunds to employers of recipients of Temporary Assistance
• Inheritance tax
RATE for Needy Families.
6% of room rate paid by occupant FISCAL 2019 REVENUE: $0.33 BILLION
18 G L E N N H E G A R • T E X A S C O M P T R O L L E R O F P U B L I C A C C O U N T S 19LOCAL PROPERTY TAXES
E N AC T E D 18 37 L O C A L P R O P E R T Y TA X L E V I E S 1
(billions) MAXIMUM
Property taxes are levied by counties, 70 RATES 5
cities, school districts and special purpose (PER $100 IN PROPERT Y VALUE)
districts such as community colleges and $8.47B
$8.01B
public hospitals. These local entities can 60
levy a property tax by adopting a tax rate
SCHOOL DISTRICTS
$1.17
$10.39 B
with two components: a maintenance and $9.73B
50
operations (M&O) rate, and an interest M&O
and sinking (I&S) rate (also referred to $10.04 B
$9.53B
$0.5 0
as debt service). A separate entity, called 40 6
an Appraisal District, is responsible for I&S
determining the market value of each $34.88 B
$32.13B
property within its respective county. 30
While the state of Texas has not levied
a property tax since 1980, local property
20
values have a direct impact on the state
budget due to the nature of the school CITIES
finance system. 10 GENER AL LAW CITIES 7
(POP. ≤ 5,000)
0 2 0 09 2 010
E N T I T I E S R E P O R T I N G BY T Y P E (2 018) 1
2 011 2 012 2 013 2 014 2015 2016
M A J O R S C H O O L P R O P E R T Y TA X E X E M P T I O N S ,
2017 2018
$1.5 0
HOME RULE C ITIES
■ SPECIAL PURPOSE DISTRICTS - 1,793 DISCOUNTS AND SPEC IAL APPR AISALS 3 (POP. > 5,000)
■ CITIES - 1,075
■ COUNTIES - 254
■ SCHOOL DISTRICTS - 1,017
Valuation of agricultural or timber land at productivity value; various property value
exemptions for residence homesteads and certain veterans; cap on taxes paid by
homeowners age 65 and older or disabled; economic development activity under
Chapter 313; exemption of certain tangible property being transported out of the state
$2.5 0
within 175 days; and the limitation on growth of appraised value.
AV E R AG E P R O P E R T Y TA X R AT E S (2 018) 2
M&O I&S FISCAL 2020
EST. COST COUNTIES
School Districts $1.091 $0.275 RANK EXEMPTIONS (BILLIONS)
Cities $0.409 $0.164 GENER AL FUND
1 Special appraisals for agricultural and timber land $4.097
Counties (General Fund)
1
FOOTNOTE S
$0.316 $0.050
T he figures presented are calculated totals based on data self-reported to the Comptroller’s
office only, not actual total property tax levies. These figures are for 2018 only and are not
2
3
4
Residence homestead exemptions4
School tax ceiling; age 65 and older or disabled
Ch. 313 - Texas Economic Development Act
$3.289
$1.310
$0.752
$0.8 0
FARM-TO-MARKET &
inclusive of changes made in House Bill 3 implemented in tax year 2019. The Comptroller does FLOOD CONTROL
not guarantee the accuracy of self-reported information.
$0.3 0
2
5 Freeport property and cotton stored in warehouses $0.434
Average property tax rates are weighted by calculated property tax levies and only include
entities that reported levying the respective tax to the Comptroller’s office.
3
Limitation on appraised value of residence homesteads
E stimated values of major exemptions in fiscal 2020 as projected in the November 2018 Tax
Exemptions and Tax Incidence report.
6 (10 percent cap) $0.334
4 This includes the cost of both state-mandated value exemptions and local optional value
SPECIAL ROAD
exemptions. Total of All Exemptions and Special Appraisals =
5 Rate limits represent the general rule applied to nearly all applicable entities. There may & BRIDGE
$15.3 BILLION
$0.15
be cases, however, in which some entities can exceed this limit or are subject to a more
restrictive tax rate limit.
6 The "50-cent test" requires school districts to demonstrate to the Attorney General the
ability to pay the principal and interest on any proposed bonds, as well as all outstanding
bonds, from a tax rate not to exceed $0.50.
7 Tax Code Section 302.001 restricts the annual property tax rate set by Type B general law
municipalities to no more than $0.25.
20 G L E N N H E G A R • T E X A S C O M P T R O L L E R O F P U B L I C A C C O U N T S 21LOCAL SALES TAXES
E NAC TE D 19 67 L O C A L S A L E S TA X A L L O C AT I O N S 1
(billions) MAXIMUM
Like the state sales tax, the local sales $10
RATES
tax is imposed on final sales, rentals $0.72B THE SUM OF ALL LOCAL RATES
CANNOT EXCEED 2%.
and leases of tangible personal property
$8.01B
$0.60 B
— physical goods or their classified
$2.11B
2%
equivalent — and on sales of certain $8
services, such as the repair of tangible $9.73B SPECIAL
PURPOSE
personal property, amusements and DISTRICTS
telephone services.
$6 $9.53B
$6.20 B
1.5 %
The local sales tax is collected by
retailers across the state and remitted
to the Comptroller’s office along with $32.13B COUNTIES
the state sales tax. The Comptroller then
$4
1%
distributes the local portion of sales tax
collections to the local governmental TRANSIT
entities each month. ENTITIES
The passage of House Bill 1525 by the $2
2%
86th Legislature requires marketplace
providers to collect local sales taxes based
on delivery location. The passage of House $0 CITIES
Bill 2153 also provides a single local tax 0 2010 2011 2012 2013 2014 2015 2 016 2 017 2 018 2 019
rate for remote sellers. Remote sellers with
total Texas revenue exceeding $500,000 AV E R AG E S A L E S TA X R AT E S 3
E N T I T I E S BY T Y P E 2
are required to collect and remit state and
SPECIAL PURPOSE
local use taxes, and may choose to collect ■ SPECIAL PURPOSE DISTRICTS - 341 DISTRICTS COUNTIES TRANSIT ENTITIES CITIES
the single local tax rate or the local tax
0.59% 0.50% 0.78% 1.36%
based on the total local tax rate in effect at ■ COUNTIES - 124
the destination. The single local tax rate
for 2020 is 1.75 percent. ■ TRANSIT ENTITIES - 10
■ CITIES - 1,161
FOOTNOTE S
1 T hese figures represent sales tax allocations made during each calendar year. Revenue is
allocated to local governments two months after taxes are paid to a business.
2 Entity counts and averages are as of December 11, 2019.
3 Average local sales tax rates are weighted by collection amounts and corresponding tax
rates.
22 G L E N N H E G A R • T E X A S C O M P T R O L L E R O F P U B L I C A C C O U N T S 23BUDGETING AND APPROPRIATIONS
The constitution requires the Comptroller to estimate General Appropriations Act — The Budgeting Process in Brief
the amount of revenue available for general purpose “The Budget”
spending each biennium to fund public services Each state agency prepares a detailed legislative Budget Approval Steps
delivered by state agencies and public colleges and The General Appropriations Act (GAA) is the Texas appropriations request (LAR) itemizing the • The
Texas House Committee on Appropriations and the
universities. state government’s two-year budget. The state funding it is seeking for the upcoming biennium.
constitution requires that this budget be balanced. Senate Finance Committee simultaneously deliberate
Legislators must approve a balanced budget for
State budget writers are also required to limit After several reviews, hearings and approvals, on the general appropriations bill. After the committees
state spending that may be less than, but not exceed,
spending growth from the current budget to the next. the LBB uses the LARs to draft the general pass their versions of the bills, the full House and Senate
the available cash and anticipated revenue as certified
Under this spending limit, the growth rate of spending appropriations bill, which is then submitted to the consider each version of the budget.
by the Comptroller.
from tax revenue not dedicated by the constitution must Legislature.
not exceed the estimated growth of the state’s economy The Governor also submits an independently • A conference committee of both House and Senate
as determined by the Legislative Budget Board (LBB). developed budget to the Legislature. members works to combine the two versions into the
Only majority votes by both the House and Senate can final General Appropriations Act, which is then voted on
Prior to the legislative session, the Comptroller’s
override the spending limit. For the 2020-21 biennium, by both chambers.
office issues the Biennial Revenue Estimate (BRE)
the LBB approved a 9.89 percent cap on spending
of the funds to be available from taxes and other • Once approved, it goes to the Comptroller’s office for
growth.
revenue sources for the biennium. Following final certification that the bill is within cash and
the regular legislative session, the Comptroller
State Spending Decisions anticipated available revenue.
reevaluates this estimate in light of changing
economic conditions, as well as the fiscal impacts • The last step is the Governor’s signature. Once signed,
In recent years, the majority of state expenditures are of any legislative changes. During the 2019
on the following items: the bill becomes law, allocating the state’s funds for two
legislative session, the Comptroller issued a BRE more years. The Governor may veto individual spending
• h ealth and human services programs such as Medicaid, revision in May, increasing amount available
items within the budget.
adult and child protection, and assistance to the disabled for certification by $518 million. A Certification
Revenue Estimate (CRE) is published early in the
and those in poverty;
new biennium giving lawmakers an updated
• p ublic education spending that supplements local property picture of the state’s expected fiscal condition
tax revenues; during the two-year budget cycle.
• t ransportation, road and bridge maintenance and
construction, and airports;
• higher education;
• law enforcement, courts and prisons;
• state government operations; and
• natural resources and state parks.
.
24 G L E N N H E G A R • T E X A S C O M P T R O L L E R O F P U B L I C A C C O U N T S 25RESOURCES
Monthly Revenue Watch State Spending: Where the Money Goes Certification Revenue Estimate Biennial Revenue Estimate
The Comptroller forecasts the amount of revenue Glenn Hegar Texas Comptroller of Public Accounts
available for spending during the current biennium
based on the anticipated condition of the economy,
incorporating changes to taxes and fees adopted
by the Legislature during the previous session
(October 2019).
Tax Exemptions & Tax Incidence
NOVE M B E R 2 01 8 2 018
Net state revenue collections by source are posted These interactive tools on the Comptroller’s website State of Texas
Annual Biennial Revenue Estimate
monthly to the Comptroller’s website. show state spending by agency, purchase code, Tax Exemptions
Cash
2020-2021 Biennium 86th Texas Legislature January 2019
category and more. Report
& Tax Incidence The Comptroller forecasts the amount of revenue
Texas Taxes and Tax Publication webpages Revenues and Expenditures of
State Funds for the Year Ended
Comprehensive Annual Financial Report
august 31, 2018
available for spending each biennium, which
GLENN HEGAR
Legislators then use to craft the state’s budget
Texas Comptroller of
Public Accounts
(January 2019).
Glenn Hegar Texas Comptroller of Public Accounts
State of Texas
Fiscal Size-Up
Comprehensive Annual Financial Report
For the Fiscal Year Ended August 31, 2018
A R E P O R T TO TH E G OV E R N O R
A N D TH E 8 5TH TE X A S LEG I S L AT U R E
G L E N N H E G A R Texas Comptroller of Public Accounts
LEGISLATIVE BUDGET BOARD
This legislatively required report estimates Fiscal Size-up
2018–19 Biennium
The Comptroller’s office maintains extensive online the value of exemptions, exclusions, discounts,
resources on the more than 60 taxes, fees and deductions, special accounting methods, credits,
assessments that the office collects. refunds and special appraisals available under Texas’
major state taxes and school property taxes
State Tax Automated Research (STAR) System This report presents information on all state assets, (November 2018).
liabilities, and revenue and expenditure details for all SUBMITTED TO THE 85TH TEXAS LEGISLATURE
state funds, including those held outside the Texas Sources of Revenue: PREPARED BY LEGISLATIVE BUDGET BOARD STAFF
WWW.LBB.STATE.TX.US SEPTEMBER 2018
This online policy Treasury (February 2019). A History of State Taxes and Fees in Texas
resource center The Legislative Budget Board produces this biennial
facilitates research Texas Annual Cash Report
report: a single source of information on the budget,
Glenn Hegar Texas Comptroller of Public Accounts
on Texas tax law and State of Texas
Sources of Revenue fiscal actions of each Legislature and the state’s fiscal
tax policy. A History of State Taxes and Fees 1972-2018
condition (September 2018).
Texas Tax Code
Providing a historical perspective, this guide reports
Select “Tax code” followed by the desired chapter and This report presents the state’s financial condition, on the current status of state revenue sources
section to see statutes. details revenues and expenditures on a cash basis, and (January 2019).
shows revenue and expenditure details for all funds in
the Texas Treasury (November 2019).
26 G L E N N H E G A R • T E X A S C O M P T R O L L E R O F P U B L I C A C C O U N T S 27This report contains estimates and projections from the
comptroller’s Certification Revenue Estimate – October 2019,
which are based on available information, assumptions and
estimates as of the date of the forecast. Assumptions involve
judgments about future economic and market conditions and
events that are difficult to predict. Actual results could differ
from those predicted, and the difference could be material.
For additional copies, write:
TEXAS COMPTROLLER OF PUBLIC ACCOUNTS
P.O. Box 13528
Austin, Texas, 78711-1440
This report is also available online at
comptroller.texas.gov/transparency/revenue/resources.php .
In compliance with the Americans with Disabilities Act,
this document may be requested in alternative formats
by emailing transparency@cpa.texas.gov.
Glenn Hegar
Te x a s C ompt rol le r of P u bl ic Ac c ou nt s
PUBLICATION # 96-1774 • PRINTED JANUARY 2020You can also read