Commercial Market Insights July 2020 - National Association of REALTORS Research Group - National Association ...
←
→
Page content transcription
If your browser does not render page correctly, please read the page content below
Commercial Market
Insights
July 2020
National Association of REALTORS®
Research Group
Contents

    2           Overview

    6           Multifamily

    11          Industrial

    16          Office

    21          Retail

www.nar.realtor/research-and-statistics
                                          1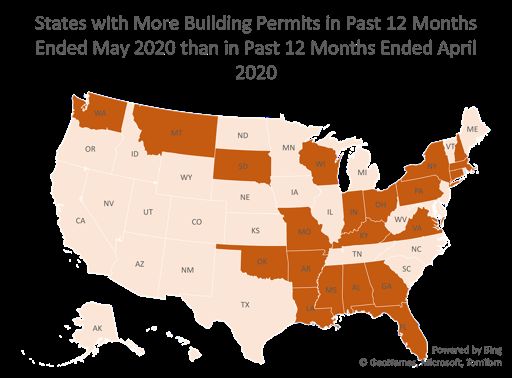
Overview
Investors Still Wary, but Improving Economic Outlook is a Silver Lining

                                                                Sales/Acquisitions of $2.5M and Above
 The commercial real estate sector                                     Properties or Portfolios
 continues to struggle as a result of the
 coronavirus pandemic. The hotel and               60%                                                                 $80.0

                                                                                                                               Billions
 retail property markets are taking the            40%                                                                 $70.0
                                                   20%                                                                 $60.0
 heaviest beating while multi-family and
                                                    0%                                                                 $50.0
 industrial are performing relatively well,       -20%                                                                 $40.0
 with the office sector in the middle of          -40%                                                                 $30.0
 the pack. The improving job market is            -60%
                                                                                                                  -79%
                                                                                                                       $20.0
 the silver lining in the economic horizon,       -80%                                                                 $10.0
 but the resurgence of coronavirus cases         -100%                                                                 $0.0

                                                            Apr
                                                             Jan
                                                            Feb

                                                            Apr

                                                            Jun
                                                              Jul
                                                            Aug
                                                            Sep
                                                            Oct
                                                            Nov
                                                            Dec
                                                             Jan
                                                            Feb
                                                            Mar

                                                            May

                                                            Mar

                                                            May
 is casting a pall on the job recovery and
 the continued opening of businesses                       '19'19'19'19'19'19'19'19'19'19'19'19'20'20'20'20'20
 that underpin the generation of rental
 income for commercial and multifamily              Source: Real Capital Analytics
 properties.
                                                         Year-over-Year Percent Change of Commercial
 Sales transactions contract                                  Property Prices for $2.5 M or More
                                                                   Transactions in May 2020
 Sales of properties or portfolios of $2.5     10.00
 million or more have collapsed, down           9.00     7.59
                                                8.00
 79% in May from one year ago and 20%           7.00
                                                6.00
 on a year-to-date basis.                       5.00                                                                            4.95
                                                4.00
                                                3.00
                                                2.00
 Commercial prices for $2.5 million or          1.00
                                                0.00
 over deals were still up 5% from one
                                                        Nov/2017

                                                        Nov/2018

                                                        Nov/2019
                                                        May/2017
                                                          Jul/2017

                                                        May/2018
                                                          Jul/2018

                                                        May/2019
                                                          Jul/2019

                                                        May/2020
                                                         Jan/2017
                                                        Mar/2017

                                                        Sep/2017

                                                         Jan/2018
                                                        Mar/2018

                                                        Sep/2018

                                                         Jan/2019
                                                        Mar/2019

                                                        Sep/2019

                                                         Jan/2020
                                                        Mar/2020
 year ago, based on Real Capital
 Analytics Commercial Property Price
 Index (transactions-based index using
 repeat sales methodology). Prices were
                                                 Source: Real Capital Analytics
 up strongly for apartment buildings in
 May, up 9% y/y in May, as well as
 industrial, up 6% y/y. However, prices                                 May '20            Year to Date                  RCA CPPI
                                                                Vol ($b)     YOY       Vol ($b)     YOY     Cap Rate        YOY
 for hotel properties were down 6% on a       Office               2.3        -82%      37.3         -26%     6.5%       1.6%
 year-over-year basis.                        Retail               1.0        -83%      15.7         -33%     6.6%       2.8%
                                              Industrial           2.1        -70%      39.1          28%     6.2%       6.1%
                                              Hotel                0.1        -95%       5.4         -54%     8.6%      -5.8%
                                              Apartment            3.1        -81%      48.6         -27%     5.4%       9.3%
                                              Snr Hsg & Care       0.5        -61%       4.5         -38%     6.4%
                                              Dev Site             0.7        -73%       7.8         -16%
                                              Total                9.8        -79% 158.4             -21%               4.9% *
                                              *All-Property Index; excludes Hotel, Snr Hsg & Care

  www.nar.realtor/research-and-statistics
                                                    2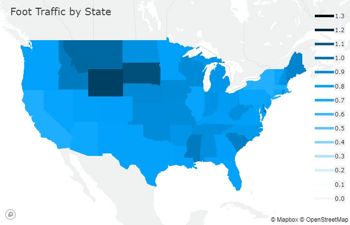
Overview
Investors Still Wary, but Improving Economic Outlook is a Silver Lining

  Investors seek higher risk premium
                                                                Cap Rates Less 10-Year Treasury Note Yield
  Investors remain wary of investing in           9.00%
  commercial real estate. The risk spread         8.00%                                                                                                                                    7.98%
  between cap rates and the 10-year               7.00%                                                                                                                                    5.93%
  Treasuries has increased by about one           6.00%                                                                                                                                    5.86%
  percentage point since January, an                                                                                                                                                       5.53%
                                                  5.00%
                                                                                                                                                                                           4.70%
  indication of higher perceived risk on the      4.00%
  collection of rental income from commercial     3.00%
  assets. The lowest risk spread was among        2.00%
  multifamily properties (4.7%) and industrial    1.00%
  (5.3%), but those spreads are higher            0.00%

                                                                    Apr-17
                                                                             Jul-17
                                                                                      Oct-17

                                                                                                        Apr-18
                                                                                                                 Jul-18
                                                                                                                           Oct-18

                                                                                                                                             Apr-19
                                                                                                                                                      Jul-19
                                                                                                                                                                Oct-19

                                                                                                                                                                                  Apr-20
                                                           Jan-17

                                                                                               Jan-18

                                                                                                                                    Jan-19

                                                                                                                                                                         Jan-20
  compared to their January levels (3.7% and
  4.8% respectively). The hotel sector
  acquisitions had he highest yield spread of                   Apartment                         Industrial                        Retail                     Office                 Hotel
  8 percentage points (6.8% in January) and
  5.9% for retail (4.8% in January). The office
  sector is in the middle of the pack, with the
  spread at 5.9% as of May (4.8% in January).                 Year-to date Returns on the FTSE Nareit U.S.
                                                              Real Estate Index Series as of June 26, 2020
  Nareit reported a negative year-to-date
  return on the All Equity REITS index of about
                                                     Data Centers                                                                                                                          17.30%
  -16%. For comparison, the S&P500 Total            Infrastructure                                                                                                                  12.20%
  Return Index was up 2% in June from May                 Industrial                                                                         -1.20%
  Again, the lodging/resort asset class was the       Self-storage                                                            -11.30%
  worst-performing, with a year-to-date yield     All Equity REITS                                                        -15.90%
  of -51%, followed by retail, at nearly -40%,        Residential                                                -19.60%
  and office, at -26%. The only property                        Office                                  -26.40%
  classes with positive returns were data             Health care                                       -27.80%
  centers (17.3%) and infrastructure (12.2%).              Retail       -39.40%
                                                  Lodging/Resorts-50.50%

                                                    Source: Nareit

  www.nar.realtor/research-and-statistics
                                                     3
Overview
Investors Still Wary, but Improving Economic Outlook is a Silver Lining
CMBS delinquency rates spike up
CMBS Marked as 30+ Days Delinquent as of
June 2020
Perhaps the clearest sign of distress in the
commercial market is the rising share of 30
24.3
commercial mortgage-backed securities as 20 18.07
delinquent. According to Trepp, the CMBS 10.32
10
marked as 30+ days delinquent rose to
10.32% in June 2020, up from just 2.07% in 0
March 2020, as delinquency rates spiked up Mar-20 Apr-20 May-20 Jun-20
in lodging (24.3%) and retail (18.07%). Industrial Lodging
However, the delinquency rates for other Multifamily Office
sectors remain relatively modest: industrial Retail CMBS 30-days delinquent
(1.57%) , office (2.66%), and multifamily Source: Trepp
(3.29%).
Seasonalized Annualized Value of
Construction spending declines Construction Put in Place for Multifamily,
Lodging, Office, Commercial Properties as of
The value of construction spending declined April 2020 ($Bn)
for the second straight month in May, down $300 40.0%
4.5% from May, with the largest contraction $250 20.0%
for lodging (-14.7%). For now, the decline in $200 0.0%
$150
construction spending is modest relative to $100 -20.0%
the decline in employment, retail sales, and $50 -40.0%
commercial acquisitions volume. Some of $0 -60.0%
Nov/2011
Apr/2004
May/2005
Jul/2007
Oct/2010
Apr/2017
May/2018
Aug/2008
Dec/2012
Jan/2001
Feb/2002
Mar/2003
Jun/2006
Sep/2009
Jan/2014
Feb/2015
Mar/2016
Jun/2019
this decline may be due to permitting and
certification delays by local governments
when stay-in-place orders were
implemented. Housing starts recovered in MF, Lodging, Office, Comml, Recr % Y/Y Change
May, which indicates that the decline was Source: US Census Bureau
temporary.
Value of construction put in place (SAAR, in $ Mil)
May-20 May-19 % change
Combined sectors $266,193 $278,678 -4.5%
New Multi-family $77,336 $81,923 -5.6%
Lodging $27,171 $31,845 -14.7%
Office $69,680 $74,166 -6.0%
Commercial* $77,902 $75,679 2.9%
Arts & Recreation $14,104 $15,065 -6.4%
*Commercial covers automotive, food/beverage,multi-retail
other commercial (e.g. drugstores,building supply), warehouse,
and farm. Source: U.S. Census Bureau
www.nar.realtor/research-and-statistics
4Overview
Investors Still Wary, but Improving Economic Outlook is a Silver Lining
Strong job recovery, but 15M jobs still to
be regained 7.5M Payroll Jobs Created in May and June 2020
3491
A silver lining in the commercial market
outlook is the strong job recovery in the 1111
industries that had lost those jobs, as 967
611 466 606 618
many states started allowing more -29 -4.8 -30 42 80 70
business re-openings. The economy -500
created 7.5 million net new payroll jobs in
May and June, and half of those were in
leisure and hospitality. All private
industries created net new payroll jobs,
while the government sector lost 500,000
jobs.
However, 15 million lost jobs since
February 2020 still need to be regained. May-20 Jun-20 Total
The resurgence of coronavirus cases in
nearly 80% of states (39 states as of July
6) could mean a slower job recovery as
states begin to reverse their move to
Payroll Jobs, in thousands
allow businesses to open.
155,000 152,463
150,000
145,000
137,802
140,000
135,000
130,000
130,303
125,000
120,000
115,000
Nov/2019
Apr/2019
May/2019
Jul/2019
Oct/2019
Apr/2020
May/2020
Aug/2019
Jan/2019
Feb/2019
Mar/2019
Jun/2019
Sep/2019
Dec/2019
Jan/2020
Feb/2020
Mar/2020
Jun/2020
Source: BLS Establishment Survey
www.nar.realtor/research-and-statistics
5Multifamily
Multifamily
Strong demand but rent collection risks remain elevated

   Apartment sales transactions fell 81% in May
                                                                              Apartment Sales Dollar Volume
   Apartment building sales of properties valued at                        $25.0

                                                                Billions
   $2.5 million or over fell by 81% in May from one
                                                                           $20.0
   year ago, to $3.1 billion, as transactions
   collapsed to just 176 sales deals in May from                           $15.0
   768 one year ago. The average price apartment
                                                                           $10.0
   unit has also dropped 7% since February, to
   $172,842 in May, but this is still 6% higher from                         $5.0
   the average price one year ago. Cap rates have                            $0.0
   remained essentially unchanged at 5.4% in May

                                                                                     Aug
                                                                                      Jan
                                                                                     Feb

                                                                                     Apr

                                                                                     Jun
                                                                                       Jul

                                                                                     Sep
                                                                                     Oct

                                                                                     Feb

                                                                                     Apr
                                                                                     Nov
                                                                                     Dec
                                                                                      Jan
                                                                                     Mar

                                                                                     May

                                                                                     Mar

                                                                                     May
   2020, from 5.5% in January 2020.
                                                                                    '19'19'19'19'19'19'19'19'19'19'19'19'20'20'20'20'20
   Transactions for garden apartments, which are                         Garden            Mid/highrise                     Total
   usually located in the suburban areas, fell more           Source: Real Capital Analytics
   than mid-high rise apartment buildings, which
   are usually in the central business districts. This
   may be because the job losses hit workers who                                Apartment Properties and Average
   are more likely to rent in the less expensive                                         Price Per Unit
   garden-type buildings. According to the US                 $195,000                                                                     1,000
                                                              $190,000                                                                     900
   Census Bureau’s Housing Pulse Survey (June 11-             $185,000                                                                     800
   16), 61% of renters who deferred rent in May               $180,000                                                                     700
   earned less than $50,000 per year.                         $175,000                                                                     600
                                                              $170,000                                                                     500
                                                              $165,000                                                                     400
   On a year-to-date basis, the largest sales
                                                              $160,000                                                                     300
   declines were in the Mid-Atlantic metro areas              $155,000                                                                     200
   (includes Philadelphia), -55%; the Northeast,-             $150,000                                                                     100
   30%; and the West,-24%. Sales in the Southeast             $145,000                                                                     0
   rose 3% supported by transactions in Miami-                                    Jan Mar May Jul Sep Nov Jan Mar May

   Dade, Orlando, Jacksonville, Nashville, and                           '19'19'19'19'19'19'19'19'19'19'19'19'20'20'20'20'20
   Memphis.                                                                        # Props                 Avg PPU
                                                               Source: Real Capital
Sales transactions of $2.5 M or over of apartment buildings

              YTD, May 2020 YTD, May 2019 % Chg
                                                                                               Apartment Volume 2020
Mid- Atlantic            $3,118     $6,889      - 55%
Midwest                 $4,358       $4,635       - 6%                                                  May '20             Year to Date
Northeast               $5,498       $7,827     - 30%                                            Vol ($b)      YOY   Vol ($b)        YOY
Southeast             $12,997      $12,568          3%                     Apartment Total        3.1         -81%   48.6           -27%
Southwest              $13,073      $13,835       - 6%                     Garden                 1.8         -83%   32.5           -27%
West                    $9,514     $12,589      - 24%                      Mid/Highrise           1.3         -74%   16.0           -28%
Total US              $48,558      $58,530       - 17%
Source: Real Capital Analytics

   www.nar.realtor/research-and-statistics
                                                         7
Multifamily
Strong demand but rent collection risks remain elevated
Multifamily construction is starting to recover
Value of Construction Put in Place,
The decline in multifamily construction in April Multifamily, Seasonally Adjusted Annual
reversed in May. The value of construction put in Rate, in Billion Dollars
place for multifamily homes picked up a modest
2% in May from April. Multifamily housing starts $86.0
also rose 15% in May from the April level, to a $84.0
$82.0
seasonally adjusted annual rate of 299,000 units. $80.0 $77.3
$78.0
However, this is still just half of the 628,000 annual $76.0
pace in January 2020. $74.0
$72.0
$70.0
$68.0
The turnaround in May indicates that the decline
Nov/2018
Nov/2019
May/2018
Jul/2018
May/2019
Jul/2019
May/2020
Jan/2018
Mar/2018
Sep/2018
Jan/2019
Mar/2019
Sep/2019
Jan/2020
Mar/2020
was temporary, likely related to delayed issuances
of permits and the shutdown. Builder delays
related to the coronavirus lockdown caused a large
part of the decline. According to the National
Multifamily Housing Council April survey1, 53% of
multifamily builders surveyed experienced builder
delays, of which 85% reported permitting delays Housing Starts Rebounded in May
related to restrictions to control the spread of the 1200
coronavirus pandemic. 1000
800
600 674
The turnaround in multifamily construction is 400
expected to ease the tight vacancy rates, 260
200
particularly in the West. 0
Nov/2018
Nov/2019
May/2018
Jul/2018
May/2019
Jul/2019
May/2020
Jan/2018
Mar/2018
Sep/2018
Jan/2019
Mar/2019
Sep/2019
Jan/2020
Housing Starts: 1 Unit (SAAR, Thous.Units) Mar/2020
Housing Starts: Total Multifamily (SAAR, Thous.Units)
Source: US Census Bureau
www.nar.realtor/research-and-statistics
8Multifamily
Strong demand but rent collection risks remain elevated
Rents rose at a slower pace, but outpacing
inflation
Rent Growth is Outpacing Inflation
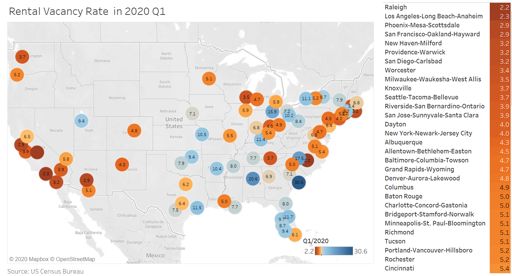
The national rental vacancy rate was 6.6% in the 4.0
first quarter of 2020. Among the largest 75 3.5
metro areas, 45 metro areas have a rental 3.0
vacancy rate of less than 7%, with the lowest 2.5 2.5
vacancy rates in metro areas in the West Coast 2.0
and East Coast, such as Raleigh, Los Angeles,
1.5
Phoenix, San Francisco, New Haven, Providence,
1.0
and San Diego.
0.5
0.0 0.1
Due to tight vacancy rates, rent growth has
outpaced inflation although rent growth
slowed to 2.5% in May, slightly down from 3.3%
in February. Rent growth has slowed as the Source: US Census Bureau
inflation has rate has fallen to 0.1% (annual) .
www.nar.realtor/research-and-statistics
9Multifamily
Strong demand but rent collection risks remain elevated
Higher risks to rental income collection in Percent of Renters Who Did Not Pay or
lower class apartments Deferred Rent
19.7% 19.4%
The key issue facing the multifamily market is 17.6% 18.2% 18.8% 17.5% 18.9%
renter’s ability to make the rent payment. As
9.9%
the economy continues to open and workers
are returning to work, apartment rent
collection has been improving. According to
the US Census Bureau’s Household Pulse Apr 23- May 7 - May 14- May 21- May 28- June 4- June 11- June 18-
Survey, about 19% of the population 18 May 5 May 12 May 19 May 26 June 2 June 9 June 16 June 32
years old or older who lived in renter-
occupied housing did not pay or deferred
rent.
Percent of Typical Rent Received of
Nareit reported that REITS received 97.5% of REIT-owned/managed Apartments
the typical rent in June, up from 89.9% in
April. There is a higher percentage of rent 97.5%
collection for REITS which own or operate
more of Class A apartments with higher 92.9%
income tenants.
89.9%
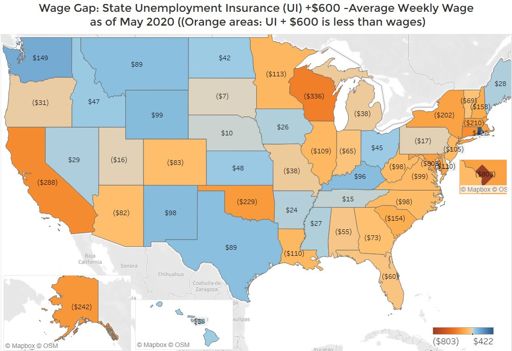
The state unemployment insurance and the
additional $600 weekly benefit is helping out- April May June
of-work workers* pay mortgage rent.
Source: Nareit
However, the $600 benefit expires on July
31, and this has been crucial in restoring lost
wages, particularly, in about 16 states, many
in the Midwest region. There are proposals to
replace the $600 weekly benefit with
assistance that is tied to unemployment
conditions (e.g. $450/week if the
unemployment rate is above 7.5%) or as a
$450 bonus for those returning to work.
Renter’s ability to meet pay rent will depend
on the level of assistance they will receive
among the unemployed or how fast they get
back to work. However, with nearly 80% of
states seeing a resurgence in coronavirus
cases and the potential of more business
closures, job creation may slow.
www.nar.realtor/research-and-statistics
10Industrial
Industrial
Strongest asset class as demand for e-commerce sales rise

  Industrial property volume decreased from                                             Industrial Sales Dollar Volume
  April levels but still up YTD
                                                                                $30.00
                                                                                $25.00
  Industrial property sales valued at $2.5 million or
  over decreased by 70% in May from one year                                    $20.00
  ago, to $2.1 billion. Industrial property sales

                                                                     Billions
                                                                                $15.00
  transactions substantially decreased from 680                                 $10.00
  deals in May 2019 to 165 in May 2020 and also                                  $5.00
  represents a decrease from April 2020 levels.                                    $-
  The average per square foot has decreased 5%                                            Jan Mar May Jul        Sep Nov Jan Mar May
  since February, to $95 in May and represents an                                         '19'19'19'19'19'19'19'19'19'19'19'19'20'20'20'20'20
  increase of 6% from one year ago levels. Cap
  rates remain essentially unchanged at 6.2%.                                                        Flex          Warehouse
                                                                       Source: Real Capital Analytics
  Deals for warehouse, decreased more than flex,
  in May. Warehouse transactions decreased by
  44% from the prior month whereas flex                                          Industrial Properties and Avg. Per
  transactions represent a decrease of 40%. While                                            Square Foot
  deals in the sector have fallen, industrial was to
                                                                     1600                                                               $120
  some degree, the favored asset class as it fell                    1400                                                               $100
  mildly in comparison to other asset classes.                       1200
                                                                                                                                        $80
                                                                     1000
  Year-to-date industrial total volume, $39.1B,                       800                                                               $60
  represents a YoY increase of 28%.                                   600                                                               $40
                                                                      400
                                                                      200                                                               $20
  With a range from January to May 2020, the                            0                                                               $-
  largest YoY industrial sales increase was in the                              Jan Mar May Jul             Sep Nov Jan Mar May
  Mid-Atlantic metro area, 279%. Other sales                                    '19'19'19'19'19'19'19'19'19'19'19'19'20'20'20'20'20
  increases include the Southwest, 90%, the
  Southeast, 39%, the West, 11% and the                                                    # Props             Avg. PSF
  Midwest, 26%. Sales in the Northeast declined                          Source: Real Capital Analytics
  14%.

                                                                                             Industrial Volume 2020
 Sales Transactions of $2.5 M or more of industrial buildings
                     YTD, May 2020 YTD, May 2019 % Change
                                                                                                      May '20                Year to Date
 Mid-Atlantic                6,030.6        1,591.7           279%
                                                                                                Vol ($b)     YOY          Vol ($b)     YOY
 Midwest                     6,295.4        4,980.6            26%
 Northeast                   3,357.1        3,913.6           -14%   Industrial Total              2.1       -70%           39.1       28%
 Southeast                   6,802.6        4,901.4            39%   Flex                          0.6       -55%            6.9       11%
 Southwest                   6,216.7        3,266.3            90%   Warehouse                     1.5       -73%           32.2       32%
 West                        8,868.4        7,978.3            11%   Single Asset                  2.0       -62%           16.6       -21%
 Total US                   39,092.5       27,791.9            41%   Portfolio                     0.1       -96%           22.5      136%
 Source: Real Capital Analytics

  www.nar.realtor/research-and-statistics
                                                               12
Industrial
Strongest asset class as demand for e-commerce sales rise
E-Commerce continues growth
Quarterly Estimated Total and E-
E-commerce, already increasing year-over-year,
commerce U.S. Retail Sales, Millions
saw another increase in Q1. E-commerce
brought in $160,333 billion in the first quarter $1,600
which was at the beginning stages of the COVID- $1,400
19 pandemic. This represents and increase of $1,200
2.4% from Q4 2019. Total retail sales for Q1 $1,000
2020 was estimated at $1,363.5 billion and $800
represents a decrease of 1.3% from Q4 2019. E- $600
commerce sales in Q1 2020 accounted for 11.8% $400
of total U.S. retail sales. $200
$0
The shift towards e-commerce may be Q1 2019 Q2 2019 Q3 2019 Q4 2019 Q1 2020
permanent as May economic data illustrates Total E-Commerce
how non-store retailers have grown throughout
the coronavirus pandemic. Industries in the non-
store retail subsector saw sales increase
throughout the pandemic. Sales for non-store Quarterly E-commerce Retail Sales as a
Retailers grew 9.5% in April as brick-and-mortar Percent of Total Sales Since Q1 2019
retail locations remained closed or reduced 12
operations. Additionally, electronic shopping &
mail-in houses grew 12.6%. In May, non-store 11.5
retail grew an additional 9%, considering more
brick-and-mortar locations began to open. 11
Whilst the coronavirus pandemic forced many 10.5
shoppers online as consumers clicked-to-collect,
especially curbside pickup and delivery in an 10
effort to reduce contact with other individuals,
the gains from e-commerce will not offset the 9.5
losses accrued throughout the pandemic in Q1 2019 Q2 2019 Q3 2019 Q4 2019 Q1 2020
general. However, should consumer habits
persist, this could be an indication of the
trajectory of e-commerce growth.
Industrial properties may remain in demand
given the constant growth in e-commerce and as
physical retail locations continue to attract and
retain consumers via online shopping and
delivery.
www.nar.realtor/research-and-statistics
13Industrial
Strongest asset class as demand for e-commerce sales rise
Transportation and warehousing employment Transportation and Warehousing
continued downward trend Employees, SA Thousands
5800 5668
In May, transportation and warehousing 5700
5600
employment continued its downward trend as 5500
5400
employment decreased from 5.1 million in April 5300
to 5 million. May’s estimate is continuing the 5200 5108
5100
downward trend realized every month year-to- 5000 5080
4900
date. Transportation and warehousing 4800
employment decreased by 28,300 or 0.55% from 4700
Nov/2019
Apr/2019
May/2019
Jul/2019
Oct/2019
Apr/2020
May/2020
Jan/2019
Feb/2019
Mar/2019
Aug/2019
Jun/2019
Sep/2019
Dec/2019
Jan/2020
Feb/2020
Mar/2020
April estimates which dramatically fell from the
prior month.
Although, transportation and warehousing
employment has decreased slightly from the Transportation and Warehousing
prior month and figures are below levels from
Employees YTD, SA Thousands
earlier this year, it has fared well in comparison
to other sectors. 6000
5000
4000
3000
The change of transportation and warehousing 2000
jobs in May with respect to January shows 1000
0
growth for couriers and messengers with a slight
contraction in scenic and sightseeing, pipeline,
water and rail transportation. The largest deficit
in May vs January employment was in transit
and ground passenger transportation with Jan/2020 Feb/2020 Mar/2020
197,300 jobs lost. Apr/2020 May/2020
Change in Transportation and Warehousing Jobs in May vs. January
Warehousing and storage
Couriers and messengers
Support activities for transportation
Scenic and sightseeing transportation
Pipeline transportation
Transit and ground passenger transportation
Truck transportation
Water transportation
Rail transportation
Air transportation
-250 -200 -150 -100 -50 0 50
www.nar.realtor/research-and-statistics
14Industrial
Strongest asset class as demand for e-commerce sales rise
While CMBS delinquencies surged for the third CMBS Delinquency Rate by
consecutive month and nearly reached an all- Property Type
time high, industrial delinquency rates only 30%
sector to decrease delinquency among property
25%
types
20%
The overall U.S. cmbs delinquency rate rose 317 15%
basis points above the May figure towards 10%
10.32% as loan payments became delinquent
5%
and was very close to besting the all-time high of
10.34% posted in July 2012 according to Trepp, a 0%
Industrial Retail Office Multifamily Lodging
data analytics firm that specializes in commercial
Mar-20 Apr-20 May-20 Jun-20
mortgage-backed securities, commercial real
estate and banking markets. Source: Trepp
According to Trepp, 4.1% of the loans missed
their June payments and are less than 30 days Industrial CMBS Delinquency Trend
delinquent. The percentage of loans in or 6%
beyond grace period fell from 8.1% in April and
5%
7.6% in May. Trepp indicates that we may have
reached the delinquency floor as many 4%
borrowers whom needed debt service relief in 3%
the prior months have requested for it and if
not, will not need it moving forward. Should that 2%
be the case, any future increases in the 1%
delinquency rate should be smaller than what
0%
was realized in recent months.
The industrial delinquency rate decreased 25
basis points towards 1.57% from May’s 1.82% Source: Trepp
and represents the lowest and only decrease in
basis points from the prior month by property The industrial sector has fared relatively well year-
type. June 2020 industrial delinquency rate is to-date as it is comprised of warehouse and flex
down 37 basis points year over year. which makes for the inclusion of fulfillment centers
for e-commerce which is flourishing and was a
CMBS lenders provided 21% of new loans for substantial benefactor of the measures taken to
industrial properties in 2019 with the remaining combat the coronavirus pandemic.
coming from national banks, local/regional
banks and insurance lenders.
www.nar.realtor/research-and-statistics
15Office
Office
Trend towards suburban office space likely to continue

 Office sales transactions fell 82% in May                                             Office Sales Dollar Volume
                                                                              $20.0

                                                                   Billions
 Office sales volume of properties valued at $2.5                             $18.0
 million or over fell by 82% in May from one year                             $16.0
                                                                              $14.0
 ago, to $2.3 billion, as transactions collapsed to                           $12.0
 just 112 sales deals in May from 579 one year                                $10.0
 ago. On a year-to-date basis, office sales are                                $8.0
 down 25%.                                                                     $6.0
                                                                               $4.0
                                                                               $2.0                                                               $2.3
 However, prices have not fallen, with the                                     $0.0
 average price per square foot at $308 in May,                                        Jan Mar May Jul              Sep Nov Jan Mar May
 about the same as in March, at $288.                                                 '19'19'19'19'19'19'19'19'19'19'19'19'20'20'20'20'20

                                                                                  Office - CBD          Office - Sub            All-Property
 Sales broadly declined except in the Mid-Atlantic
 and the Northeast, but performance varied
 across metro areas. The DC-MD Burb-VA-Burbs
 propelled the growth in the Mid-Atlantic region.                             Office Property Sales and Average PSF
 In the Northeast, Boston was the growth driver,
                                                                 800                                                                         $350
 as sales declined in Manhattan, Long Island, and
 Westchester. Driving the growth in the Midwest                  700                                                                         $300
 were Cincinnati, Detroit, and Indianapolis. In the              600
                                                                                                                                             $250
 Southeast, growth was driven by Raleigh-                        500
 Durham and Charlotte. In the Southwest Dallas                                                                                               $200
                                                                 400
 and Denver drove market sales. The West region                                                                                              $150
 sales declined heavily as sales fell in many                    300
                                                                                                                                             $100
 California and Washington metro areas. Only Las                 200
 Vegas saw an increase in sales in May.                          100                                                                         $50

                                                                  0                                                                          $-
 Sales transactions of $2.5 M or over of office buildings                     Jan Mar May Jul          Sep Nov Jan Mar May
                YTD, May 2020 YTD, May 2019      % Chg                        '19'19'19'19'19'19'19'19'19'19'19'19'20'20'20'20'20
 Mid- Atlantic          $4,358       $3,890        12%
 Midwest                $2,815        $4,236      - 34%
 Northeast             $10,628         $9,181      16%
 Southeast              $4,522        $6,021      - 25%                                                May '20                Year to Date
 Southwest              $4,797        $5,133       - 7%                                          Vol ($b)      YOY     Vol ($b)        YOY
 West                   $9,681       $16,161      - 40%
                                                                        Office Total             2.3        -82%       37.3           -26%
 Total US              $37,345      $44,622       - 16%
 Source: Real Capital Analytics                                         CBD                      1.1        -76%       13.5           -23%
                                                                        Sub                      1.2        -86%       23.8           -27%

  www.nar.realtor/research-and-statistics
                                                            17
Office
Trend towards suburban office space likely to continue
Uptick in suburban office sales
One of the key questions about the effect of Share of CBD Office Sales to Total Office
coronavirus on the office outlook is the potential Sales for $2.5M or more Transactions
shift towards the suburban market. Suburban
60%
office space acquisitions have been on the rise
since 2017, but this trend may pick up as a result 50%
of social distancing and increased opportunity to 40%
work from home. 30%
36%
20%
The share of CBD has slightly fallen from 38% in
10%
2018 to 36% as of Jan-May 2020. Except for
Boston and Charlotte, more than 50% of sales of 0%
2001
2002
2003
2004
2005
2006
2007
2008
2009
2010
2011
2012
2013
2014
2015
2016
2017
2018
2019
Jan-May 2020
$2.5 million or properties during Jan-May 2020
were in the suburbs.
Source: Real Capital Analytics
The increasing trend towards suburban office
development may continue for two reasons:
based on the price differential and the potential
Average Price Per Square Foot
movement of people to the suburbs which offer
more affordable housing and more space. On $700
average, a square foot of office CBD cost $500 as $600
of May, compared to $238 for a square foot of $500 $500
suburban office space. As the price of CBD office $400
space started to outpace the price of suburban $300
office space starting in 2011, the share of CBD $238
$200
sales also started declining. $100
$-
CBD and Suburban Office Sales from
Nov-06
Apr-08
Jul-12
May-15
Oct-16
Aug-02
Aug-19
Mar-01
Jan-04
Jun-05
Sep-09
Feb-11
Dec-13
Mar-18
January-May 2020 for $2.5M or more
5,000.0 Properties
4,000.0 Office - CBD Office - Sub
3,000.0
2,000.0
1,000.0
0.0
CBD Suburban
www.nar.realtor/research-and-statistics
18Office
Trend towards suburban office space likely to continue
Office leasing volume contracts
JLL* reported that leasing activity fell by 20% in
2020 Q1 compared to the prior quarter.
Absorption was effectively flat at just 5.8 million
square feet on a quarterly basis, compared to 17
million on a quarterly basis in 2019. The net
absorption was just 0.2% of inventory.
Subleasing vacant space (such as WeWork
subleases) rose to 55 million square feet as co-
working centers closed due to stay-at-home
orders.
The vacancy rate was unchanged at 14% in 2020
Q1, but this was only because of suppressed
deliveries of new office space as localities
temporarily halted conducting certifications and
inspections.
JLL also reported a flight-to-quality: nearly 7 Value of Construction Put in Place for
million square feet of space absorbed in Class A Office Buildings, Seasonally Adjusted
space was partially offset by losses in the Class B Annual Rate, in Billion Dollars
and C segments.
90
Rent growth was stable at 0.6% from the prior 80
70
quarter. However, JLL reported rising requests 60 $69.7
for concessions. 50
40
30
Pre-leasing of new deliveries fell to 47%, which 20
will tend to increase vacancy rates. 10
0
May/2001
May/2005
May/2009
May/2013
May/2017
Jan/2000
Sep/2002
Jan/2004
Sep/2006
Jan/2008
Sep/2010
Jan/2012
Sep/2014
Jan/2016
Sep/2018
Jan/2020
New deliveries of office space are likely to fall in
the future based on the decline in the value of
construction put in place for office buildings as
of May, which was down 6% from one year ago.
_____________________________________
*JLL Research Report, Office Outlook, Q1 2020
www.nar.realtor/research-and-statistics
19Office
Trend towards suburban office space likely to continue
3 M fewer office workers will continue to prop
up vacancy rates Payroll Employment in Information,
Finance, and Professional & Business
In May and June 2020, the economy created Service Industries
nearly 500,000 net new jobs in the office-using 34000 33289
sectors (information services, financial services, 33500
33000
and professional and business services). 32500
32000
31500 30907
Notwithstanding this impressive job gains in the 31000
past two months, there are still 3.3 million fewer 30500
30000
30429
jobs in the major office-using industries, and it will 29500
29000
take sustained job creation gains to substantially 28500
lift up absorption for office space.
Nov/2019
Apr/2019
May/2019
Jul/2019
Oct/2019
Apr/2020
May/2020
Aug/2019
Jan/2019
Feb/2019
Mar/2019
Jun/2019
Sep/2019
Dec/2019
Jan/2020
Feb/2020
Mar/2020
Jun/2020
466,000 Net New Office-Using Jobs in May and June 2020
211.6 Employment Services
117.7 Services To Buildings & Dwellings
51 Accounting & Bookkeeping Services
42.2 Other Professional & Technical Services
18.1 Management & Technical Consulting Services
16.4 Architectural & Engineering Services
14.5 Legal Services
11.5 Business Support Services
10.7 Other Support Services
7 Scientific Research & Development Services
5.6 Specialized Design Services
4.9 Investigation & Security Services
2.2 Facilities Support Services
1.9 Advertising & Related Services
1.8 Office Administrative Services
-2 Waste Management & Remediation Services
-7.2 Management of Companies & Enterprises
-14.4 Travel Arrangement & Reservation Services
-27.5 Computer Systems Design & Related Services
Source: BLS Establishment Survey
www.nar.realtor/research-and-statistics
20Retail
Retail
Slow recovery likely to continue

  Retail sales transactions fell 83% in May                                     Retail Sales Dollar Volume
                                                                        $10
  Retail property sales valued at $2.5 million or                        $9
                                                                         $8
  over decreased by 83% in May from one year                             $7
  ago, to $1 billion, as transactions plunged from                       $6

                                                             Billions
                                                                         $5
  619 sales deals in May 2019 to 106 in May 2020.                        $4
  The average per square foot has increased 4%                           $3
                                                                         $2
  since February, to $264 in May and represents                          $1
  an increase of 4% from one year ago levels. Cap                        $-

                                                                              Aug
                                                                               Jan
                                                                              Feb

                                                                              Apr

                                                                              Jun
                                                                                Jul

                                                                              Sep
                                                                              Oct
                                                                              Nov
                                                                              Dec
                                                                               Jan
                                                                              Feb

                                                                              Apr
                                                                              Mar

                                                                              May

                                                                              Mar

                                                                              May
  rates have remained unchanged for the year
  thus far at 6.6% and remains essentially                                    '19'19'19'19'19'19'19'19'19'19'19'19'20'20'20'20'20
  unchanged year-over-year.
                                                                                          Shops          Centers
  Transactions for shops, decreased more than                   Source: Real Capital Analytics
  centers, in May. Shop transactions decreased by
  48% from the prior month whereas center
  transactions represent a decrease of 25%. This                              Retail Properties and
  may be the case as Covid-19 has expedited the                           Average Price Per Square Foot
  transition from making purchases at brick and             1400                                                              $300
  mortar locations to online shopping. In addition,         1200                                                              $250
  investors may still be concerned to the extent of         1000                                                              $200
                                                             800
  the coronavirus’s impact on the economy and                                                                                 $150
                                                             600
  commercial property demand.                                400                                                              $100
                                                             200                                                              $50
  On a year-to-date basis, the largest sales decline           0                                                              $-
  was in the Midwest metro areas (including                             Jan Mar May Jul        Sep Nov Jan Mar May

  Columbus) at-40%. Other sales declines include                        '19'19'19'19'19'19'19'19'19'19'19'19'20'20'20'20'20
  the Southeast, -29%, the West, -28%, and the
  Northeast,-22%. Sales in the Southeast remained                                                 # Props
  unchanged while the Mid-Atlantic increased                Source: Real Capital Analytics
  10%.

  www.nar.realtor/research-and-statistics
                                                       22
Retail
Slow recovery likely to continue
Retail rent payment increase Percent of Retail Rent Paid
March—June 2020
COVID-19 and measures taken to contain it, took 100 91
a drastic toll on retail as it forced reduced hours,
80
significant employee reductions, reduced foot 59 61
60 54
traffic, temporarily closures and permanent
retail closures. The loss of revenue made it 40
difficult for many businesses to pay their rent in 20
a timely fashion, if at all.
0
March April May *June
According to Datex Property Solutions, a real
estate business intelligence firm, almost half of Source: Datex Property Solutions
retail rent was not paid in April and May 2020. Note: *as of mid-June
Albeit below March levels, mid-June retail rent
collection is making a recovery towards March REIT Industry Percent of Retail Rent
figures as the economy continues to open with Received April—June 2020
states allowing restaurants, retail shops and
100 72 79.4
others to reopen, with assorted restrictions and 70.6
45.9 60.5
under various phases. 50
49.4
Nareit indicated that typical rent received for 0
retail reits (shops and centers) for the month of April May June
June illustrate an improvement. Shop typical rent
received for June was 79.4%, up from 70.6% the Shops Centers
prior month. Centers received 60.5% of typical Source: Nareit
rent in June, up from 45.9% in April.
The Paycheck Protection Program (PPP), was a Retail Trade PPP Loan Distribution
SBA loan created by the CARES Act that 500 $45
incentivized small businesses to retain their $40
400 $35
employees on payroll during the Covid-19 crisis $30
Thousands
by forgiving loans if all employees were kept on 300
Billions
$25
payroll for eight weeks and if the allocated funds 200
$20
were utilized for payroll, utilities, mortgage $15
100 $10
interest, or rent. PPP helped cushion the blow $5
from COVID-19 as PPP resulted in 444,069 0 $-
approved retail trade loans for $40B through 16-Apr May June
June 2020. PPP was set to expire June 30 with
Approved Loan Count
$130B untapped and now may be extended until
August 8, if not, other coronavirus relief options Source: SBA
remain available i.e. SBA Debt Relief.
www.nar.realtor/research-and-statistics
23Retail
Slow recovery likely to continue
Retail employment is improving Total Nonfarm Payroll, SA Thousands
155000 152463
According to the U.S. Bureau of Labor Statistics, 150000
U.S. total nonfarm payroll employment 145000
increased by 2.5 million in May while the 140000
unemployment rate decreased 1.4 percentage 135000 132912
points to 13.3%. The boost in employment in the 130000
labor market can be attributed to the 130403
125000
resumption of economic activity, albeit in a 120000
restricted capacity.
115000
Nov/2019
Apr/2019
May/2019
Jul/2019
Oct/2019
Apr/2020
May/2020
Aug/2019
Jan/2019
Feb/2019
Mar/2019
Jun/2019
Sep/2019
Dec/2019
Jan/2020
Feb/2020
Mar/2020
In May, retail trade employment made a steep
incline along with leisure and hospitality, health
services, construction and education. Retail
trade employment increased by 368,000 or
2.76% from April figures where April figures Retail Trade Employees, SA Thousands
represent substantial employment loss of 2.3 16000 15672
million jobs. 15500
15000
14500
While the retail trade sector is making 13669
14000
improvements, figures are still down from earlier
13500
this year. The change of retail jobs in May with 13000 13301
respect to January shows growth for general 12500
merchandise and building material & garden 12000
supply while food & beverage store employment
Nov/2019
Apr/2019
May/2019
Jul/2019
Oct/2019
Apr/2020
May/2020
Aug/2019
Jan/2019
Feb/2019
Mar/2019
Dec/2019
Jun/2019
Sep/2019
Jan/2020
Feb/2020
Mar/2020
was essentially unchanged. The largest deficit in
May vs January employment was in clothing &
clothing accessories.
Change in Retail Jobs in May vs. January
General Merch Stores, incl Whse Clubs & Supercenters 125
Building Material & Garden Supply Stores 18.7
Food & Beverage Stores
Nonstore Retailers
Gasoline Stations
General Merchandise Stores
Health & Personal Care Stores
Electronics & Appliance Stores
Sporting Goods, Hobby, Book & Music Stores
Furniture & Home Furnishings Stores
Miscellaneous Store Retailers
Department Stores
Retail Motor Vehicle & Parts Dealers
Clothing & Clothing Accessories Stores
-800 -700 -600 -500 -400 -300 -200 -100 0 100 200
www.nar.realtor/research-and-statistics
24Retail
Slow recovery likely to continue
Retail sales are growing, but not at the levels of Food Services and Drinking Places,
pre-coronavirus yet SA Millions
70000 $65,359
The U.S. economy has reopened in a limited
60000
capacity as states are reopening their economies
in various phases. SafeGraph, aggregates and 50000
$38,627
Milions $
anonymizes data and maps foot traffic counts to 40000
$29,922
5 million points-of-interest saw increased foot 30000
traffic patterns as retail sales and food services 20000
grew from what looks and hopefully was the
10000
bottom in April.
0
According to Coresight Research, a research firm
focusing on retail and technology, 5,007 retail
stores, as of June 26, 2020 shuttered. With food
services and drinking places operating at
reduced capacity according to varying state
criteria, the sector has increased from $29 billion
in April to $38 billion in May.
The increasingly popular food delivery sector is
facing consolidation as Uber offered to purchase
Postmates for $2.6 billion in June. This came of
the heels of Uber’s failed attempt to acquire
Grubhub for whom was acquired by Europe’s
Just Eat Takeaway for $7.3 billion in June as well.
Should the deal be executed, it would add to
Uber’s current delivery business, Uber Eats
which grew throughout the coronavirus
pandemic.
Retail Sales & Food Services (SA, Millions)
$600,000 $527,273
$500,000 $412,576 $485,545
$446,918
$400,000
Millions
$461,914
$300,000 $382,654
$200,000
$100,000 $65,359 $29,922
$0 $38,627
Nov/2019
Apr/2019
May/2019
Jul/2019
Oct/2019
Apr/2020
May/2020
Jan/2019
Feb/2019
Mar/2019
Aug/2019
Dec/2019
Jun/2019
Sep/2019
Jan/2020
Feb/2020
Mar/2020
Retail sales Food services Retail and food services
www.nar.realtor/research-and-statistics
25COMMERCIAL MONTHLY INSIGHTS REPORT July 2020 LAWRENCE YUN, PhD Chief Economist & Senior Vice President for Research GAY CORORATON Senior Economist & Director of Housing and Commercial Research BRANDON HARDIN Research Economist MEREDITH DUNN Research Communications Manager ©2020 National Association of REALTORS® All Rights Reserved. May not be reprinted in whole or in part without permission of the National Association of REALTORS®. For question about this report or reprint information, contact data@realtors.org. Download report at:https://www.nar.realtor/research-and-statistics/research-reports/commercial-research
The National Association of REALTORS® is America’s largest trade association,
representing more than 1.4 million members, including NAR’s institutes, societies
and councils, involved in all aspects of the real estate industry. NAR membership
includes brokers, salespeople, property managers, appraisers, counselors and
others engaged in both residential and commercial real estate. The term
REALTOR® is a registered collective membership mark that identifies a real estate
professional who is a member of the National Association of REALTORS® and
subscribes to its strict Code of Ethics. Working for America's property owners, the
National Association provides a facility for professional development, research and
exchange of information among its members and to the public and government
for the purpose of preserving the free enterprise system and the right to own real
property.

NATIONAL ASSOCIATION OF REALTORS®
RESEARCH GROUP

The Mission of the NATIONAL ASSOCIATION OF REALTORS® Research Group is to
produce timely, data-driven market analysis and authoritative business intelligence
to serve members, and inform consumers, policymakers and the media in a
professional and accessible manner.

To find out about other products from NAR’s Research Group, visit
www.nar.realtor/research-and-statistics

500 New Jersey Avenue, NW
Washington, DC 20001
202.383.1000
You can also read