Outlook for Japanese Economy & Stock Market - Monthly comments & views by Sumitomo Mitsui DS Asset Management (SMDAM)
←
→
Page content transcription
If your browser does not render page correctly, please read the page content below

Outlook for
Japanese Economy & Stock Market

Monthly comments & views by
Sumitomo Mitsui DS Asset Management (SMDAM)

-March 2021-
Executive summary
Japanese Economy
SMDAM revised GDP forecast for FY2020, 21 and 22 by +0.8%, +0.2% and -0.1% respectively resulting from much
stronger than expected GDP for Oct-Dec 2020 quarter. Capital spending was stronger than preceding forecast led by
strong demand from overseas. Private consumption was quite robust partly lifted by “Go To campaign”, which was a
government incentive for traveling, eating and going events though it has been stopped due to COVID. (Page 9)
• COVID-19 caused a severe negative impact, however, the trade momentum hit bottom in May and substantial recovery is continuing
afterwards. Phase analysis shows that the current new cycle is further progressing in Phase 3, in which historically broad range of assets
tend to produce significant positive returns. (Page 4)
• Economy Watcher Survey covers people working at economic sensitive jobs. Current condition DI in January dropped to 31.2, which was
just as indicated by future condition DI in December. Future condition DI in January is pointing at sharp recovery to 39.9. Winter spread of
COVID-19 is gradually calming down and current state of emergency is going to be lifted by early March. (Page 13)
Japanese Stock Market
Corporate earnings for Oct-Dec 2020 quarter came out strongly beating preceding forecasts. Manufacturing industries are
showing robust earnings recovery mainly led by strong exports. COVID vaccination is progressing in many countries so
far without serious health trouble and new infection cases are coming down noticeably. SMDAM revised forecast range
upwards based on higher EPS growth and rising risk appetite of investors. Japanese stocks will attract global money with
relatively attractive stock valuation and high sensitivity to the global economy. (Page 20)
• 12M EPS consensus forecast has been bouncing back from September. Latest 12M forward EPS growth forecast for TOPIX rose further
to robust 37.6%. (Page 25)
• PE Ratio (PER) and real interest rate (RI) have negative correlation. Take US S&P 500 as a guide for global stock valuation compared to
real interest rate, current position looks reasonably valued and it could stay so if RI rises just slowly in line with EPS growth. (Page 22)
Notes: Macro and market views are as of 16th Feb. 2021, and subject to updates thereafter without notice.
1
Outlook for
Global Economy

                 2
Outlook for the global economy
SMDAM has marginally adjusted GDP forecast for 2020 and 2021 by +0.2% and +0.1% respectively. Fiscal stimulus
in US in 2021 is getting larger the expected.
Global economy is expected to show continuing recovery. Manufacturing industries will be the main driver of the
recovery for the coming months. Physical service sectors likely recover from the latter half of 2021.
Global GDP forecast and contribution by
(YoY %) countries & regions (Main scenario)
(Year)
Notes: Data is from 2008 to 2022 and forecasts by SMDAM as of 16th Feb. 2021.
(Source) IMF, National statistics of each country, compiled by SMDAM.
3Trade momentum analysis shows a new economic cycle is progressing
SMDAM has developed trade momentum indicators in order for monitoring economic cycles and estimating in which
phase of cycle current position is situated.
COVID-19 caused a severe negative impact, however, the trade momentum hit bottom in May and substantial recovery
is continuing afterwards.
Phase analysis shows that the current new cycle is further progressing in Phase 3, in which historically broad range of
assets tend to produce significant positive returns.
Trade momentum as a guide for economic cycle Phase analysis
(Z-score) (2005=100) vertical : Trade momentum
1.5
6 month % chg of trade momentum(LHS)
2.0 156
1.8 Trade Momentum (LHS) 5 4
153 3
1.6 1.0
World Trade Index (RHS) Positive but
1.4 150
1.2 Decelerating Positive and
1.0 147 Accelerating
0.5
0.8 144 6
0.6
Jan. 2021
0.4 141
0.0
0.2
138
0.0
▲ 0.2 135
▲ 0.5
▲ 0.4
▲ 0.6 132
▲ 0.8 7 2
129 ▲ 1.0
▲ 1.0
▲ 1.2 126
▲ 1.4 Negative but
123 ▲ 1.5
▲ 1.6
Negative and Improving
▲ 1.8 120 8 1
12 13 14 15 16 17 18 19 20 21 Worsening
(Year) ▲ 2.0
▲ 1.5 ▲ 1.0 ▲ 0.5 0.0 0.5 1.0 1.5 2.0
(Notes) Trade momentum is calculated from 16 indicators and compiled by SMDAM. Data is from Jan 2012 to Jan. 2021. horizontal : Trade momentum (6 month % chg)
(Source) Bloomberg, Datastream, Netherlands Bureau for Economic Policy Analysis and other National Statistics.
4People’s mobility is recovering and vaccination is progressing
New cases of COVID-19 are declining and lockdowns are gradually loosened. Mobility indices show that people’s activities are
coming back.
Vaccination is progressing. Such countries as Israel, UAE (not shown on the right chart), UK are making good progress and US
is expected to pick up the pace going forward. Japan started vaccination for medical staff from 17th February.
progress of COVID vaccination
(Year / Month/Date) (Year / Month/Date)
Note: Apple and Google’s mobility indices are composed by each sub- Note: Data is up to 13th February 2021.
indices selected by SMDAM in order for tracking GDP of each Percentage of people who had at least one shot of vaccine
country. Top 30 countries by GDP excluding China. among total population of each country.
Google’s data is up to 7th February, Apple’s data is up to 12th Each 70% line show the trend to reach 70% of the total
February and number of new COVID-19 infection cases is up to population by each month-end.
12th February. (Source) National statistics of each country.
(Source) Google, Apple, National statistics of each country, estimation
by SMDAM
5Tapering and guidance to financial markets are key events in 2021(1)
Expected inflation rates, which are calculated from yields of index linked government bonds and straight bonds, continue
rising beyond 2% level in US and also rising in Germany and Japan too.
Real interest rates are at unprecedented levels in negative territory for US and Europe, which together with quantitative
easing could cause bubble in financial markets if they stay too long.
On the other hand, actual inflation rate is not likely to rise so quickly and 2% target level will not be met soon in 2021.
Central banks have a very complicated task in maneuvering monetary policies and taming sensitive financial markets.
(%)
Expected inflation rates (%) Real interest rates
(Based on 10Y government bonds) (Based on 10Y government bonds)
(year) (year)
Note: Data is from 1st Jan 2015 to 12th Feb. 2021.
(Source) Bloomberg
6Tapering and guidance to financial markets are key events in 2021(2)
Central banks continue extra-easy monetary policies in order for calming negative impacts caused by the winter spread
of Covid-19. They unanimously call for additional fiscal measures to keep economies on a growth path.
Behind the doors, central banks are discussing how to maneuver tapering of monetary easing in 2021 when the global
economy heads for a full recovery. In order for avoiding negative reaction by financial markets, communication and
guidance from central banks are quite important.
BOJ is going to release a review for the overall monetary policy in March, in which policy for purchasing ETF is expected
to be made more flexible to be gradually scaled-down.
(USD bil.) YoY change of assets in central banks' B/S
Forecast
(year)
Note: Data is from Jan 2010 to 31st January 2021. Forecast is up to Dec 2022.
(Source) Bloomberg, each central bank, compiled by SMDAM.
7Outlook for
Japanese Economy
8SMDAM Japanese economic outlook for FY20-22
SMDAM revised GDP forecast for FY2020, 21 and 22 by +0.8%, +0.2% and -0.1% respectively resulting from much
stronger than expected GDP for Oct-Dec 2020 quarter. Capital spending was stronger than preceding forecast led by
strong demand from overseas. Private consumption was quite robust partly lifted by “Go To campaign”, which was a
government incentive for traveling, eating and going events though it has been stopped due to COVID.
Expansionary fiscal spending and progress of vaccination are going to lift GDP from the latter half of FY2021.
( YoY %)
FY17 FY18 FY19 FY20E FY21E FY22E
Real GDP growth 1.8% 0.3% -0.3% -5.0% 4.3% 2.1%
Private Consumption Expenditure 1.0% 0.2% -1.0% -6.4% 4.3% 1.5%
Private Housing Investment -1.8% -4.9% 2.5% -7.4% 2.0% 2.2%
Private Capital Investment 2.8% 1.0% -0.6% -6.9% 3.9% 5.6%
Public Consumption Expenditure 0.3% 1.1% 2.0% 3.4% 1.5% 0.3%
Public Capital Investment 0.6% 0.8% 1.5% 4.5% 3.7% 1.4%
Net Exports (contrib. to GDP growth) 0.4% -0.1% -0.2% -0.9% 0.9% 0.1%
Exports 6.3% 2.1% -2.6% -11.5% 10.3% 6.1%
Imports 3.8% 2.8% -1.3% -6.7% 4.7% 5.8%
Nominal GDP 2.0% 0.2% 0.5% -4.3% 4.1% 2.4%
GDP Deflator 0.2% -0.1% 0.8% 0.7% -0.2% 0.3%
Industrial Production 2.9% 0.3% -3.6% -10.0% 11.0% 5.3%
CPI (excl. fresh food) 0.7% 0.8% 0.4% -0.6% 0.3% 0.5%
Note: E=SMDAM forecasts. SMDAM views are as of 16th Feb. 2021 and subject to updates thereafter without notice (%, YoY except Net Exports)
(Source) Cabinet Office, Bank of Japan, Ministry of Economy, Trade and Industry, Ministry of Internal Affairs and Communications, SMDAM forecasts
9Fiscal stimulus in Japan
Additional fiscal spending plan was created by the cabinet office and approved by the national diet in January.
Additional budget spending this time is 40 trillion yen, which is a little smaller than preceding two cases and 10 trillion
yen of reserve in June is counted again. SMDAM estimates its impact on Japanese GDP for FY2020,21 and 2022 to
be +0.2%, +0.7% and -0.3% respectively.
Budget plan for FY2021 was also created at massive 106.6 trillion yen.
Focus of spending is shifting to long term measures for renovating Japanese economy such as digitization and clean
energy.
Fiscal stimulus measures in Japan
FY2020 1st supplementary budget FY2020 2nd supplementary budget FY2020 3rd supplementary budget
spending spending spending
(Apporoved in April) (Approved in June) (Approved in January 2021 )
Total size Total size Total size
of the Fiscal of the Fiscal of the Fiscal
project project project
(Trillion yen) budget Central &
spending local
Fiscal
Investment
budget Central &
spending local
Fiscal
Investment
budget Central &
spending local
Fiscal
Investment
government & Loan government & Loan government & Loan
budget Program budget Program budget Program
1) Enhancing quarantine &
medical treatment, and 2.5 2.5 2.5 - N/A N/A 3.0 N/A 6.0 5.9 4.5 1.4
developing drug & vaccine
2) Renovating Japanese
51.7 18.4 13.4 5.0
economy
3) Maintaining employment
80.8 30.8 21.1 9.7 N/A N/A 14.1 N/A N/A N/A N/A N/A
and businesses
4) Spending for boosting
8.5 3.3 2.8 0.5 N/A N/A 4.7 N/A N/A N/A N/A N/A
economic recovery
5) Enhancing economic &
15.7 10.2 8.0 2.3 N/A N/A - N/A 5.9 5.6 4.4 1.3
social platform
6) Reserve for additional
1.5 1.5 1.5 - N/A N/A 10.0 N/A N/A N/A N/A N/A
measures
7) Full usage of reserves for
10.0 10.0 10.0
additional measures
Total 117.1 48.4 35.8 12.5 117.1 72.7 33.2 39.2 73.6 40.0 32.3 7.7
Note: As of 1st
Feb 2021
(Source) Cabinet Office, compiled by SMDAM
10Strong exports are continuing despite a slight decline in Dec 2020
In December 2020, exports to US notched down and total exports from Japan slightly declined. However, exports to
Asia, which is the biggest destination, increased led by machinery and transportation equipment. Exports to China
stays strong despite slight decline in December, which is considered to be temporary.
Manufacturing side of the Japanese economy is going to lead the recovery supported by robust exports.
(billion yen) Export volume to Asia ex. China
4200
4000
3800
Total export volume
3600
(billion yen) 3400
(seasonally adjusted, yen billion) 3200
3000
Jan-10 Jan-11 Jan-12 Jan-13 Jan-14 Jan-15 Jan-16 Jan-17 Jan-18 Jan-19 Jan-20
7500 (Month/Year)
(billion yen)
Export volume to China
1600
7000
1400
1200
6500
1000
800
6000 Jan-10 Jan-11 Jan-12 Jan-13 Jan-14 Jan-15 Jan-16 Jan-17 Jan-18 Jan-19 Jan-20
(Month/Year)
(billion yen)
Export volume to US
5500 1650
1500
1350
5000 1200
1050
Jan-10 Jan-11 Jan-12 Jan-13 Jan-14 Jan-15 Jan-16 Jan-17 Jan-18 Jan-19 Jan-20
900
(Month/Year) 750
Note: Data is from Jan. 2010 to Dec. 2020. 600
(Source) Ministry of Finance, Bank of Japan, compiled by SMDAM. Jan-10 Jan-11 Jan-12 Jan-13 Jan-14 Jan-15 Jan-16 Jan-17 Jan-18 Jan-19 Jan-20
(Month/Year)
11Business sentiment declined in January under a new state of emergency
PMI for Japan declined in January from 48.5 in the previous month to 46.7. Non-manufacturing side is suffering from a
new state of emergency declaration and restriction on businesses.
PMI for manufacturing sector showed resilience declining just by -0.3%. Also, sub-index shows solid recovery in new
orders in January, which is encouraging for the prospect of manufacturing activities.
Japan PMI Sub-index for Manufacturing PMI Sub-index for Non-manufacturing PMI
(Month / Year) (Month / Year) (Month / Year)
Note: Data is from Feb. 2018 to Jan. 2021.
Source: IHS Markit, BOJ, compiled by SMDAM.
12Economic sentiment is forecast to bounce back going forward
Economy Watcher Survey covers people working at economic sensitive jobs. Current condition DI in January dropped to
31.2, which was just as indicated by future condition DI in December. Future condition DI in January is pointing at sharp
recovery to 39.9.
Winter spread of COVID-19 is gradually calming down and current state of emergency is going to be lifted by early March.
(Year)
Note: Data is from Jan. 2012 to Jan. 2021. DI above 50 means condition is better than preceding 2 to 3 months.
(Source) Cabinet Office
13Labor market stopped deteriorating despite continuing COVID impact
Job vacancy / applicants ratio stopped deteriorating for the last three months until December last year. Further
deterioration might be coming for Jan-Mar quarter under a new state of emergency declaration though impact is going
to be smaller than the previous state of emergency in April and May in 2020. This time, restrictions are mostly on
restaurants & bars at night and other activities are still going. Theaters are open with limit of half capacity, shops are
open with earlier closing time and people are still moving.
In December, aggregated real wage declined due to large drop in nominal wage, which was caused by decline of
bonus and over-time working.
(%) Real wage payment (YoY %) Number of employees/ workers
(0,000) (tens of thousands) Job vacancy/ applicants ratio
5
4
3
2
1
0
-1
-2
Inflation
-3 Number of employees
-4 Nominal wage
Real wage payment
-5
2013
2014
2015
2016
2017
2018
2019
2020
(Year) (Year)
(Year)
Note; Data is from Jan. 2013 to Dec. 2020. Continuous sample basis. Note; Data is from Jan. 2013 to Dec. 2020. Note; Data is from Jan. 2013 to Dec. 2020.
(Source) Ministry of Health Labour and Welfare (Source) Ministry of Finance (Source) Ministry of Finance
14Fiscal & monetary policies are key events in 2021
US fiscal policy under the blue wave and monetary policies are most important events to watch.
Other focal points will be how Joe Biden and his team approach China.
Also important events not listed here would be how quickly COVID-19 vaccination will progress.
Upcoming key events
Month Region/Country Events Notes
2021 US 16-17 FOMC meeting
Japan 18-19 BOJ Monetary Policy Committee Meeting
March
China National People's Congress
EU 11 ECB Monetary Policy Meeting
US 27-28 FOMC meeting
Japan 26-27BOJ Monetary Policy Committee Meeting
April
EU 22 ECB Monetary Policy Meeting
G20 7-8 G20 meeting by finance ministers & heads of central banks
May Japan 1st preliminary estimate for Apr-Jun- 2021 GDP
July Japan 23 Tokyo Olympic Games (to 8th Aug)
September Japan 30 LDP leader Suga's current term ends
October Japan Limit for the lower house general election
(Source) Various publications, assembled by SMDAM
15Japan is still competitive in innovation, but has some weaknesses
According to World Economic Forum, Japan was ranked 8th in innovation among 137 economies, which is still
competitive, however on a moderate declining trend. As a strength, R&D in Japan is largely led by companies and
producing the largest number of patents in this ranking.
On the weak side, however, this company-led R&D tends to be “progressive” rather than “innovative” and often lacks in
global collaboration. Government initiative on innovation is stronger in economies such as US, Germany, Singapore and
China.
Facing with strong global competition in developing key technologies such as AI or Autonomous Driving Technology,
Japanese companies are changing approach to more open and more collaborating with global partners.
Global Competitiveness Ranking of Innovation among 137 economies
Switzerland U.S. Israel Finland Germany Netherlands Sweden Japan Singapore Denmark China
Innovation total 1st 2nd 3rd 4th 5th 6th 7th 8th 9th 10th 28th
Capacity for
a) 1 2 3 7 5 6 4 21 23 16 44
innovation
Quality of scientific
b) 1 5 3 8 11 4 13 14 12 16 36
research institutions
Company spending
c) 1 2 3 7 4 8 6 5 17 16 21
on R&D
University-industry
d) 1 2 3 4 7 5 10 23 8 21 28
collaboration in R&D
Gov't procurement of
e) advanced technology 37 2 11 20 6 19 17 23 5 39 10
products
Availability of
f) scientists and 12 2 6 1 11 19 20 8 9 44 29
engineers
g) PCT patents 3 10 6 4 7 9 2 1 12 8 30
Note: All numbers are rankings among 137 economies. Top 10 rankings are highlighted in green. Japan's relative weakness is highlighted in orange.
(Source): World Economic Forum, The Global Competitiveness Report 2017–2018
16Japanese society is changing slowly but steadily
It may look slow or even stagnant from outside, but Japanese society is making necessary reforms.
Many problems are stemming from deep rooted Japanese culture & social practice, which became apparent in the face
of “aging population” and “innovative disruption”.
Change of the deep rooted culture & practice should take time, however, it is making progress, and will eventually put
Japan in an advantage over other advanced economies, which also have aging population lagging Japan.
Hurdles for
Aging population
achieving business reform
Lifetime employment
Forcing Japanese Seniority based compensation
reform companies Rising social insurance costs
Inefficient working practice
Insufficient entrepreneurship
Innovative Shortage of new technology
disruption professionals, etc.
17Japanese society is changing slowly but steadily
Examples of long-term social challenges and progressing solutions
Source of problems Challenges Solutions
Unconventional "macro-slide" has been implemented to curb
pension payment increase referring to "low birth rate" and so on.
a) Pension system reform
Encourage people to continue working into 70's.
Encourage people to shift saving to investments. (NISA*, DC)
1. Aging population Capital investment for enhancing labor efficiency. (FA, AI, IoT,
autonomous driving car, renovating software, etc. )
b) Labor shortage Allowing more foreign workers.
Encourage people to delay retirement.
Support female workers. (increase nursery, etc.)
Pension system reform.
2. Weak Gradual adjustment of seniority based wage system to shift
c) Clearing peoples worry for the future
consumption compensation from elderly to younger workers.
life
propensity Increase of new generation companies.
Increase of young people working with non-seniority wage system.
Elder people to retire or continue working at lower wage.
3. Rigid Gradual adjustment of seniority based wage system.
d) Encouraging business structure
employment More fluid labor market enabling companies to make restructuring.
reform
practice Young people are not expecting lifetime employments and focusing
on building own career (already progressing).
4. Inefficient
e) Enhancing labor efficiency Work style reform to progress.
working practice
5. Insufficient
Increase of successful new generation companies.
entrepreneurship
f) Enhancing “challenge spirit” Increase of young people with skills of new technologies.
6. Shortage of new
g) Education reform Young and talented people choose new generation companies
technology
rather than old & large firms (already progressing).
professionals
Note: *NISA is “Nippon Individual Savings Account”. (Source) SMDAM
18Outlook for
Japanese Stock Market
19Investors’ keep focusing on strong economic recovery
SMDAM short-term view
Corporate earnings for Oct-Dec 2020 quarter came out strongly beating preceding forecasts. Manufacturing
industries are showing robust earnings recovery mainly led by strong exports. COVID vaccination is
progressing in many countries so far without serious health trouble and new infection cases are coming down
noticeably. SMDAM revised forecast range upwards based on higher EPS growth and rising risk appetite of
investors. Japanese stocks will attract global money with relatively attractive stock valuation and high
sensitivity to the global economy.
Longer-term outlook (6-months and beyond)
Global economy will gather strength after spring supported by calming down of COVID-19 infection and
recently approved fiscal stimulus to make positive effects on the economy. SMDAM expects strong stock
markets in 2021 meanwhile momentum could slow down a little. Monetary policy will stay expansionary,
however, central banks will start contemplating how to implement tapering of monetary easing without causing
hiccup in financial markets although BOJ will be the last among central banks to consider tapering.
Note: SMDAM’s projection is as of 15th Feb. 2021 and subject to updates without notice.
20Base scenario & Upside / Downside risks for our forecasts
Our Base Scenario is assuming the following views:
• Progressing vaccination of COVID-19 calms down infection and economic recovery gathers pace in the latter half of 2021.
• Severe tensions between US and China go on, however, US is going to avoid making a fatal blow to the global economy.
• Global economy sustains recovery path into 2021 and 2022.
• Japanese yen does not get extremely stronger beyond 100 yen against US$.
• Tension in the East Asia or Middle East does not get out of control.
• Central banks continue easing policies and avoid causing taper tantrum.
Upside Risks include:
• Stronger-than-expected global growth.
• US and China make significant concessions in the trade negotiations.
• Japanese economy gets stronger than expected boosted by large fiscal spending and strong exports.
Downside Risks include:
• Vaccination proves slow in taking effects of containing COVID-19 and restrictions on activities continue.
• Tensions between US and China escalate to ignite severe disruption in global trades.
• Seriously escalating geo-political tensions in Middle East & East Asia.
• Joe Biden fails to lead divided party and congress to achieve aggressive fiscal spending plan.
• Populism gains in Europe further destabilizing EU.
• Central banks start tapering of easy monetary policy causing negative shock to financial markets.
Note: SMDAM’s projection is as of 15th Feb. 2021 and subject to updates without notice.
21Current stock valuation for US looks still reasonable
PE Ratio (PER) and real interest rate (RI) have negative correlation, which is shown on the chart below.
Just before the stock prices collapsed due to COVID-19, PER was 19.45, 12M forward EPS (EPS) was 173.4 and RI
was -0.12%. It was close to the regression line. In September, COVID brought EPS down to 131.5, on the contrary
stock prices bounced back strongly, which combined together made PER rising to 27, which was the peak of PER.
Lately, PER was 23 based on EPS of 170, which almost recovered to the level before the COVID. Current position
on the chart looks reasonably valued and it could stay so if RI rises just slowly in line with gradual EPS growth.
PER (X) PER for S&P500 and US real interest rate
Real
interest
rate (%)
Note: Data is from 2nd Jan. 2017 to 12th Feb 2021. PER is based on 12M forward EPS forecast.
Real interest rates are calculated from Index linked US treasury bond and straight bond both 10Y maturity.
(Source) Bloomberg
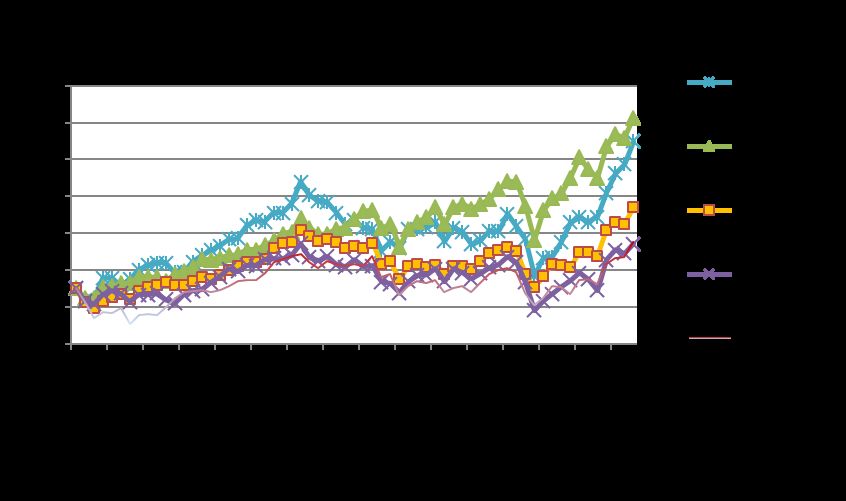
22Stock markets keep rising strongly
Emerging markets continue strong rally.
US market continue to rise renewing historical high.
In Japan, Nikkei 225 index (not shown on the chart) reached above 30,000yen, which was the first time after 30
years. TOPX index also reached a level recorded in June 1991, almost 30 years ago.
23EPS growth forecasts for the coming 12 months are rising sharply
EPS growth forecasts are rising to a quite high level for all countries and regions, which are in the backgrounds of the
continuing rally in the global stock markets. Japan showed the strongest growth momentum in January.
PE Ratio (PER) looks a little stretched, even after considering above mentioned EPS growth. How far US interest rates
are going to rise is an important factor if such elevated valuation levels can be sustained.
Difference in PBR reflects gap in ROE, however, Japan’s PBR at 1.48 looks attractive if corporate activities for improving
governance and shareholder return resume when economic environments gradually normalize.
24Current high PER requires rapid EPS growth to materialize
12M EPS consensus forecast has been bouncing back from September. Latest 12M forward EPS growth forecast for
TOPIX rose further to robust 37.6%.
Given the latest EPS forecast of 104, TOPIX at 1950 corresponds to PER of 18.7, which is much higher than the
historical range between 11 times and 15 times. This was initially caused by even more extreme valuation for US stock
prices, which was created by massive liquidity pumped in by central banks and sharp fall in bond yields. Current high
PER is assuming strong and sustainable recovery of economy and corporate earnings in 2021, and PER will gradually
come down to the normal range as such expectations materialize.
25SMDAM’s corporate earnings forecasts
SMDAM makes earnings forecast for 485 companies excluding financials in its corporate research coverage.
In the latest forecast on 4th December, recurring profits are forecast to decline by -14.2% in FY2020 and then recover by
38.6% in FY2021. When indexed with the latest high in FY2018 as 100, level of recurring profit for FY2019, 2020, 2021
are calculated at 77, 66 and 91 respectively. (“Recurring profits” in Japanese accounting means “earnings from
continuous businesses”, which is basically before tax and extraordinary items.)
In FY2021, profit recovery is forecast to be led by such industries as Railways, Auto, Wholesale Trading, Auto Parts and
Transportation, which are all forecast to show strong recovery from FY2020 results hit hard by COVID-19.
SMDAM Corporate Earnings forecasts (485 Companies research coverage excl. financials)
Fiscal year FY 2019 FY 2020E FY 2021E
Date of forecast Actual as of 4th Dec. 2020 as of 4th Dec. 2020
Sales (YoY %) -2.4% -9.7% 7.2%
Operating Profits (YoY %) -25.4% -13.1% 38.1%
Recurring Profits (YoY %) -23.2% -14.2% 38.6%
Net Profits (YoY %) -35.5% -8.2% 48.7%
Recurring profits (YoY %)
Manufacturing 289 companies -27.4% -8.4% 39.0%
Non-manufacturing 196 companies -17.4% -21.0% 38.0%
Note: Key assumptions for FY2020 & 2021 are Yen/US$ 105 and Yen/EUR 124.
(Source) SMDAM Corporate Research Group
26Foreign investors continue purchasing Japanese equities
Foreign investors continued purchasing Japanese equities since October last year.
ETF purchasing by BOJ shrank on the back of strong stock market. BOJ is going to release a review for the overall
monetary policy in March, in which policy for purchasing ETF is expected to be made more flexible to be gradually
scaled-down.
Many companies are postponing share buy-backs this fiscal year in the face of adverse business environments caused
by COVID-19. Share buy-backs are expected to recover in FY2021, which starts from April this year.
27Advancing Corporate Governance Code and Stewardship Code
Stewardship Code (SC) was set in February 2014. Investors are taking more pro-active approach in talking to the
companies and exercising proxy voting rights. Financial Services Agency discloses the name of institutional investors,
which publicly accepted SC.
After inception of Corporate Governance Code (CGC) in June 2015, pressure has been increasing on companies to
improve its governance, efficiency and shareholder returns.
These two codes have been progressively reviewed and enhanced, and making visible impact on the corporate behavior
and investors’ attitudes as shareholders.
In the recent amendment of CGC, companies are required to explain the rationale of “cross holdings” or “strategic
holdings” of other companies’ shares, which implicitly provide protection against takeovers and hostile shareholder
actions, and is often negative for achieving shareholder value.
SC was reinforced in March 2020 requiring investors to evaluate ESG factors.
Total number of institutional investors, which publicly
declared acceptance of the stewardship code
Trust banks 6
Investment management companies 191
Insurance companies 23
Pension funds 53
Others (include proxy voting advising companies) 7
Total 280
Note: As of 13th Mar. 2020.
(Source) Financial Services Agency
28Business restructuring is progressing for Japanese companies
Japanese companies are getting more and more willing to make positive business restructuring.
Number of M&A deals between Japanese companies (IN-IN) rose from 2,174 in 2006 to 2,814 in 2018 and further to
2,987 in 2019, which is an evidence that business restructuring is progressing in Japan.
Number of the deals of Japanese companies acquiring overseas businesses (IN-OUT) also rose from 421 in 2006 to 777
in 2018 and further to 824 in 2019.
29Behavior of Japanese companies are making positive changes
Share buyback is getting popular among Japanese companies as one of the powerful tools for disposing of accumulated
liquidity in the B/S and enhancing EPS growth as well as ROE. After recording a historical high in FY2019, share buy-
backs are constrained by COVID-19 impact in FY2020 and FY2021.
Dividends also renewed historical record in FY2019. After a setback in FY2020 due to COVID-19, dividends are forecast
to make a quick recovery in FY2021.
30Disclaimer Please read this disclaimer carefully. This material is for non-Japanese institutional investors only. The research and analysis included in this report, and those opinions or judgments as outcomes thereof, are intended to introduce or demonstrate capabilities and expertise of Sumitomo Mitsui DS Asset Management Company, Limited (hereinafter “SMDAM”), or to provide information on investment strategies and opportunities. Therefore this material is not intended to offer or solicit investments, provide investment advice or service, or to be considered as disclosure documents under the Financial Instruments and Exchange Law of Japan. The expected returns or risks in this report are calculated based upon historical data and/or estimated upon the economic outlook at present, and should be construed no warrant of future returns and risks. Past performance is not necessarily indicative of future results. The simulated data or returns in this report besides the fund historical returns do not include/reflect any investment management fees, transaction costs, or re-balancing costs, etc. The investment products or strategies do not guarantee future results nor guarantee the principal of investments. The investments may suffer losses and the results of investments, including such losses, belong to the client. The recipient of this report must make its own independent decisions regarding investments. The opinions, outlooks and estimates in this report do not guarantee future trends or results. They constitute SMDAM’s judgment as of the date of this material and are subject to change without notice. The awards included in this report are based on past achievements and do not guarantee future results. The intellectual property and all rights of the benchmarks/indices belong to the publisher and the authorized entities/individuals. This material has been prepared by obtaining data from sources which are believed to be reliable but SMDAM can not and does not guarantee its completeness or accuracy. All rights, titles and interests in this material and any content contained herein are the exclusive properties of SMDAM, except as otherwise stated. It is strictly prohibited from using this material for investments, reproducing/copying this material without SMDAM’s authorization, or from disclosing this material to a third party. Registration Number: The Director of Kanto Local Finance Bureau (KINSHO) No.399 Member of Japan Investment Advisers Association, The Investment Trusts Association, Japan and Type Ⅱ Financial Instruments Firms Association © Sumitomo Mitsui DS Asset Management Company, Limited
You can also read