Global Investment Weekly 2019.03.11 - CTBC Private Banking
←
→
Page content transcription
If your browser does not render page correctly, please read the page content below
Global Investment Weekly
2019.03.11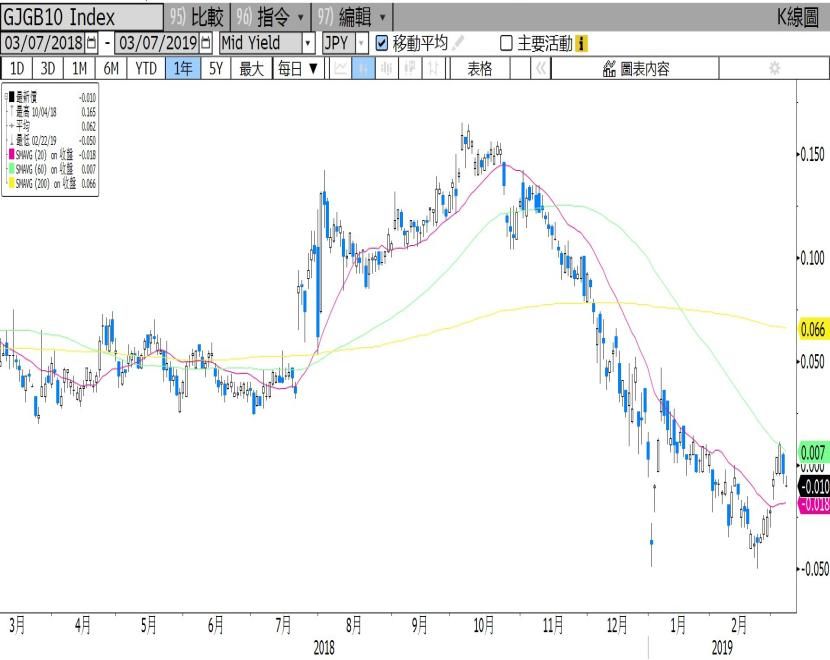
Market Calendar, 2019/3
                 W1(3/1-3/8)               W2(3/10-3/15)              W3(3/17-3/22)      W4(3/24-3/29)
                 Composite PMIs(1)         UK Parliament Vote         US NAHB Housing    US 4Q18GDP(28)
                 RBA Meeting(5)            (12~15)                    Market Index(18)   IFO Expectation(25)
                 Euro zone                 BOJ Meeting (15)           Germany ZEW(19)    US Durable Goods
       DM        4Q18GDP(7)                US NFIB Small              EU/JP PMI(21)      Orders(26)
                 ECB Meeting(7)            Business                   FOMC Meeting(21)   Brexit Deadline(29)
                 Japan 4Q18GDP(8)          Optimism(12)               BOE Meeting(21)
                 US Nonfarm                EU27 New Car               Germany PMI(22)
                 Payroll(8)                Registrations(15)          EU Summit(21~22)
                                           US Consumer
                                           Confidence(15)
                                                                      BOT Meeting(20)
                                           China Social               Taiwan Export
       EM                                  Financing(10)              Orders(20)         SARB Meeting(28)
                                           China Retail Sales         BCB Meeting(20)
                                           And Industrial             CBC Meeting(21)
                                           Output(10)                 CBR Meeting(22)

    S ector

   S ur pr ise

     E vent
     Market                               NPC/CPPCC Commentary
     Topic                                And Equity/FI/FX Strategy

Source: Compiled by CTBC Bank, 2019/3/8
                                                                                                          1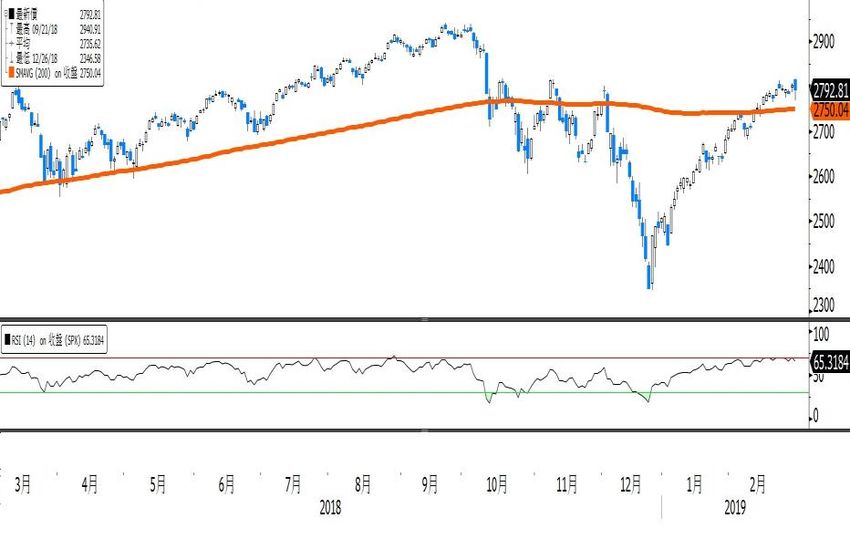
Investment Strategy Summary
With Market Realizing Positive News, Cautious On Retracement
NPC/CPPCC: 2019 Policy Target No Surprises
Market China-A: Limited Room In Short-term But Not Pessimistic
Topics CNH: Close To PBOC Satisfactory Level, Pressure To Weaken
China Bond Strategy: Supply Concern And Rising Defaults
ECB: ECB Turning Dovish
EUR: EUR Weakness In 1H19 Unlikely To Change
Policy
EU Rates: Outlook Concern/Event Risk, Downgrade
Change Germany/UK Rates
BOJ: Unlikely To Change In Mar, Apr Meeting Crucial
Investment US Strategy: 2800 Breakthrough Requires Positive News
Strategy Energy: Geopolitics Affects 2019 Oil Price And Energy Sector
Source: Compiled by CTBC Bank, 2019/3/8
2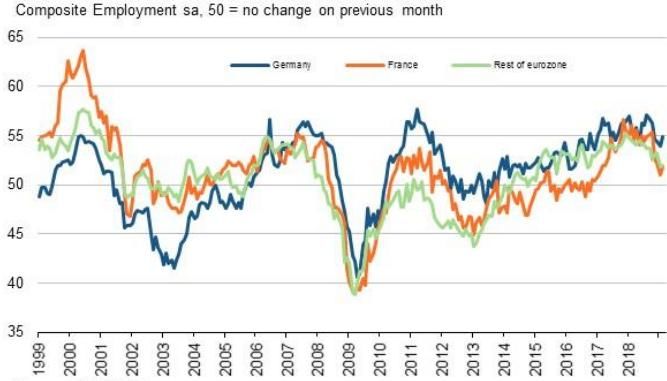
Agenda

Part I Macro and Market Review

Part II Short-Term Focus and Strategy

                                    3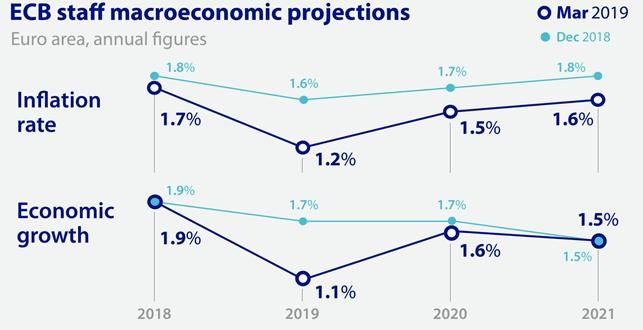
Macro Review
Economic Data Release Review(3/1-3/7)
Macro Data: Fed Beige Book indicated 10 of the 12 regions expanded moderately with tight labor market. In addition,
ADP employment reached 183k, comparable to nonfarm payroll forecast (190k) due to release on 3/8, showing US
overall economic growth though slowed but still keep up with some momentum. Only some indicators exhibited positive
signs in EU, unlikely to reverse the current Euro Zone economic plight. Take Feb PMI as example, Manufacturing PMI
released early of the month fell to contraction zone of 49.3 but with services sector recovery, the composite PMI rose to
51.9 with leading indicator new orders and new export orders remaining weak. ECB 3/7 meeting focus: 1. maintaining
rate but downgrade growth and inflation forecasts with 2019/2020 GDP growth downgraded to 1.1% and 1.3% from
1.7%, 2. New quarterly TLTRO from 2019/9 to 2021/3 with each duration of 2 years to maintain benign bank lending.
Release Date Country Economic Data Period Consensus Actual Prior
03/01/2019 23:00 US ISM Manufacturing Feb 55.8 54.2 56.6
03/01/2019 23:00 US U. Of Mich. Sentiment Feb F 95.9 93.8 95.5
03/01/2019 17:00 EC Markit Euro Zone Manufacturing PMI Feb F 49.2 49.3 49.2
03/01/2019 16:55 GE Markit/BME Germany Manufacturing PMI Feb F 47.6 47.6 47.6
03/05/2019 17:00 EC Markit Euro Zone Services PMI Feb F 52.3 52.8 52.3
03/05/2019 17:00 EC Markit Euro Zone Composite PMI Feb F 51.4 51.9 51.4
03/05/2019 23:00 US ISM Non-manufacturing Index Feb 57.4 59.7 56.7
03/05/2019 11:30 AU RBA Cash Rate Target Mar 5 1.50% 1.50% 1.50%
03/06/2019 21:15 US ADP Employment Change Feb 190k 183k 213k
U.S. Federal Reserve Releases Beige
03/07/2019 03:00 US Book
03/07/2019 20:45 EC Euro Zone Main Refinancing Rate Mar 7 0.00% 0.00% 0.00%
Source: Bloomberg, Compiled by CTBC Bank, 2019/3/7
4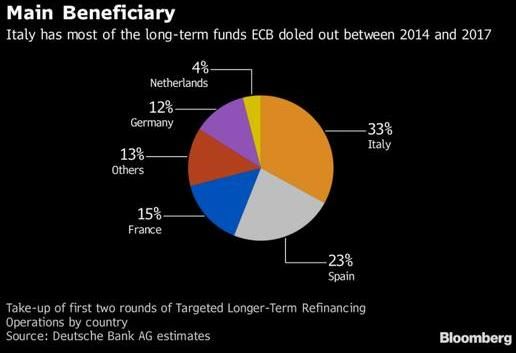
Market Review
Without Further Positive Events, Equity Retraced Under Selling Pressure
Country: Most markets fell in the past week with only Chinese equities relatively stronger with the support of
NPC/CPPCC policies. Though there is no reason to be pessimistic in the short-term, profit taking activity surged without
further positive news.
Sector: Weak outlook data of major countries and delay of ECB rate hike led to resurgence of market concern on
corporate outlook. Cyclical sectors such as Financial, Industrial and Resource fell this week while real estate, utilities,
telecom and consumer staple were relatively resilient as US 10-yr treasury yield consolidated around 2.6%. Healthcare
lost the MTD gains as US FDA head resigned and Democrats proposed Medicare-for-all in the House of Reps.
Global Equity Index Change Global Sector Index Change
Source: Bloomberg, past month is for 2018/2/4~2019/3/6, past week is for 2019/2/28~2019/3/6.
Sector indices based on Morgan Stanley Capital International (MSCI) global 11 sectors. 5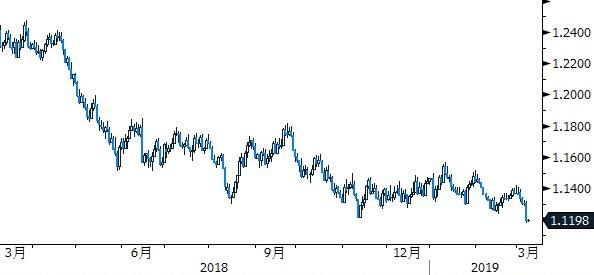
Market Review
ECB Easing Caused Market Concern Over Economy
FI: Financial market volatility caused DM bonds yield spread to widen. ECB policy expectation supported the
performance of EU HYBs but weakening EUR dragged the return of EU HYBs in dollar terms. EM bonds were also
pressurized by the concern over slowing global economic growth. Though local currency bond index yield did not
change much in the past week, FX loss had adverse impact on total return. China government report was positive to
the Chinese equity market rally so Asian HYBs and Asian bonds outperformed.
FX: ECB was more dovish than market expected, hitting EUR 1% weaker. European currencies such as GBP and CHF
depreciated as well. With rising market concern over future economic outlook, volatile currencies such as ZAR and
LatAm currencies depreciated significantly.
Global Bond Index Change Global FX Change (Against USD)
Source: Bloomberg, past month is for 2018/2/4~2019/3/6, past week is for 2019/2/28~2019/3/6
Note: Bonds take BAML Bond Index price change in the period. FX is against USD. 6
NPC/CPPCC
NPC/CPPCC 2019 Policies And Targets In Line With Expectation
2019 Government Work Report, Fiscal Policy At Focus: In 2019/3/5 NPC, Primer Li downgraded China 2019 GDP
growth target to 6%~6.5% in the government work report, in line with market expectation. We think 2019 6% would be the
bottom line for economic growth. Monetary policy removed ‘neutral’ but stressed no liquidity flooding and skewing focus to
SME. Fiscal policy was at focus of the report with deficit widening to 2.8%, slightly lower than we expected. But LGFV
would increase ¥800B to boost infrastructure investment. VAT and Social Security cut of ¥ 2trillion would alleviate corporate
burden. Employment was the focus of authority this year with more subsidies for hiring retrenched workers.
Focus After 3/15 Meetings Conclusion: Authority 2019 policy focus was in line with market expectation, alleviating
downward pressure with mainly fiscal policy and moderately monetary ease. The combination could improve outlook with
limited scope and long time. Votes of Foreign Investment and Intellectual Property Right bills next week might fuel positive
progress of Sino-US trade talk. Tech Board would be online soon as another milestone of 2019 capital market reform.
2019 Key China Policies And Targets
2017 2018 2019
Proactive, Tax Cut Policy/Target
Fiscal Target Actual Target Actual Target
GDP 6.5% 6.8% 6.5% 6.6% 6~6.5%
CPI 3% 1.6% 3.0% 2.1% 3.0%
Monetary Balanced Reasonable
M2 12% 8.1% 8.1%
Growth Match Nominal
Reasonable GDP Growth
New Social Funding 12% 12% 9.8%
Focus Employment Growth
Investment(%) - 7.2% - 5.9% -
Consumption(%) - 10.2% - 9.0% -
Downgrade 2019 Economic Growth to 6% ~6.5%
Industrial Production(%) - 6.6% - 6.2% -
Stable to Stable to Higher
Trade Growth(%) Recovery 14.2% 9.8%
Better Quality
Fiscal Deficit(trillion¥) 2.38 2.38 2.38 3.08 2.76
Deficit/GDP(%) 3.0% 2.9% 2.6% 3.4% 2.8%
New Urban Employment 11mil 13.51mil 11mil 13.61mil 11mil
Source: Compiled by CTBC Bank, 2019/03/07
7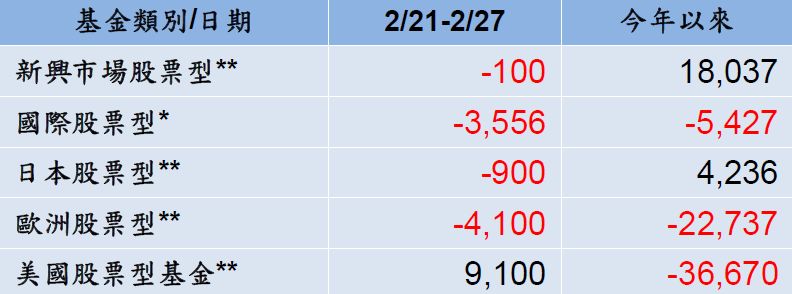
China Equity Strategy
Limited Short-term Room For SHCOMP But Not To Be Pessimistic
Cooling Trade War, SHCOMP Recouped Losses:
SHCOMP lost over 20% since trade war from April 18. As
Strong Performance During NPC/CPPCC
Sino-US trade talk restarted and global liquidity eased, Past 10-yr Performance During NPC/CPPCC
NPC/CPPCC Period(3/3-3/15)
SHCOMP has rebounded more than 20% to 3000-3100
pts with the hope of government stimulus policies.
滬指平均漲幅(%) 上漲機率(%, 右)
8 80
Outlook And Liquidity Critical: China deleveraged last 7 70
year when oil price surged and EM countries hiked to 6 60
curb inflation, tightening onshore and offshore liquidity. 5 50
4 40
This round of liquidity fueled rally was against the weak 3 30
outlook. Whether equity falls to reflect fundamentals or 2 20
easy money boosting outlook would depend on PBOC. 1 10
0 0
Limited room in short-term but not to be pessimistic.
前五個交易日 前三個交易日 兩會期間 後三個交易日 後五個交易日
A Share Recouped Loss Since Trade War A Share Rebound Diverged From AUD
SHCOMP SHCOMP vs. AUD
3600
3500
3/22 Trump 上證指數 澳幣兌美元
3400 3800 0.8
Signed 301 MOU
3300 3600 2016-2019 Correlation 0.79 0.8
3200
3100 3400 0.8
3000 3200 0.8
2900 6/15 USTR released
2800 $50B tariff final list
3000 0.8
2700 9/24 10% tariff on $200B +24% 2800 0.7
2600 goods, to rise to 25% on 1/1 2600 0.7
2500 12/2 G20 Trump-Xi agreed 90-
day delay of 25% tariff 1/7 US team visited China
2400 to restart negotiation
2400 0.7
2018/1 2018/3 2018/5 2018/7 2018/9 2018/11 2019/1 2019/3 1/1/2016 1/1/2017 1/1/2018 1/1/2019
Source: (Bottom)Bloomberg, 2019/3/5, (Top)Datapay, Sina Finance, Compiled by CTBC Bank
8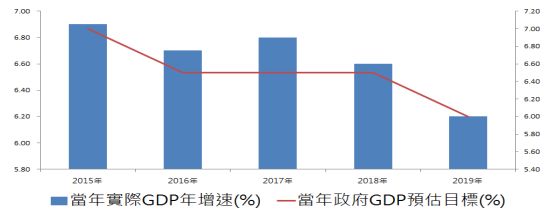
CNH Strategy
No Competitive Devaluation, Less Likely To Touch 7, Limited Upside
USD/CNH Weak Outlook For Depreciation But Sino-US Deal
Limited It: NPC/CPPCC stimulus largely met market
Upward Downward 2Q19 6.85
expectation but took time to realize. Manufacturing PMI
Deviated Realized Quant Voluntary was still in the contraction so CNH would still weaken
Reason: Sino-US negotiation accelerated. Market after positive trade news. But Sino-US MOU might
expects the MOU might be signed by the end of March, contain FX content and China reiterated not to conduct
earlier than prior consensus. The MOU is also likely to competitive devaluation. CNH is unlikely to reach 7.
include currency related contents. The base case is to
promise no competitive devaluation of CNY. Compared CNY Close To PBOC Satisfactory Level: In the rally
to qualitative items such as intellectual property rights, of early 2017, PBOC removed forward margin when
foreign market entry barrier, forced technological CFETS RMB index reached 95 and USD/CNY in 6.6-
transfer and hidden subsidies, FX and commodity 6.7 range, exiting intervention. CNY is currently at this
purchase would be priority implementation items. Weak
level so room for further appreciation would be limited.
outlook points to depreciation but at lesser extent.
Sino-US MOU To Include Currency Clause CNY Close To Level PBOC Satisfactory With
Policy Possible Measures
Remove FX
Trade Deficit China promises to purchase more US goods
Forward
Margin USD/CNY(L)
Tech China to stop ‘Made In China 2025’ subsidy, remove
forced technology transfer, protect intellectual property
rights, stop cyber theft
Market Entry China to remove entry restriction on US investments, CFETS RMB Index(R)
lower tariff and remove non-tariff barriers
Assessment Quarterly review with tariff threat
Currency China promises not conduct competitive devaluation
Source: (Bottom Left)Bloomberg Economics, 2019/2/27, Compiled by CTBC Bank, 2019/3/7, (Bottom Right)Bloomberg, 2019/3/6
9China Bond Strategy
Increased Supply Negative To Bonds, Cautious On Rising Default Pressure
Fiscal Easing Negative To Lowering Chinese Bond Yield: In light of slowing economic growth, government work
report mentioned ‘to reinforce and improve efficiency of proactive fiscal policy’, forecasting ¥2.76 trillion fiscal deficit in
2019. Though fiscal deficit at 2.8% is lower than the international safe level of 3%, but still higher than 2.6% of 2017
while LGFV bonds would increase ¥ 2.15 trillion. Though monetary easing policy target remains, widening fiscal deficit
concern and increasing issuance size would limit the downside room for yield. Strength of corporate bonds in the past
was mainly from the falling benchmark rates, less from narrowing spread. Unless SMEs could obtain liquidity more
easily from the financial system, the corporate bond performance would be adversely affected.
Corporate Bond Defaults, High Credit Risk: Chinese defaults did not improve. As China has downgraded economic
growth while monetary easing failed to deliver, bond defaults have spread from private companies to LGFVs with
Qinghai Investment USD bond delaying interest payment, triggering market concern of local government supports.
Chinese default size reached ¥14.7B YTD. Bloomberg data showed ¥200B bonds to be repaid this year with Mar/Apr as
the peak of repayment for lower rating bonds. High rating policy or quasi-sovereign bonds were still preferred.
Widening Fiscal Deficit Raised Concerns First 2 Months Default Size At Historical High
Source: (R)Bloomberg, 2019/3/5, (L)China Ministry Of Finance, Compiled by CTBC Bank, 2019/3/7
10Agenda
Part I Macro and Market Review
Part II Short-Term Focus and Strategy
11ECB
Highly Dovish ECB To Delay Rate Hike And Start New TLTRO
ECB Meeting Pessimistic About Growth This Year: The meeting held rate unchanged but downgraded economic
growth and inflation forecasts with 2019/2020 GDP growth rate downgraded to 1.1% and 1.3% respectively, and stated
economic growth outlook still faced downside risk. In terms of forward guidance, it expects to maintain the low rate
unchanged until ‘at least through the end of 2019’ (‘at least through the summer of 2019’ in prior meeting). Reinvestment
was consistent with the prior meeting citing it would persist until a fairly long period after first rate hike.
Provide Banking Liquidity, Boost Current Easing Policy: Implement quarterly TLTRO with each duration of 2 years,
starting fro 2019/9 to 2021/3 to maintain the good lending environment. TLTRO between 2014 and 2017 would gradually
mature after 2020/6. Without new round of low rate loans to banks, Italy and Spain financial institutions would be hit the
most. As Draghi said, short-term Euro zone outlook was worse than expected so ECB stayed cautious to ‘increase the
resilience of economy’, clearly turning dovish.
ECB Downgraded Growth And Inflation Forecast Italy And Spain To Benefit From New TLTRO
Source: (L)ECB, 2019/3/7, (R)Bloomberg, 2018/11/3
12EUR Strategy
ECB More Dovish Than Expected, EUR To Maintain Weakness In 1H19
EUR Plunged After ECB Meeting: ECB was more dovish than market expected. Though we previously believe EUR to
consolidate at low in 1H19, but 1% depreciation of EUR after meeting was still weaker than our expectation. As EUR is the
heaviest weighted currency in DXY(57%), it boosted DXY to close at 97.67, rising to Dec high intraday.
EUR To Maintain Weakness In 1H19: ECB new round of TLTRO was within market expectation. It was mainly to solve
interbank credit and liquidity issue instead of massive easing. According to Goldman Sachs analysis, monetary easing
would be negative to EUR but credit improving policy would actually be positive to EUR. The real reason for EUR plunge
was a more dovish ECB than market expected. Besides amending to keep the low rate ‘at least through the summer of
2019’ to ‘at least through the end of 2019’ in the forward guidance, more importantly ECB slashed economic growth
forecast with 2019 from 1.7% to 1.1% and large downgrade in 2020. Economic outlook concerns increased financial
market volatility, leading EUR to breach the lower end of consolidation range. Without real improvement in global economy,
we hold 1H19 EUR weakness, USD strength. 2H19 EUR recovery relies on the effect of China/Eurozone stimulus policy.
EUR Breached Range Low After ECB Meeting Weak EUR Not From TLTRO But Outlook Concern
Monetary Easing Improving Credit
Impact On EUR Policy Impact
On EUR
Source: (L)Bloomberg, 2019/3/8, (R)Goldman Sachs, 2019/2/28
13Rate Strategy
Outlook Concern And Delayed Rate Hike, Cut Germany 10Y Yield Target
Euro Zone PMI Deteriorated: Fed composite PMI final
Germany 10-yr Treasury Yield
rose to 51.9 but manufacturing fell to 49.3. New orders
Upward Downward 1Q19 0.30% and new export orders were both underperforming in
Deviation Realized Quant Voluntary manufacturing, but improvement in employment index
could help Euro Zone to avoid recession.
Reason: ECB has set the dovish tone. As weak
manufacturing is one of the three major risks, PMI fell Outlook Risks Downward, Rate Hike Delay: Draghi
below 50 indicated it would take time to confirm outlook mentioned three major risks and stated relevant outlook
bottoming out. Germany treasury yield was still under
factors could ‘stay in a longer time’. Conclusion:
pressure in the short-term so we downgrade 1Q19 and
2Q19 target price to 0.30% and 0.35% respectively. maintain the low rate until end of 2019 and implement
TLTRO. Major countries’ treasury yield fell significantly.
Improved Employment Bright Spot In Feb PMI Slowing Outlook Not Recession, Cautious ECB
Source: (L)IHS Markit, 2019/2/1, (R)Bloomberg, 2018/7/21~2019/3/7
14Rate Strategy
BOE Turned Dovish, Benchmark Yield Would Be At Low
BOE Turned Dovish, Yield Cliff Fell: BOE governor
GILT 10-yr Yield Carney stated the “fog of Brexit” was creating a series
Upward Downward 1Q19 1.35% of tensions in the economy so BOE downgraded
Deviation Realized Quant Voluntary 2019/2020 GDP growth forecast to 1.2% and 1.5%,
lowest in 10 years, widely interpreted as a dovish BOE.
Reason: BOE turned dovish so investors further
delayed the expected rate hike, depressing treasury Falling Inflation: Due to falling oil price in 4Q, Jan
yield. Brexit vote was extended to 3/12, increasing the inflation fell to 1.8%, first time in 2 years to fall below
risk of no deal Brexit shock. Considering outlook and BOE’s 2% target. In the N6M, with lower energy price
inflation stable, we downgrade 1Q19/2Q19 target to
and weaker pound, inflation might not hit BOE target of
1.35%.
average 2.2% set last year.
BOE Slashed GDP Forecast GILT 10-yr Yield Fell After Dovish BOE
Brexit Uncertainty
Triggered BOE to
Slash The GDP
Growth Forecast
For 2019/2020
Source: (L)Goldman Sachs, 2019/2/7, (R)Bloomberg, 2018/8/24~2019/3/7Rate Strategy
South Africa Inflation Surprisingly Fell, SARB Rate Hike Unlikely
Jan Inflation Surprisingly Fell Below 4.5% Target:
SARB Policy Rate Jan inflation fell from prior 4.5% to 4%, much lower than
Upward Downward 1Q19 6.75% market consensus of 4.3%, mainly due to food and
Deviation Realized Quant Voluntary transportation price slide. Fuel prices such as crude oil
have fallen to ease inflationary pressure.
Reason: Expect weak oil price would lower petroleum
price in SA to 10-month low. Without major depreciation Weak Outlook Does Not Support Rate Hike: As
in ZAR, import price inflation was contained. SARB leading indicator has fallen slightly, South Africa outlook
would be less concern about inflation so we downgrade was not very optimistic. With 2019 budget bailout of
the rate target to remove the prior one hike expected.
Eskom ruled out other infrastructure investment and
We think SARB would maintain 6.75% unchanged.
electricity shortage due to strike, outlook was dim.
Recent Low Inflation Hit Mar Rate Hike Chance Leading Indicator Fell, Uncertain Outlook
110
Transportation Price 108 Leading
Fall led Dec CPI
YOY to go lower 106
104
102
100
98
96
94
92
2016/10/1
2016/12/1
2017/10/1
2017/12/1
2018/10/1
2016/2/1
2017/4/1
2018/6/1
2016/4/1
2016/6/1
2016/8/1
2017/2/1
2017/6/1
2017/8/1
2018/2/1
2018/4/1
2018/8/1
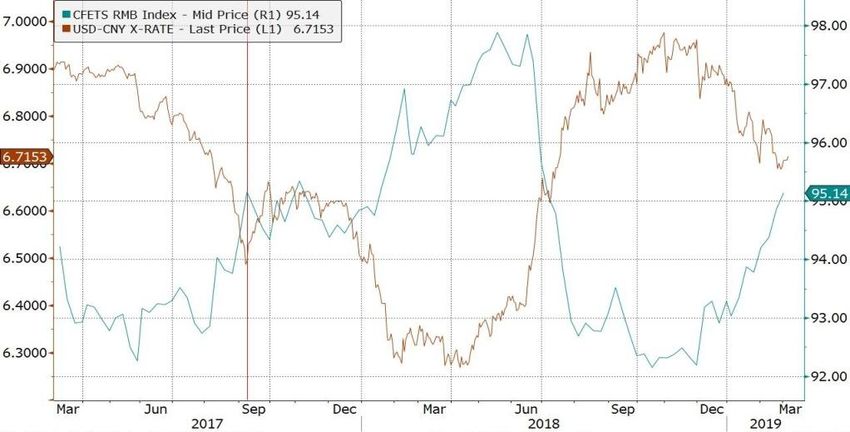
Source: (L)JP Morgan, 2019/2/23, (R)Bloomberg, 2016/2~2018/12BOJ
Hardly Any Move In Mar BOJ, Apr Meeting Crucial
Japan Manufacturing Outlook Still Unclear: Japan Jan export fell 5.3% MOM, the largest fall since Sep 18. Jan industrial
production fell 4.3% while Feb manufacturing PMI fell to 48.9. Though Japan manufacturing momentum continues to be
weak, domestic related outlook was relatively stable with Fed services PMI returning to 52.3.
Hardly Any Move In Mar BOJ, Apr Meeting Crucial: Considering the mixed Japan outlook and current levels of JPY and
10-yr JGB yield, we think BOJ Mar meeting would not have large changes. But Apr BOJ meeting would be more important
as BOJ would release yearly economic outlook forecast up to 2021. If global outlook does not improve with major central
banks continue to be dovish, we think BOJ might change its attitude towards easing. Though the benchmark rate is likely to
be held, BOJ might increase the bond purchase program to lower the yield.
Jan Japan Manufacturing data Were Weak Japan 10-yr Treasury Yield At The Low
Japan 10-yr Treasury Yield Returned To
Positive, Expect Consolidation At Low
Source: (L)Nomura, 2005/01~2019/01, (R)Bloomberg, 2018/03~2019/03
17US Equity Strategy
2800 Resistance Breakthrough Requires Multiple Factors
US Equity Reflected Dovish Fed And Lower Trade Risk: US
US Equity Reflected Dovish Fed/Sino-US Talk
equity has rallied 11% YTD with P/E ratio returning to long-term
average, reflecting the dovish Fed and lower trade risk. Market Monitoring Factors Market Reaction
rumored trade deal to sign on 3/27, expect diminishing impact. Fed Turning Dovish Upward
US Equity Faces 2800 Resistance, Breakthrough Requires
Optimistic Sino-US Talk Upward
Multiple Factors: S&P500 has challenged and failed to break
through 2800 since Aug 18. While it approaches 2800 again, we Corporate Earnings Neutral
think, in the Mar windows period of financial results, further rally Confidence
requires US economy to bottom out, automotive trade deal to US Economy Bottom-out Neutral
progress, Fed to confirm the end of QT. Any of the above news
could trigger market volatility. Fundamental Downward
US Equity Faces 2800 Resistance Hurdle US Equity Fund Outflow YTD
Unit: Mil USD
Resistance: 2800
200DMA
>70 Overbought
RSI (14D)Energy Strategy
Geopolitics Affects 2Q19 Oil Price And Energy Sector
1Q19 Crude Oil Balanced: Saudi planned to further cuts in Mar but Russia planned to accelerate its behind schedule
cuts in end of Mar/Apr while US production and inventory rose. Overall we maintain 1Q19 Brent $66/barrel target.
Expect 2Q19 Oversupply Narrows: 1. Venezuela sanction cuts its output, 2. US oil rig count 1Q19 fell, negative to
upstream equipment sector, delaying 2Q19 US oil production, 3. US to maintain current waiver of Iranian oil in May, 4.
Expect OPEC+ only to respond to Trump oil policy in amending output cut in Jun. With 3Q19 demand recovery, we
expect OPEC+ to shrink output cut with Brent in $60~70/barrel in 2Q19.
Sino-US Deal Increases US Oil/Gas Purchase Benefits Energy Sector In 2H19: Sources of China crude oil import
were dispersed from Russia (15%), Saudi(11%), Iraq and Angola. US crude export average 1900k barrel/day last year
with 250k to China. With rising US oil output and export, if China boosts US purchase, 2H19 premium between Brent
and WTI could reduce from $10 to $6. China LNG import is 60% of total gas import, mainly from Australia, Qatar and
Malaysia totaling 72% and only 4% from US. Higher purchase will benefit US Integrated Energy Producers.
2Q19 Oil Price Affected By US, OPEC+ US Waiver Of Iranian Oil Scenario Analysis
Maintain If Brent is above $65/barrel in early May, US is
Current likely to maintain the current waiver, 2Q19 Brent
Waiver target would be $66/barrel
Cut If Iran oil export reduces 150k-250k barrels/day,
Waiver oil price could rise $2/barrel
Total If Iran oil export reduces 500k barrels/day, oil
Ban price could rise $5/barrel
Source: Bloomberg, 2019/3/6, Compiled by CTBC Bank, 2019/3/6
19Target Price
Target Price – Rates/FI
Source: Compiled by CTBC Bank, 2019/3/8 : TP Adjustment
20Target Price
Target Price - Equity
Source: Compiled by CTBC Bank, 2019/3/8 : TP Adjustment
21Target Price
Target Price – FX/Commodity
Source: Compiled by CTBC Bank, 2019/3/8 : TP Adjustment
22GENERAL DISCLAIMERS:
1. This document and the investments and/or products referred to herein are for information only and do not have regard to your specific investment objectives, financial situation or particular needs.
2. This document and the investments and/or products referred to herein should not be construed as any recommendation for you to enter into the investment briefly described above and this document must
be read with CTBC’s General Terms and Conditions including without limitation Risks Disclosure Statements, Supplemental Terms and Conditions and such terms and conditions specified by CTBC from time to
time.
3. You are advised to exercise caution in relation to this document. If you are in any doubt about any of the contents of this document, you should obtain independent professional advice from a licensed or
exempt financial adviser before making your commitment to invest in the investments and/or products referred to herein.
4. If you choose not to seek advice from a licensed or exempt financial adviser or such other independent professional, you should carefully consider whether investment in the investments and/or products
referred to herein is suitable and appropriate for you taking into consideration the risks and associated risks.
5. The final terms and conditions of the proposed investment in the investments and/or products referred to herein will have to be set out in full in the definitive trade confirmation between CTBC and you.
6. CTBC does not guarantee the accuracy or completeness of any information contained herein or otherwise provided by CTBC at any time. All of the information here may change at any time without notice.
7. CTBC is not responsible for any loss or damage suffered arising from this document.
8. CTBC may act as principal or agent in similar transactions or in transactions with respect to the instruments underlying the transaction.
9. Until such time you appoint CTBC, CTBC is not acting in the capacity of your financial adviser or fiduciary.
10. Investments involve risks. Past performance figures, predictions or projections are not necessarily indicative of future or likely performance. Actual performance may differ from the projections in this
document.
11. Any references to a company, financial product etc is used for illustrative purpose and does not represent our recommendation in any way.
12. Any scenario analysis is provided for illustrative purpose only and is no indication as to future performance and it does not reflect a complete analysis of all possible scenarios that may arise under an actual
transaction. All opinions and estimates given in the scenarios are illustrative and do not represent actual transactions.
13. The information in this document must not be reproduced or shared without our written agreement.
14. This document does not identify all the risks or material considerations that may be associated with you entering into of the transaction and the transaction period you wish to consider.
15. This document does not and is not intended to predict actual results and no assurances whatsoever are given with respect thereto. It does not present all possible outcomes or takes into consideration all
factors that may affect or influence the transaction.
16. This document is based on CTBC’s understanding that you have inter alia sufficient knowledge, experience and access to professional advice to make your own evaluation and choices of the merits and risks
of such investments and you are not relying on the CTBC nor any of our representatives or affiliates for information, advice or recommendations of any sort whatsoever.
17. You should have determined without relying on CTBC or any of our representatives or affiliates for information, advice or recommendations of any sort whatsoever, the economic risks and merits as well as
the legal tax and accounting aspects and consequences of the transaction and that you are able to fully assume such risks.
18. CTBC accepts no responsibility or liability whatsoever for any loss of whatsoever nature suffered by you arising from the use of this document or reliance on the information contained herein.
19. CTBC may have alliances with product providers for which CTBC may receive a fee and product providers may also receive fees from your investments.
20. The following exemptions under the Financial Advisers Regulations apply to the CTBC and its representatives:
(1) Regulation 33(1) – Exemption from complying with section 25 of the Financial Advisers Act (“FAA”) when making a recommendation in respect of (a) any designated investment product (within
the meaning of section 25(6) of the FAA) to an accredited investor; (b) any designated investment product (within the meaning of section 25(6) of the FAA) that is a capital market product, to an
expert investor;
(2) Regulation 34(1) – Exemption from complying with section 27 of the FAA when making a recommendation in respect of (a) any investment product to an accredited investor; (b) any capital
markets product to an expert investor or (c) any Government securities;
(3) Regulations 36(1) and (2) – Exemption from complying with sections 25, 26, 27, 28, 29, 32, 34 and 36 of the FAA when providing any financial advisory service to any person outside of Singapore
who is (a) an individual and (i) not a citizen of Singapore; (ii) not a permanent resident of Singapore; and (iii) not wholly or partly dependant on a citizen or permanent resident of Singapore; or (b)
in any other case , a person with no commercial or physical presence in Singapore.
23You can also read