June 2021 Investor Presentation - Rexford Industrial Realty, Inc - NYSE: REXR
←
→
Page content transcription
If your browser does not render page correctly, please read the page content below

June 2021
Investor Presentation – Rexford Industrial Realty, Inc.
NYSE: REXR
Forward Looking Statements

This presentation contains “forward-looking statements” within the meaning of the Private Securities Litigation Reform Act of 1995. We caution investors that
any forward-looking statements presented herein are based on management’s beliefs and assumptions and information currently available to management.
Such statements are subject to risks, uncertainties and assumptions and may be affected by known and unknown risks, trends, uncertainties and factors that
are beyond our control. Should one or more of these risks or uncertainties materialize, or should underlying assumptions prove incorrect, actual results may
vary materially from those anticipated, estimated or projected. These risks and uncertainties include, without limitation: general risks affecting the real estate
industry (including, without limitation, the market value of our properties, the inability to enter into or renew leases at favorable rates, portfolio occupancy
varying from our expectations, dependence on tenants’ financial condition, and competition from other developers, owners and operators of real estate);
risks associated with the disruption of credit markets or a global economic slowdown; risks associated with the potential loss of key personnel (most
importantly, members of senior management); risks associated with our failure to maintain our status as a REIT under the Internal Revenue Code of 1986, as
amended; possible adverse changes in tax and environmental laws; and potential liability for uninsured losses and environmental contamination. In some
cases, you can identify forward-looking statements by the use of forward-looking terminology such as “may,” “will,” “should,” “expects,” “intends,” “plans,”
“anticipates,” “believes,” “estimates,” “predicts,” or “potential” or the negative of these words and phrases or similar words or phrases which are predictions
of or indicate future events or trends and which do not relate solely to historical matters. The risks described above are not exhaustive, and additional factors
could adversely affect our business and financial performance, including those discussed in our annual report on Form 10-K, for the year ended December 31,
2020, and subsequent filings with the Securities and Exchange Commission. We expressly disclaim any responsibility to update forward-looking statements,
whether as a result of new information, future events or otherwise.

                                                                                                                                                                2
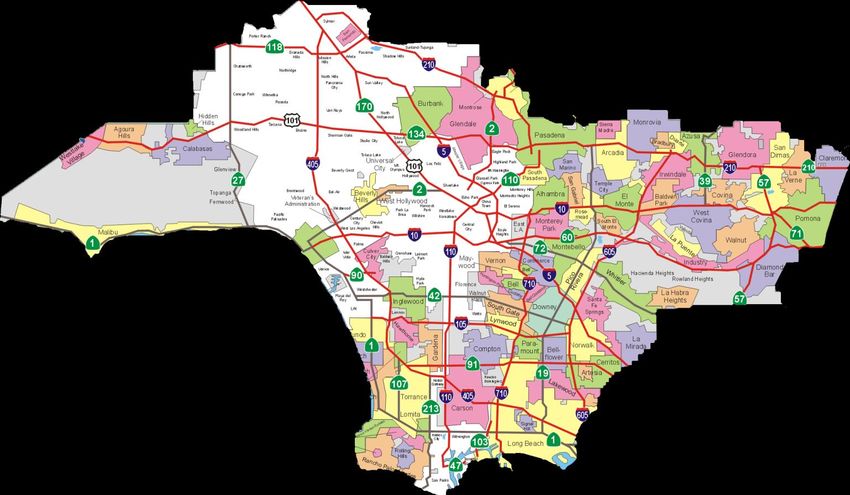
Rexford Overview

                                       2001                                                    100%                                                   REXR
                                        Founded                                   Infill Southern California                                              NYSE

                               S&P 400                                                         $9B+                                                32M SF
                                      Member                                               Entity Value(1)                                               Owned

                                  FOCUSED ON VALUE CREATION                                                            WELL-POSITIONED FOR GROWTH

                                    30%                                      11%                                          4.0x                                  ~$1.2bn
                                Annual NOI                        Core FFO Per Share Net debt / Adj. EBITDA                                                         Liquidity(2)
                                  CAGR                                  CAGR                (as of 3/31)                                                                  (as of 3/31)
                                    (2015-2020)                              (2015-2020)

                                                                                  2021 YTD PERFORMANCE

                                                        98.6%                                      6.8%                                     8.2%
                                                     SP Occupancy                             SP NOI Growth                           SP NOI Growth
                                                                                                  (GAAP)                                  (Cash)

(1)   Based on $56.28 share price on June 4, 2021, and 140,299,354 shares total shares outstanding at March 31, 2021                                                                     3
(2)   Consists of $124 million in cash, $500 million available under the unsecured revolving credit facility and $590 million of equity available under a forward basis                      3
Accretive Internal & External Growth Drives
Superior Shareholder Returns
      10% Core FFO Per Share Growth vs 8% Peer Avg (1) (2016-2020)                                                           Consistent Dividend Growth

                                                           Total Shareholder Return Outperformance Since IPO (2)

                                                                                                                                                            379% Total Return
                                                                                                                                                                 REXR

                                                                                                                                                            248% Total Return
                                                                                                                                                           Industrial Peer Index

                                                                                                                                                             84% Total Return
                                                                                                                                                              MSCI REIT Index

(1)   Peer group includes PLD, DRE, EGP, FR, STAG and TRNO. Core FFO per share attributable to common shareholders was used for REXR, DRE, STAG and PLD. NAREIT definition of FFO per
      share was used for EGP, FR, and TRNO.                                                                                                                                             4
(2)   Source: S&P daily share prices for the period 7/19/13 to 5/28/21 for peer group referenced in Footnote 1 and MSCI REIT index, an index of all publicly-traded REITs.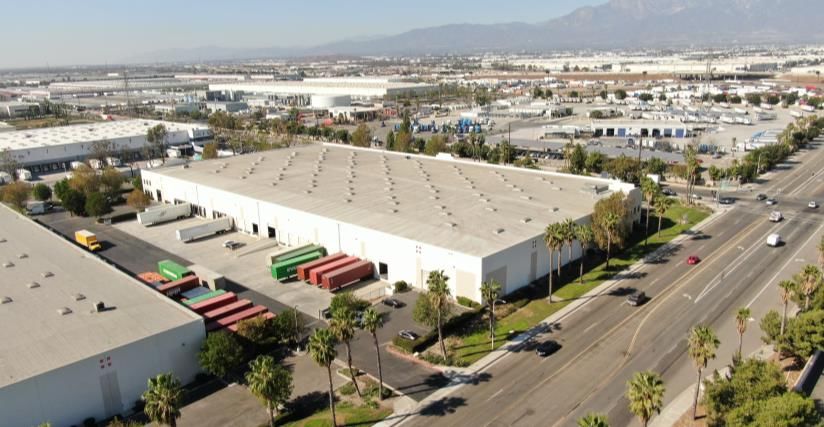
The Rexford Investment Opportunity –
A Superior, Highly-Differentiated Strategy

    Singular focus on strongest, highest-demand industrial market
                    with significant barriers to entry

                 High-quality, irreplaceable portfolio
               100% located in infill Southern California

     Consistent, favorable cash-flow growth driven by diversified
     tenant base, superior asset management and propriety value
                         creation capabilities

    Disciplined, low-leverage balance sheet management designed
                    for all phases of the capital cycle

                Deep ESG purpose builds lasting value

                                                                    5
The Rexford Opportunity:
Singular Focus, Strongest Market

   SoCal Infill Logistics Market Leads in Size & Value
                                              Nation’s largest base of regional consumption, manufacturing, distribution

    ■ Largest U.S. Market: Southern California is the largest U.S. industrial market and fourth largest in the world
    ■ Highest Rental Rates: More than 80% higher in SoCal than the average of the next five largest markets
    ■ Diverse Economy: Consumption driven by approximately 23 million residents and over 570,000 businesses(1)
    ■ SoCal Ports Vital to the U.S.: SoCal ports are largest in U.S., linking the U.S. to Pacific Rim representing 40% of all U.S.
          containerized imports, with 40%-50% of imports distributed locally(2)

    ■ Regional Consumption Focus: Infill tenant base tends to serve regional consumption; less impacted by shifts in global trade

                                                                        Size and Value of Top US Industrial Markets

                                                                                                        $7.54

                                                                                                        $5.17
                                                                                                                                                  Value of SoCal
                                                                                                       $4.52                                   industrial market is
                                                                                                                                               as large as the next
                                                                                                        $5.92                                    five largest U.S.
                                                                                                                                                markets combined
                                                                                                        $5.20
                                                                                                                                                 driven by higher
                                                                                                                                                 ABR and relative
                                                                                                       $3.97
                                                                                                                                                     cap rates

   (1)   Source: U.S. Census Bureau for Los Angeles, Orange, San Diego, Riverside, San Bernardino and Ventura counties
   (2)   Source: JLL.
   (3)   Source: DAUM Real Estate Services as of 1Q21 citing CoStar Property Database. Southern California data includes Inland Empire East.
   (4)   Source: CBRE. Southern California data includes Inland Empire East.                                                                                      6
The Rexford Opportunity:
Singular Focus, Strongest Market

     Nation’s Strongest Market Dynamics Drive Superior
     Market Rent Growth
    ■ Limited Supply: Inability to increase supply due to natural/physical barriers, scarce developable land, high development
         costs and entitlement restrictions

    ■ Diminishing supply of for-lease infill industrial property: Over 100M SF removed from infill market or converted to other
         uses since 2001(1)

    ■ Highest-demand industrial market: Driven by diversity and size of regional economy, largest regional population, and
         position as nation’s most substantial first- and last-mile of distribution

    ■ Projected rent growth: Southern California leads other major U.S. industrials markets by more than double the projected
         national growth rate

                                                   Projected Annual Rent Growth 2020 – 2025 (CAGR)(2)

                                                                                                         Projected Rent Growth
                                                                                                               2020-2025

                                                                                                            LA County 41%
                                                                                                          Orange County 33%

                                                                                                        Other Major Markets 18%
                                                                                                               (Excludes
                                                                                                          Southern California)

  (1)   Source: CoStar/DAUM Real Estate Services                                                                                  7
  (2)   Source: CBRE
The Rexford Opportunity:
Singular Focus, Strongest Market

      Ideally Positioned as E-Commerce First Mile and Last Mile
                100% of Rexford portfolio is located within E-Commerce “last mile” logistics markets in infill Southern California

      ■ U.S. Retail E-Commerce sales accelerating: Increased 32% in 2020 to $792 billion vs. 2019(1) – 39% year-over-year growth in
         1Q 2021(1), with continued growth projected through post-pandemic periods

      ■ Last Mile Focus: Tenants accepting of higher rents for distribution locations closer to the end consumer, minimizing both
         delivery time and inventory levels, which lowers inventory carrying costs

      ■ Demand increasing: Demand for local warehouses increasing as COVID drives shift in supply chains and inventory
         management

                     U.S. Retail E-Commerce Sales Growth ($bn)(2)              % of REXR’s New Leases with E-Commerce Related Tenants

                                                        $1,205

                              $524

                                2018                    2024E

(1)   Source: U.S. Census Bureau, not adjusted basis.                                                                                   8
(2)   Source: eMarketer, October 12, 2020.
The Rexford Opportunity:
Irreplaceable Portfolio, 100% Infill SoCal

        Incurable Supply-Demand Imbalance, Extensive Barriers to Entry
                         Nation’s lowest supply and highest demand combine to drive favorable, long-term internal growth

X
`

          ◼ Incurable supply-demand imbalance:
              Lack of developable land, permanent
              natural barriers (mountains and
              oceans) and restrictive zoning constrain
              supply

          ◼ Obsolescence: Long-term negative
              supply growth as industrial converts to
              other uses

    Source: All market data per CBRE as of 1Q21. Downtown LA and Commerce/Vernon submarkets are combined as Central LA from CBRE.
    (1) Rexford property information as of 3/31/21.                                                                                 9
    (2) REXR % of Market as of 3/31/21 for Rexford portfolio and as of 1Q 2021 for market size.
The Rexford Opportunity:
Irreplaceable Portfolio, 100% Infill SoCal

       Higher Rents Demonstrate Superior Market Fundamentals & Quality
                                        100% of Rexford properties located within infill Southern California;
                    Rexford’s ABR per SF exceeds peers by more than 60% reflecting strength of infill Southern California market

                                                                            REXR ABR
                                                                             Per SF:
                                    $12.75                                   $10.45                   Peer Average
                                                                                                      ABR Per SF: (1)
                                                                                                         $6.20
                                                                 $10.57                      $10.30                       $10.16

                                                                                                                                                       $9.01

                                  San Diego                   Los Angeles                    Orange                      Ventura                 San Bernardino

      (1)   As of 1Q 2021. Peer group includes DRE, EGP, FR, PLD, TRNO and STAG. ABR is defined as annualized base rent per occupied square foot. REXR, EGP, FR, STAG and TRNO are
            presented on an in-place ABR basis. DRE and PLD are presented on a net effective ABR basis.
                                                                                                                                                                                     10
The Rexford Opportunity:
Favorable Cash Flow Growth
Value-Add Asset Management Drives Outperformance
Market-Leading Leasing Spreads Demonstrate Superior, Stable Tenant Base with Ability to Renew and Rapidly
Entrepreneurial Rexford Platform and Execution Re-Tenant High-Demand Space at Higher Rents
Combined New/Renewal Leasing Spreads Retention Rate
Substantial Go-Forward Opportunity to Drive In-Place Rental Revenue Growth
2021 Lease Expirations Expirations as a % of In-Place Annual Base Rent
$11.85
$9.85
11The Rexford Opportunity:
Favorable Cash Flow Growth
Stable & Diversified Tenant Base
Our spaces are mission-critical, essential to our tenants’ diverse businesses
Generic Use, High-Demand Industrial Space(1) Highly Diversified Rexford Tenant Base(1)
(2)
~1400 Tenants Comprise $321mm ABR(1) Strong Tenants of All Sizes (SF)
83% 11% 49% 19% 17%
6%
8% 7%
(1) Based on percentage of total annualized base rent as of 3/31/21.
(2) “Other” represents Light Manufacturing / Flex and Cold Storage / Distribution..
12The Rexford Opportunity:
Favorable Cash Flow Growth
Nominal COVID Impact on Operations and Growth
Rexford’s portfolio performed exceptionally well throughout the health crisis and is positioned to thrive post-COVID
■ Negligible COVID impact: Despite multiple governmental actions including stay-at-home orders, business shut-downs
and restrictions, and local orders allowing tenants to unilaterally defer rent, Rexford’s portfolio is performing at or above
strong, pre-pandemic levels
➢ Q1 2021 Collections essentially at pre-COVID levels
• Q1 2021 cash collections of 98.7%
• Collected over 96% of deferred rent billings with $0.5M remaining in 2021
➢ Current same property portfolio occupancy of 98.6% (as of 3/31/21) is above pre-pandemic levels
Cash Collections
99.1% 98.7% 98.8%
97.3% 98.6% 97.8% 98.0%
88.0%
(1)
Q220 Q320 Q420 Q121
% Cash Collections % Collections with Deferments, Accelerations and Applied Deposits
13
(1) As of June 1, 2021.The Rexford Opportunity:
Favorable Cash Flow Growth
Rexford’s Value-Add Execution is a Key Differentiator
Substantial off-market sourcing advantage enables above-market return on equity & cash flow growth
■ Proprietary Sourcing Advantage: Singular infill Southern California focus and proprietary market access drive significant
competitive advantage
■ Market Consolidation: Extremely fragmented market provides extensive consolidation opportunity to increase Rexford’s
1.8% market share through external growth
Current and Future Repositioning and Redevelopment
Over 70% of Acquisitions Have Been Off/Lightly-Marketed
Projecting an Aggregate 5.7% Unlevered Cash Yield
Transactions Since IPO
on Total Investment
2021 Acquisitions & Pipeline ($mm)(1) Repositioning/Redevelopment ($mm)(2)
•
•
.
(1) As of June 7, 2021.
(2) For a complete list of repositioning and redevelopment properties, please see p.27-29 of our 1Q21 supplemental package.
14The Rexford Opportunity:
Favorable Cash Flow Growth
Proprietary Acquisition Sourcing
In-depth research and extensive local broker network drive significant off/lightly marketed transaction volume
Deep Relationships, Marketing &
Proven Research & Analytics
Premier Rexford Brand
■ Extensive broker, owner, lender analytics ■ Relationships developed over 30+ years
■ Event-driven research & catalysts ■ Extensive broker marketing & loyalty
■ Owner capital structure analysis ■ Superior alignment with key market
■ Extensive property & transaction analyses participants
Proprietary Market Access Enables Rexford as the Most Active Industrial Property Acquirer Within Infill Southern California
Cumulative Portfolio Acquisitions (Millions SF)(1)
31.8 32.8
26.8
21.5
18.7
15.2
12.1
10.0
5.5 6.5
IPO 2013 2014 2015 2016 2017 2018 2019 2020 2021 YTD
(1) As of 6/7/2021. 15The Rexford Opportunity:
Favorable Cash Flow Growth
Positioned for Superior Internal NOI Growth
Approx. $54 million NOI growth potential embedded within existing in-place portfolio
Projected Embedded Internal NOI Growth ($mm)
(Excludes Future Acquisitions)
~
■ Projected NOI growth of approximately
18% over 18-24 months from in-place
portfolio
■ Demonstrates Rexford’s value-add,
accretive approach driving FFO per ~
share growth
■ Additional NOI growth upside potential
from go-forward acquisitions
■ Over 95% of leases include 3% or
greater annualized rent increases
(1) (2)
Source: Company filings unless otherwise noted.
(1) Based on the annualized sum of 1Q21 GAAP NOI of $76.1mm minus NOI from dispositions.
(2) Includes projected NOI impact of (a) Stabilization of properties and spaces undergoing repositioning and redevelopment as of 3/31/21 (Repositioning/Redevelopment incremental CapEx = $217 million); (b) YTD acquisitions as of
5/28/21 not already included in 1Q21 GAAP NOI; and (c) Re-leasing of 2021-2022 expiring square footage, not including repositioning properties, at projected 20% re-leasing spreads (note: GAAP leasing spreads averaged 34.0%
over prior four quarters), assumes consolidated portfolio excluding repositioning properties occupancy remains constant at 3/31/21 levels of 98.3%.
16The Rexford Opportunity:
Disciplined Balance Sheet
Strong, Low Leverage Balance Sheet Positioned for Growth
Investment Grade Balance Sheet with Ample Liquidity $9B+ Total Capitalization (3)
■ $1.2 billion of liquidity(1) Common Equity
Unsecured Debt
■ No near-term debt maturities until 2023 12%
Preferred Equity
Mortgage Debt
Mortgage Debt
■ Investment grade ratings of BBB/Baa3/BBB (S&P/Moody’s/Fitch) 1%
Unsecured Debt
Preferred Equity
■ Low leverage ratios 4%
➢ Net Debt / LQA Adjusted EBITDA: 4.0x(2) Common Equity
83%
➢ Net Debt / Total Enterprise Value: 13.0%
➢ Fixed Charge Coverage Ratio: 3.8x
Well-Staggered Debt Maturities ($mm)
$500
$40.4
95% of debt is fixed
$400 or swapped with a
weighted average
$300 interest rate of
3.1%
$200 and weighted
average maturity
of 6.4 years
$100
$0
2021 2022 2023 2024 2025 2026 2027 2028 2029 2030+
Mortgage Debt Secured Term Loan Unsecured Term Loan Unsecured Notes
Note: Unless stated otherwise, all information as of 3/31/21.
(1) Consists of $124 million in cash, $500 million available under the unsecured revolving credit facility and $590 million of equity available under a forward basis
(2) Last qtr annualized (LQA) Adj EBITDA for 1Q21 adjusts for non-cash stock comp, gains, non-recurring and acquisition exp., and pro forma for the annualized impact of
1Q21 acquisitions and dispositions. 17
(3) Common equity based on $56.28 closing price on 6/4/21, includes operating partnership units. Preferred equity reflects 100% of par value of preferred shares.The Rexford Opportunity:
ESG Purpose Builds Lasting Value
Environmental, Social and Governance (ESG)
Our interconnected strategic priorities integrate ESG factors into every decision we make
Our Mission is to reinvent the business of industrial real estate by optimizing positive impacts to the
environment and our communities, tenants, employees and shareholders. At Rexford, our purpose
encompasses creating economic, environmental and social value.
18The Rexford Opportunity:
ESG Purpose Builds Lasting Value
Environmental and Social Benefits
Rexford’s Differentiated Business Strategy Ensures Positive Impacts on the Environment and our Communities
Our Environmental Benefits Our Social Benefits
• Repositioning strategy reduces embodied carbon • Differentiated business model breathes new life
preventing need for new materials and reducing into communities – transforms dysfunctional and
waste unsafe locations into highly functional properties
Environmental
• Green building with efficient heating and cooling and Social • Strategy generates high quality jobs, skills training
units, LED lighting and cool roofs and water contribution from our and higher wages
management measures including stormwater business strategy yield an
management and drought tolerant landscaping NPV of
• Significant additional tax revenues for
municipalities
• On-site solar renewable energy program ~$2.1 billion
• Health and productivity benefits for employees’
• 2020 Green Lease Leader And will grow over time as working at our properties from improved
we continue to execute on daylighting and indoor air quality
• Environmental impact management mitigating our value-add strategy
negative impacts from the past • Rexford invests in our communities with our
dollars and time through community partners
• Infill focus uniquely positions us to support tenants whose work directly affects our SoCal communities
in minimizing greenhouse gas emissions
Recent Case Study: Total Net Present Environmental and Community Value Created
Values are calculated over a 25-year period and compare the benefits of our
improvements to a “base case” to derive NPV. The NPV has been calculated for specific
project attributes.
19The Rexford Opportunity:
ESG Purpose Builds Lasting Value
Our People and Principles
The development and diversity of our people are the greatest determinants of our future success. We strive to amplify
their passion, excellence and innovation to cultivate their success, personally and professionally.
Diversity and Inclusion
• A deep commitment to diversity and inclusion
• Formal Diversity and Inclusion Policy
• Commitment to diversity through internal
advancement and best-in-class recruiting
practices
Employee Engagement
• Dedicated Learning & Development team
creating and expanding world-class internal
L&D platform
• Leading Tuition Reimbursement Program
• Childcare and Tutoring Assistance for families
during pandemic
• 100% of employees receive annual
performance review
Governance
• Pursue highest ethical standards – integrity,
accountability and transparency in all we do
• Non-classified board subject to annual re-
election
• Opted out of Maryland business combination
and control share provisions
20The Rexford Opportunity:
ESG Purpose Builds Lasting Value
Our ESG Path Forward
We have set goals to address material ESG opportunities and to amplify the results of our ESG priorities
Environmental
• Energy Reduction
• Solar Installation
• LEED Certification Social
• Climate Change Scenario Planning • Community and Tenant
(TCFD) Engagement Program
• Energy Benchmarking • Learning and Development
Content Development & Training
• Path to Net-Zero Emissions
• ESG Training for Employees
• Work/Life Balance Initiatives
Governance • Mentor Program
• Climate Change Board Oversight • Board Gender Diversity
• Company-wide and business • Pay Equity Analysis
continuity process
• Business Ethics Training
21Vertically Integrated Platform, Experienced Management
Entrepreneurial and proven team with average of 25+ years of experience
Proprietary Research
Management &
Originations
Accounting Acquisitions
& Finance &
Due Diligence
Construction
& Financing
Redevelopment &
Capital Markets
Leasing
& Asset &
Marketing Property
Management
22Appendix.
Recent Acquisitions
                             Recent Acquisition                                                  Recent Acquisition

                         17907-18001 Figueroa St                                            4225 Etiwanda Ave
                      Multi-tenant Industrial Site on 5 Acres                         One Industrial Building on 7 Acres
                             Los Angeles - South Bay                                        Inland Empire West

  Acquisition Price           Acquisition Date             Size         Acquisition Price       Acquisition Date              Size
    $20.2 million              January 2021              74,810 SF       $32.3 million            March 2021               134,500 SF

 ■ Off-market, value-add transaction on a 5 acre, fully leased, low     ■ Highly supply-constrained submarket with 1.2% vacancy
   coverage site
 ■ Opportunity for repositioning or redevelopment as in-place leases    ■ Opportunity to drive cash flow growth with in-place rents estimated
   expire in this supply constrained submarket                              to be 21% below-market

 ■ In addition to immediate access to the I-405, I-110 and CA-91        ■ Class A property demised into three units, ideally positioned to serve
   freeway, the truck/container storage is allowed by right, which          intense last-mile, e-commerce-oriented tenant demand
   many surrounding municipalities no longer allow
                                                                        ■ Premium functionality features 30’ clear heights, ESFR sprinklers,
 ■ 100% leased to eleven tenants, with rents estimated to be approx.        extensive dock-high loading and large 145’ truck court
   34% below-market at acquisition
                                                                        ■ Projected initial stabilized unlevered yield of approximately 4.7%
 ■ Projected initial stabilized unlevered yield of approximately 5.5%

                                                                                                                                               24
Recent Repositioning in 2H 2020
Recently Completed Repositioning Recently Completed Repositioning
16121 Carmenita 29003 Avenue Sherman
Two Tenant Industrial Property Single Tenant Industrial Property
Los Angeles Mid-Counties San Fernando Valley
Acquisition Date Stabilization Date Size Acquisition Date Stabilization Date Size
August 2018 Q3 2020 109,780 SF July 2018 Q4 2020 68,123 SF
■ Value-add repositioning and 2-tenant conversion of 105K SF in
■ Value-add repositioning of 68K SF building in submarket with
submarket with 0.7% vacancy 2.4% vacancy
■ Purchased with short-term in place tenant with below-market rent
■ Purchased vacant modern industrial building from repeat private
which generated cash flow during permitting seller
■ Comprehensive repositioning and modernization, fire protection
■ Comprehensive office reconfiguration and exterior renovation
upgrade, façade enhancements, new and renovated office buildout,
addition of dock-high loading positions ■ Signed long-term lease to furniture rental E-Commerce company
■ Signed long-term lease to surgical appliance manufacturing
■ Achieved stabilized unlevered yield of 5.1%
company and to an electrical equipment company
■ Achieved stabilized unlevered yield of 5.9%
25Non-GAAP Reconciliations
Net Operating Income Funds From Operations
Qtr ended Qtr ended Jul 24, 2013 to Qtr ended Qtr ended Jul 24, 2013 to
($ in '000s) (1) ($ in '000s) (1)
Mar 31, 2021 Mar 31, 2020 Sept. 30, 2013 Mar 31, 2021 Mar 31, 2020 Sept. 30, 2013
Net Income (Loss) $ 30,643 $ 15,272 $ (5,573) Net Income (Loss) $ 30,643 $ 15,272 $ 295
Add: Add:
General and administrative 11,480 9,317 4,385 D&A, including amounts in discontinued operations 35,144 27,523 3,062
D&A 35,144 27,523 3,913 D&A from unconsolidated joint ventures -- -- 96
Acquisition expenses 29 5 126 Loss on sale of real estate -- -- --
Interest expense 9,752 7,449 1,950 Subtract:
Loss on sale of real estate -- -- -- Gain on sale of real estate 10,860 -- --
Subtract: Funds from Operations $ 54,927 $ 42,795 $ 3,453
Management, leasing, and development services 105 93 294 Less: preferred stock dividends (3,636) (3,636) 3,062
Interest income 14 97 254 Less: FFO, noncontrolling interests (3,134) (1,450) 96
Less: FFO, participating securities (209) (195) --
Equity in (loss) income from unconsolidated RE entities -- -- 92
Company Share of FFO $ 47,948 $ 37,514 $ 3,001
Gain/(Loss) on extinguishment of debt -- -- (3,919)
Non Recurring Legal Fees -- -- 235
Gain on sale of real estate 10,860 -- --
Amortization of Loss on Termination of Interest Rate Swap 410 -- --
Income from discontinued operations -- -- 130
Acquisition Expenses 29 5 119
Net Operating Income (NOI) $ 76,069 $ 59,376 $ 7,950
Company Share of Core FFO $ 48,364 $ 37,519 $ 3,373
Fair value lease revenue (2,712) (2,402) 166
Weighted-average shares outstanding - diluted 131,759 114,314 24,574
Straight line rent adjustment (4,199) (1,672) (127) FFO per share - diluted $ 0.36 $ 0.33 $ 0.12
Cash NOI $ 69,158 $ 55,302 $ 7,989 Core FFO per share - diluted $ 0.37 $ 0.33 $ 0.14
Pro forma effect of acquisitions 5,260 1,747 23
FFO per share quarterized (2) $ 0.16
Pro forma effect of dispositions 4 -- (157)
Core FFO per share quarterized (2) $ 0.18
Pro forma effect of uncommenced leases 1,208 1,455 --
Pro forma effect of properties/space under repositioning 5,456 3,468 --
Annualized Impact
Pro Forma Cash NOI $ 81,086 $ 61,972 $ 7,855
Net Operating Income $ 304,276 $ 237,504 $ 31,800
Net effect of pro forma adjustments $ 47,712 $ 26,680 $ (536)
Recurring FFO per share - basic and diluted $ 1.48 $ 1.32 $ 0.55
Source: Company filings.
(1) Represents the results of operations for our predecessor for the period from 7/01/13-7/23/13 and Rexford Industrial Realty Inc. for the period from 7/24/13-9/30/13.
(2) Figure is quarterized from the reported number after the IPO until the end of the quarter to represent the full 3Q13.
26You can also read