Studies in Applied Finance - INVESTMENT THESIS FOR ADVANCED METALLURGICAL GROUP (AEX: AMG)
←
→
Page content transcription
If your browser does not render page correctly, please read the page content below
SAF/No.20/July 2017

              Studies in Applied Finance

            INVESTMENT THESIS FOR
           ADVANCED METALLURGICAL
               GROUP (AEX: AMG)

                                    Anshul Subramanya

  Johns Hopkins Institute for Applied Economics,
Global Health, and the Study of Business Enterprise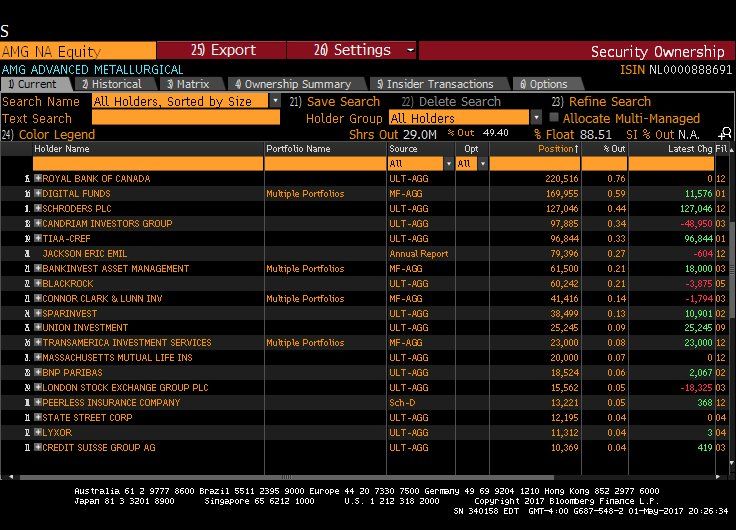
Investment Thesis: Advanced Metallurgical Group (AEX: AMG)
By: Anshul Subramanya
Last Updated: 06/16/17

                           Advanced Metallurgical Group

         Rating: Buy – Average Free Cash Flow per Share: $33.50

                         Company Name                 Advanced Metallurgical Group
                                    Date                        06/16/17
        Fiscal year ends (Current Period)                   12/31/2017 (Q2)
                            Current Price              26.42 Euros ($29.58 USD)
                        52 wk high (date)                27.90 Euros (06/09/17)
                        52 wk low (Date)                 11.33 Euros (06/27/16)
                             Market Cap                      788.67M Euros
                               Total Debt                       $173.8M
                                    Cash                        $166.5M
                    Net Debt / Enterprise                        4.38%
                                Dividend                         1.01%
               Shares outstanding / Float                       29.04M
                             Current P/E                          18.03
          Bloomberg EPS Estimate (2018)                           $2.08
          Bloomberg EPS Estimate (2017)                           $1.60
                         2018 P/E (EPS)                      12.82x ($2.21)
                         2017 P/E (EPS)                      16.57x ($1.71)
                               2016 EPS                           $1.45
                               2015 EPS                           $0.40
                               2014 EPS                           $0.79
                               2013 EPS                          -$1.51

 EPS Estimates are consensus values from Bloomberg at the time of this writing

                                                                                     1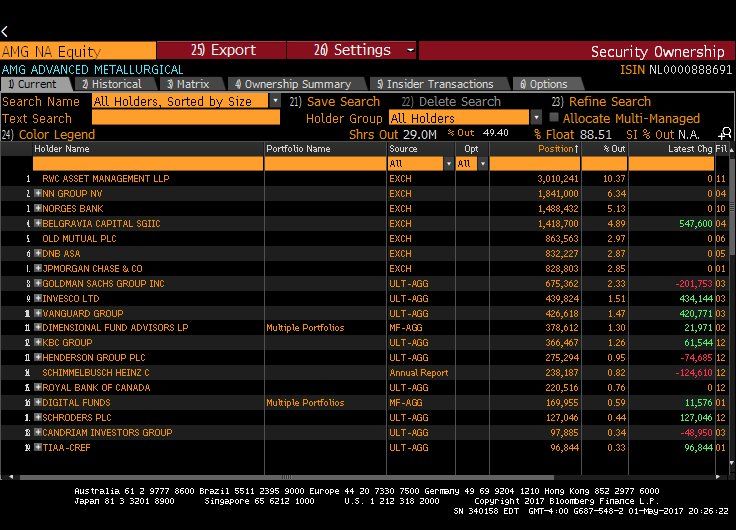
Investment Thesis: Advanced Metallurgical Group (AEX: AMG)
By: Anshul Subramanya
Last Updated: 06/16/17
Table of Contents
Executive Summary ........................................................................................................................... 3
Catalysts and Risks ........................................................................................................................... 4
Company Overview ............................................................................................................................ 5
Historical Performance ................................................................................................................... 10
AMG Model .......................................................................................................................................... 12
Monte Carlo Results ........................................................................................................................ 17
Capital Allocation.............................................................................................................................. 18
Management Compensation ........................................................................................................ 19
Conclusion........................................................................................................................................... 21
Appendix .............................................................................................................................................. 21

                                                                                                                                                       2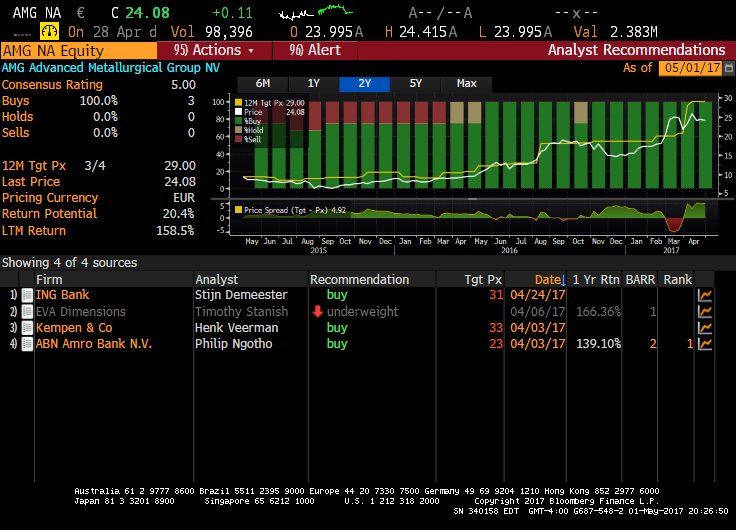
Investment Thesis: Advanced Metallurgical Group (AEX: AMG)
By: Anshul Subramanya
Last Updated: 06/16/17
Executive Summary

       Advanced Metallurgical Group (Euronext: AMG) is a global critical materials
company headquartered in the Netherlands. AMG produces specialty metals, alloys,
and high performance materials such as ferrovanadium antimony, tantalum, and
niobium. They also engineer advanced vacuum furnace systems and operate vacuum
heat treatment facilities for the transportation and energy industries. The market
currently prices AMG at 26.42 Euros ($29.58 USD, market close 06/16/17, 0.89 Euros /
Dollar Exchange Rate, Figure 1) per share. By using a Probabilistic Discounted Cash
Flow Model (P-DCF), we estimate a free cash flow (FCF) per share of approximately
$33.50, or 29.82 Euros. This estimate is based on expectations of AMG’s current
product portfolio as well as their ongoing spodumene project, and suggests that the
stock is currently trading at a 13.25% discount. AMG has also provided an EBITDA
target of $200M+ by 2021,1 and reaching this target yields the estimated FCF per share
mentioned above. Our analysis shows that AMG has the opportunities, leverage, and
appropriate compensation metrics attain this target, so we rate AMG a buy.

    Figure 1: Price Chart of AMG – AMG’s share price rose dramatically in 2016, yielding
                          a current price of 26.42 Euros per share
                   Source: Bloomberg Terminal Command ; Accessed 05/05/2017

1
    Advanced Metallurgical Group (March, 2017). AGM CEO Strategy Update

                                                                                       3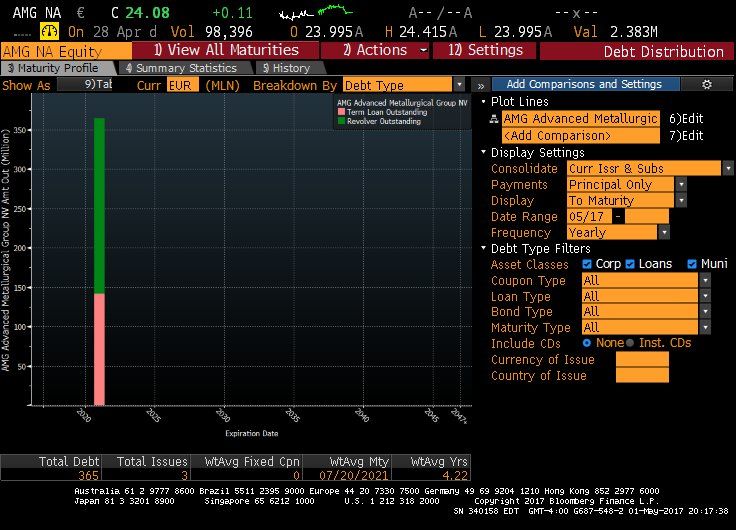
Investment Thesis: Advanced Metallurgical Group (AEX: AMG)
By: Anshul Subramanya
Last Updated: 06/16/17
Catalysts and Risks
Catalysts
   • Complete Deleveraging – During AMG’s austerity period (described below), the
      company made steps to decrease its net debt and increase cash flows.2 These
      measures successfully positioned the company for high cash flow growth moving
      forwards. Subsequently, AMG is poised to take on debt in order to finance its
      upcoming growth projects.
   • Spodumene Mine – In July 2016, AMG supervisory board approved the
      construction of a lithium concentrate (spodumene) plant at the Mibra mine in
      Brazil. With the increase of mobile and portable devices, lithium’s importance is
      growing rapidly. This plant aims to establish AMG as a cost leader in the lithium
      market. Though this mine stands to produce substantial top- and bottom-line
      growth for AMG, delays in operation or less-than-expected revenues pose a risk
      to the company’s investment.

Risks
   • Metal price volatility – The prices of metals that support AMG’s business
      declined during early to mid-2016 but have recovered (Figure 2). Price declines
      between Q4 2015 and Q4 2016 were led by chrome, graphite, and silicon.
      However, unit prices of ferrovanadium, molybdenum, and nickel increased
      between Q4 2015 and Q4 2016 instead. Since AMG’s products are primarily
      refined metals or metal products, a decrease in the price of specialty metals
      poses a risk to the business.
   • Mining Risks – Risks inherent to the mining industry include safety and
      regulatory concerns, geopolitical and environmental events, and unforeseen
      accidents.
   • Currency Risks – AMG’s global presence introduces foreign exchange (ForEx)
      risk. AMG’s functional currency is the U.S Dollar, and the appreciation of the US
      dollar compared to the Euro and other currencies caused ForEx loss of
      approximately $500K in 2014.

2
    Advanced Metallurgical Group (2016). AMG Annual Report.

                                                                                          4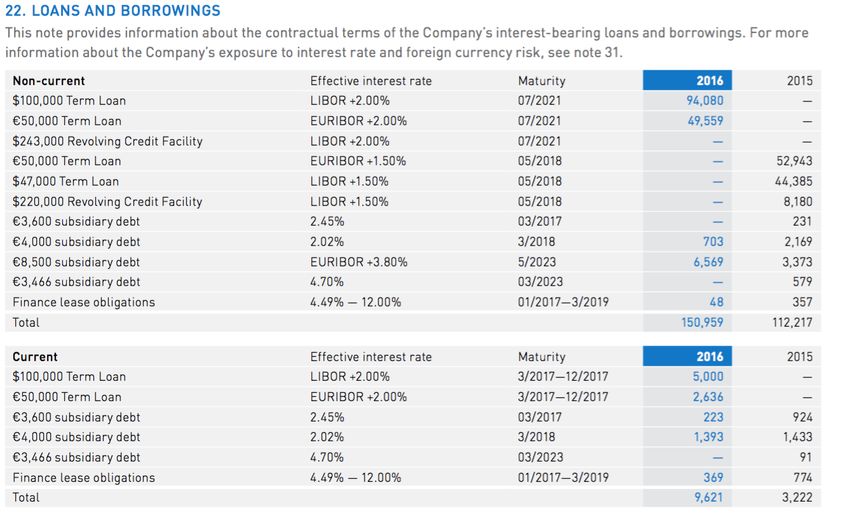
Investment Thesis: Advanced Metallurgical Group (AEX: AMG)
By: Anshul Subramanya
Last Updated: 06/16/17

     Figure 2: Volatile Metal Prices – Metal prices dropped in early 2016, but have since
    risen. Price declines between Q4 2015 and Q4 2016 were led by chrome, graphite, and
                                           silicon.
                                              AMG Investor Presentation 2016

Company Overview
AMG has two overarching business units, AMG Critical Materials and AMG Engineering.
Within the Critical Materials unit are multiple segments focusing on a particular metal or
metal product, while the Engineering unit has a single segment targeting vacuum
furnace systems. An in-depth description of each business unit can be found below,
followed by a bulleted description of the business segment hierarchy,

AMG Critical Materials
        AMG’s Critical Materials unit produces a variety of specialty metals, alloys, and
high performance materials. Their most notable products are: lithium, ferrovanadium,
aluminum alloys, chromium metal, tantalum, titanium alloys/coatings, antimony,
graphite, and silicon metal. These materials need to be lighter, stronger, and more
resistant to corrosion and wear in order to meet the needs of a growing global
population. They are also in particularly short supply, as detailed in the 2014 Report on
Critical Materials for the EU.3 AMG views themselves at the forefront of global CO2
reduction trends, and delivers these high quality materials to the transportation, energy,
infrastructure, specialty metals, and chemicals end markets.

AMG Engineering
      AMG Engineering designs, engineers, and produces advanced vacuum furnace
systems and operates vacuum heat treatment facilities. They primarily target the
3
    EU Raw Materials Initiative (2014). Report on Critical Raw Materials for the EU

                                                                                         5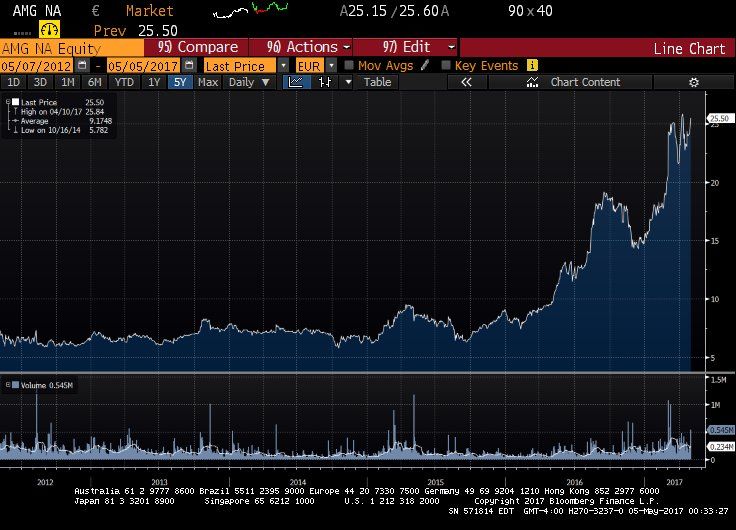
Investment Thesis: Advanced Metallurgical Group (AEX: AMG)
By: Anshul Subramanya
Last Updated: 06/16/17
transportation and energy industries and provide systems designed for vacuum melting,
solar silicon melting, and vacuum heat treatment.

   •   AMG Critical Materials
         o Ferrovanadium
         o Lithium
         o Aluminum Master Alloys and Powders
         o Chromium Metal
         o Tantalum and Niobium
         o Titanium Alloys and Coatings
         o Antimony
         o Graphite
         o Silicon Metal
   •   AMG Engineering
         o Vacuum furnaces

History
       AMG was incorporated in the Netherlands in November 2006 as a combination of
specialty metals businesses. The Critical Materials division had its origins in the
predecessor company Graphit Kropfmulh (GK), formed in 1870 to mine graphite in
Germany. GK was initially acquired by AMG in 2008 with 62% ownership, and AMG
acquired the remaining shares in 2010 and 2012.
       The Engineering division originated with the predecessor companies of ALD
Vacuum Technologies Gmbh (ALD), founded in Germany during the mid-1800s.

Austerity Period
         As of 2011, AMG began austerity measures in an effort to deleverage, cut costs,
and prioritize their balance sheet (Figure 3). This was in response to warning signs that
the global economy had not yet recovered from the 2008-2009 crisis, and a belief that
markets would continue to remain down for the upcoming years. The decisions made in
2011 were extremely successful in eliminating AMG’s net debt in 2015 and 2016, and
place AMG far ahead of their peers, particularly in terms of FCF yield (FCF / Enterprise
Value, Figure 4). Their primary debt facility is a $400M multicurrency term loan and
revolving credit facility (Figure 5), and a 5-year term through 2021 allows the company
to increase debt by up to $160M.
         Clearly, AMG has the option to obtain more debt in upcoming years, giving them
flexibility in how to finance growth opportunities. This aligns with our thesis that AMG
has the resources to attain their 2021 EBITDA goals.

                                                                                        6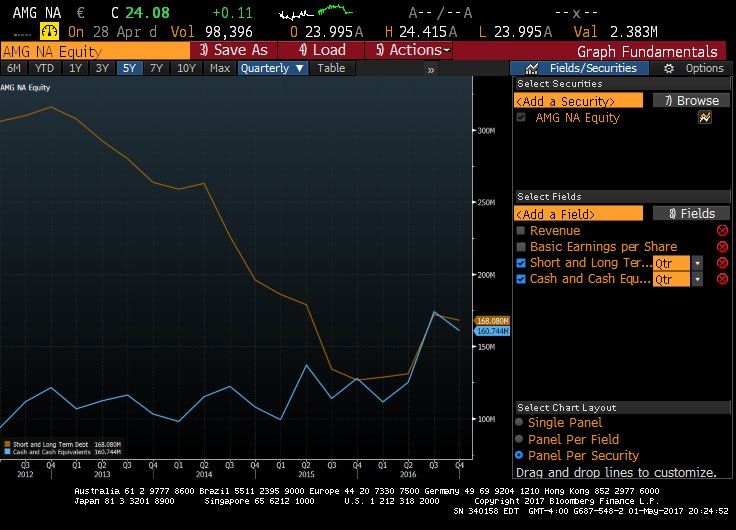
Investment Thesis: Advanced Metallurgical Group (AEX: AMG)
By: Anshul Subramanya
Last Updated: 06/16/17

 Figure 3: AMG Reduction in Net Debt since 2012 - Net Debt is calculated as Total
Debt minus Cash and Cash Equivalents. AMG has been able to completely deleverage
                          during their austerity period.
                                AMG Investor Presentation 2016

  Figure 4: Free Cash Flow Yield – AMG significantly outperformed its peers in this
                         metric over the last 12 months.
                                  AMG’s Annual Report, 2016

                                                                                      7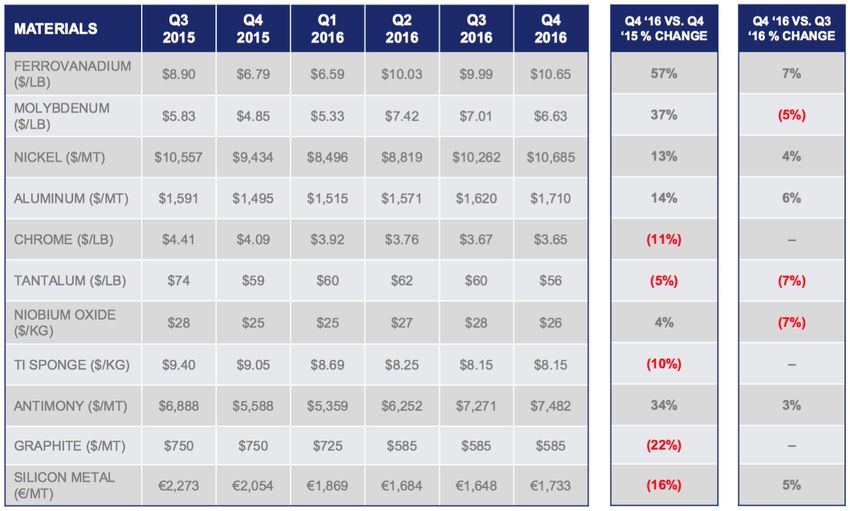
Investment Thesis: Advanced Metallurgical Group (AEX: AMG)
By: Anshul Subramanya
Last Updated: 06/16/17

Figure 5: AMG’s empty debt schedule – AMG’s primary debt facility is a $400M loan
   and RCF expiring in 2021. AMG has significant room to increase debt in order to
             decrease cost of capital and/or finance various projects.
                Bloomberg Terminal Command ; Accessed 05/05/2017

Spodumene Plant
       In July 2016, AMG approved the construction of two spodumene (lithium
concentrate) plants at their Mibra mine in Brazil. These plants aim to make AMG a cost
leader in the rapidly growing lithium market (Figure 6), thus producing significant value
for shareholders. Spodumene production will be associated with a new business
segment, AMG Lithium, and will commence in mid-2018. Each plant is expected to have
a capacity of 90,000 metric tons (MT) of spodumene annually, and the full production of
180k MT is expected to occur in mid-2019.

Figure 6: Growing market for lithium – Demand for lithium is expected to continue to
grow and exceed supply through 2018. AMG aims to capture this market by becoming
                          the low-cost source of lithium.
                                   AMG Lithium Presentation

                                                                                        8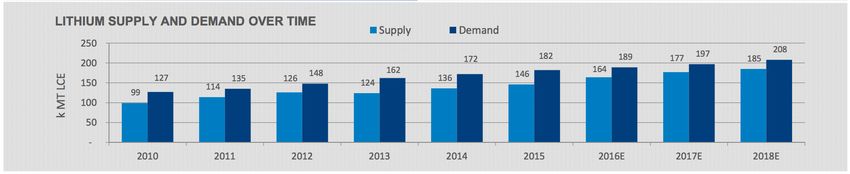
Investment Thesis: Advanced Metallurgical Group (AEX: AMG)
By: Anshul Subramanya
Last Updated: 06/16/17
        Currently, the lithium project is progressing in line with expectations; a full offtake
agreement for mined spodumene has been established and production is expected to
commence mid-2018. For the purposes of the model, we assume that the first plant will
generate 45k MT in 2018 and 90k MT from 2019 onwards, while the second plant will
generate 45k MT in 2019 and 90k MT from 2020 onwards. Because of the low
production costs of spodumene (production costs are approx. 30% margin on sale
price), these plants are expected to generate significant EBITDA and bottom line
earnings for AMG, much to the benefit of the company’s FCF and to their shareholders.
        The maximum output of 180k MT total per year generates annual revenue of
$144M and annual incremental EBITDA of $97.2M, and AMG estimates $96M EBITDA
from their non-lithium business in 2017. This leads to the extremely reassuring
conclusion that AMG could reach their EBITDA target of $200M by 2021 by simply
maintaining their non-lithium businesses and allowing their spodumene plant production
to ramp up. This does not even begin to consider the positive implications of rising metal
prices and any additional growth projects in the pipeline. As shown in the Monte Carlo
analysis, EBITDA of $200M from 2021 through 2026 yields an estimated FCF / share of
approx. $33, which is a significant gain over AMG’s current market value.

       Organic Growth Projects
       AMG’s management has mentioned that there are some promising organic
growth projects in the project pipeline. While details of these projects have not been
released, it should be noted that the BUY rating for AMG is not contingent on the
outcome of these projects. With only the spodumene project, AMG is expected to
generate enough EBITDA and cash flow to buoy their share price to over $33 per share.
Any additional top line or bottom line benefit from the organic growth projects is simply
additional upside.

Analyst Recommendations
       Three of three analysts covering AMG recommended a buy rating (Figure 7).
From the results of the Monte Carlo simulation, we see that analysts seem to be valuing
AMG slightly higher than the share price targeted in this thesis. This may be due to
optimism about organic growth projects, different discount rates, or a multiples-based
approach rather than a cash-based approach. ING and Kempen target 31 and 33 euros
per share respectively, and we target approx. 30 euros per share.

                                                                                             9
Investment Thesis: Advanced Metallurgical Group (AEX: AMG)
By: Anshul Subramanya
Last Updated: 06/16/17
Figure 7: Analyst Recommendations of AMG – Target prices for ING and Kempen
are 31 and 33 euros respectively. These prices are slightly higher than our target price
of approx. 30 euros.
Bloomberg Terminal Command ; Accessed 05/05/2017
Historical Performance
AMG’s stock price hovered between 6 and 8 euros per share until mid-2016, at
which point share price rose to over 19 euros per share in late September (Figure 1).
This rise was spurred by extremely positive earnings reports throughout early-mid 2016,
as well as reassuring news about AMG’s progress with their lithium project. Share price
fell in late 2016, likely due to falling metal prices, but has since rebounded from less
than 15 euros a share in 2016 to over 24 euros a share as of 05/15/2017. Equity
markets took note of AMG’s nine business units each outperforming their EBITDA
targets, of the company’s consistently low net debt, and of the potential within the
company’s growth projects, and share price appropriately rose.
10Investment Thesis: Advanced Metallurgical Group (AEX: AMG)
By: Anshul Subramanya
Last Updated: 06/16/17
Ratio Performance
Summary of Useful Life and LTAT for AMG
13.00 3.80
3.70
12.50
3.60
Useful Life
12.00
3.50
LTAT
11.50 3.40
3.30
11.00
3.20
10.50
3.10
10.00 3.00
2011 2012 2013 2014 2015 2016
UL LTAT
Figure 8: Asset Turnover Ratios – Both LTAT and UL were lower from 2013 through
2015 compared to their values in 2011. LTAT fell prematurely in 2012 because LTA had
a brief increase in property, plant and equipment (PPE)
AMG’s 10-K filings, 2011-2016
When we look at the Long Term Asset Turnover (LTAT, Revenue / LTA) and
Useful Life (UL, LTA / Depreciation & Amortization (D&A)), we see that both ratios
dropped around 2012-2013, since both top line revenue and total long term assets
decreased while D&A costs remained relatively constant (Figure 8). Going into 2016
and out of the austerity period, LTAT continued to shrink and UL continued to increase;
in this year, AMG grew its long term assets, lost revenue due to falling metal prices, and
maintained consistent D&A costs as a margin on revenue.
Historical performance of potential free cash flow yield (PFCFY, FCF / Revenue)
and free cash flow return on invested capital (FROIC, FCF / Invested Capital (Current
Assets – Current Liabilities – Cash + LTA) reveals similar trends as those seen in LTAT
and UL (Figure 9). These two ratios were lower from 2012 through 2015 compared to
their values in 2011 and 2016, reflecting AMG’s low-growth period. The growth of these
two ratios in 2016 can be largely explained, however, by a low price of crude oil
inducing lower operating costs. In addition, these two ratios saw a small rise in 2014 as
a result of a low income tax expense.
Looking forward, we could expect both of these ratios to rise relative to their 2016
values. Crude oil prices have risen since their low in 2016 and operating costs may rise
in turn, but AMG’s multiple projects are expected to generate significant EBITDA, and
as a result FCF. As we will see in the proxy statement, operating cash flow and return
on capital employed are significant portions of management compensation metrics as
well, so an emphasis is clearly placed on bottom-line rather than top-line growth.
11Investment Thesis: Advanced Metallurgical Group (AEX: AMG)
By: Anshul Subramanya
Last Updated: 06/16/17
Summary of Historical Values of Potential Free Cash Flow Yield
(PFCFY) and Free Cash Flow Return on Invested Capital (FROIC)
12.00%
Margin on Total Sales
10.00%
8.00%
6.00%
PFCFY
4.00% FROIC
2.00%
0.00%
2011 2012 2013 2014 2015 2016
Year
Figure 9: Profitability Ratios – Both PFCFY and FROIC were lower from 2012 through
2015 compared to 2011 and 2016 values. A drop in crude oil prices and thus operating
costs in 2016 contributed to the rise of both ratios, but free cash flow generated through
projects and an emphasis on cash generation at the management level should maintain
or grow these values in the future.
AMG’s 10-K filings, 2011-2016
AMG Model
AMG separates its business units by metal or metal product. This is especially
useful for the model as trends in the spot price or futures price of the metal could be
indicative of the potential earnings of the respective business segment.
We gathered quarterly revenues since 2013 for all of AMG’s business segments
within its two business units. However, it is important to note that these data reflect
revenues from a period of 1) austerity by AMG and 2) weakening metal prices. Thus,
relying solely on these historical values to project into the future would yield extremely
conservative and inaccurate estimates.
We also calculated costs allotted to capital expenditures, change in working
capital, D&A and taxes. We estimated growth for each of the 9 business segments
based on trends in metal prices, and priced the company’s lithium project
Balance Sheet and Income Statement
All data can be found in the Balance Sheet tab and Income Statement tabs in the accompanying
spreadsheet
A cursory glance at the balance sheet and income statement reveals AMG’s
commitment to deleveraging and increasing cash flow. Total long-term loans decreased
12Investment Thesis: Advanced Metallurgical Group (AEX: AMG)
By: Anshul Subramanya
Last Updated: 06/16/17
from $265M in 2012 to $112M in 2015, and total short-term loans decreased from $20M
to $3M over the same time span. Goodwill steadily decreased from $24M to $18M over
that time frame, confirming that AMG has not gone out of its way to acquire additional
specialty metal companies. In addition, total inventories decreased from $211M to
$126M between 2012 and 2015. There is an overarching trimming of the balance sheet,
as total assets (and total liabilities + equities) decreased by $200M between 2012 and
2015.
Looking at the Income Statement, there were no restructuring costs or asset
impairment costs in contrast to previous years. In addition, costs of goods sold net D&A
(COGS net D&A) significantly decreased in 2016 compared to 2015, which
subsequently increased EBITDA and net operating profit after interest and taxes
(NOPAIT).
Value Drivers
All data can be found in the Value Drivers tab of the accompanying spreadsheet
From the value drivers, we first and foremost notice the consistently negative
revenue growth rate averaging -6.32% YoY since 2011.
In addition, we notice that the margin on revenue of COGS net D&A has been
remarkably consistent from 2011 to 2015 at around 80%, but dropped in 2016 to
77.69%. Realistically, this is likely because the price of oil bottomed in early 2016 and
has only gradually risen since then, and AMG relies on oil to fuel their plants, mining,
and refinery operations. The future of oil is uncertain, with both political and economic
factors affecting the trajectory of the price per barrel, so we hold this margin to 78.50%
in our models. Assuming the COGS margin is tied to the price of oil, this simulates an
increase in oil price compared to 2016.
In addition, EBITDA jumped from 6.73% in 2015 to 9.24% in 2016. This appears
to be directly due to the drop in COGS.
Finally, we can see that AMG’s CAPEX for the years of 2013-2015 was
extremely minimal, around .5% margin on revenue. In contrast, CAPEX was
approximately 5% in 2012, and 6.76% in 2016. We also see that D&A has been
relatively constant at approximately 3% margin on revenue since 2011. Change in
working capital has been consistently negative over the last five years, reflecting a
decrease in current assets and current liabilities but an increase in cash on hand.
Revenue Growth
All data can be found in the Revenue Growth M tab of the accompanying spreadsheet
The compounded annual growth rate (CAGR) for every business segment in
AMG Critical Materials has been negative since 2013 (Figure 10). While on first glance
this is worrisome, it should be noted that this revenue captures a period of both
austerities on AMG’s side and severely weakening metal prices in the global economy.
Revenues from titanium and antimony saw the biggest hits, with yearly revenues
from titanium decreasing from $120.7M in 2013 to $87.7M in 2016, and yearly revenues
from antimony decreasing from $113M in 2013 to $75.3M in 2016.
13Investment Thesis: Advanced Metallurgical Group (AEX: AMG)
By: Anshul Subramanya
Last Updated: 06/16/17
AMG’s Engineering unit saw relatively consistent performance since 2013;
revenues shrank between 2013 and 2014, but recovered the same amount between
2015 and 2016.
Figure 10: Revenue Growth – Revenues for almost all business segments shrank
between 2013 and 2016 as a result of weakening metal prices.
AMG’s Investor Presentations
P-DCF Assumptions
The P-DCF can be found in the PDCF tab in the accompanying spreadsheet
Assumptions made in composing the P-DCF can be broken up into three
categories: Cost Margin Assumptions, Base Business Assumptions, and Lithium
Assumptions. We briefly discuss our handling of Model Tuning Parameters such as
PFCFY, FROIC, etc. at the end of this section as well.
Cost Margin Assumptions
Cost margins refer to margins for operating costs, non-operating costs, CAPEX,
and D&A. As mentioned above, the margin for COGS net D&A was likely lower than
usual in 2016 due to bottomed oil prices, so we set this margin to 78.50% for the
entirety of our 10-year projection. This assumes a rise in oil price from present day
values.
For operating costs of selling, general and administrative (SGA), restructuring,
environmental expense, and other income, historical margins are relatively consistent,
14Investment Thesis: Advanced Metallurgical Group (AEX: AMG)
By: Anshul Subramanya
Last Updated: 06/16/17
so these are projected at their historical average for the 10-year projection. We assume
asset impairment costs are 0, however, as the only significant asset impairment charge
occurred in 2013.
Interest expenses are calculated as a margin on total debt, and AMG’s interest
rate has hovered around 9% historically. Interest income, ForEx loss, and D&A are all
calculated as a margin on revenue and have been historically consistent as well. As a
result, margins for these four costs are held at historical averages for the DCF.
Income tax expense, on the other hand, is calculated as a margin on earnings
before taxes (EBT, EBITDA – Interest Expense + Interest Income – D&A) and has been
extremely volatile historically. Given AMG’s international presence, this may be due to
changes in the valuation of various currencies; management cites the volatile Brazilian
currency as one of the drivers behind its high income tax expense in 2015. An official or
targeted income tax rate is not provided by AMG, so a rate of 25% margin on EBT is
assumed for this model.
Finally, CAPEX is held at 6% margin on revenue through 2021, slightly lower
than its value in 2016. From 2022 onwards, it is held at 3%. Note that this does not
include CAPEX that will be directed towards AMG’s lithium project. Expenditures for that
item are added separately in the DCF; the CAPEX margin discussed here can be
thought of as AMG’s expenditures to grow its current business.
Base Business Revenue Assumptions
Trends in metal prices can be found in the Metal Spot Prices tab of the accompanying spreadsheet
We use the term ‘base business’ to refer to AMG’s current portfolio of business
units excluding the lithium project. We estimate revenues for AMG’s Critical Material
units by correlating business unit revenue with appropriate specialty metal spot prices.
For example, if the price of aluminum for 2017 is in line with prices from 2014, we can
expect AMG Aluminum to generate similar revenues as it did in 2014. Under this
assumption, we do not have to rely on historical growth rates to estimate future growth;
we can instead look directly at trends in the global economy and in metal spot prices.
For each business unit within AMG Critical Materials, we perform the following:
1. Identify the relevant specialty metal that supports the business unit (i.e. AMG
Chromium is supported by sales of chrome and chrome products).
2. Compare the present spot price of the metal to historical prices
3. Find the most recent year where metal price is comparable to the price in the
current year
4. Identify business unit revenue from the comparable year
5. In the P-DCF, input revenue growth rates such that by 2018, business unit
revenue approaches revenue from the comparable year
6. Assume revenue growth rate of 0% for every following year in the P-DCF.
15Investment Thesis: Advanced Metallurgical Group (AEX: AMG)
By: Anshul Subramanya
Last Updated: 06/16/17
If the current spot price of a metal is not available, we hold the revenue growth
rate at 0% YoY. This is a very conservative assumption as metal prices are increasing
as a whole in the global economy, and revenues should actually rise.
For AMG Engineering, we assume a constant 1% YoY growth in revenue for the
duration of our P-DCF.
After incorporating these assumptions, our model estimates EBITDA of around
$95M from AMG’s base business in 2021. This is in line with management’s EBITDA
target of $100M from the base business and the discrepancy can be explained by our
conservative growth estimates.
Lithium Business Assumptions
We use the term ‘lithium business’ to refer to AMG’s spodumene (lithium
concentrate) plants at the Mibra mine in Brazil. Management has offered significant
insight into their expectations for this business, namely:
- Production levels of 180k MT of lithium concentrate from 2020 onwards
- Two spodumene plants
o The first with capital investment of $50M, the second with capital
investment of $80M
o Production for the first plant begins mid-2018, production for the second
plant begins mid 2019
- Sale price that “exceeds $800 per ton of lithium concentrate”4
- Production costs of $211 per ton
- Expectations of $115M in incremental EBITDA by 2021
To price this project into the model, we project spodumene production 10 years
forward according to the plant ramp-up schedule as described above. A price per MT of
$800 is assumed in order to calculate top line sales generated from the plant, and
operating costs of $260 per MT are used to calculate EBITDA. We do make the
assumption that ‘production costs’, the term used by management, refers to all
operating costs, and that these costs exclude D&A. Lithium EBITDA is then added to
EBITDA generated from AMG’s base business. With these assumptions, our model
finds incremental EBITDA of approx. $97.2M in 2021. This is under management’s
expectations of $115M incremental EBITDA, but we elect to use our figure to provide a
more conservative estimate of free cash flow.
The CAPEX for the mines are handled as line items separate from AMG’s
expenditures for their base business. The first mine is expected to begin production mid-
2018, so we split the $50M investment into $25M spent in 2017 and $25M spent in
2018. The second plant is expected to begin production in mid-2019, costs an additional
$50M to build, and requires an additional $30M to expand the mining infrastructure in
the area. We allocate $55M of this expenditure into 2018, and $25M into 2019.
4
Advanced Metallurgical Group (March, 2017). AMG Reports Full Year and Fourth Quarter 2016 results and provides update on
lithium project. Retrieved from http://www.amg-nv.com/Investors/Press-Releases/Press-Release-Details/2017/AMG-Reports-Full-
Year-and-Fourth-Quarter-2016-Results-and-Provides-Update-on-Lithium-Project/default.aspx
16Investment Thesis: Advanced Metallurgical Group (AEX: AMG)
By: Anshul Subramanya
Last Updated: 06/16/17
Model Tuning Parameters
For this paper, ‘model tuning parameters’ refers to PFCFY, FROIC, and percent
of invested capital in long term assets (LTA/IC). The typical procedure for modeling a
company using the P-DCF is to ensure that the ranges of these ratios in the model are
in line with their historical values. This ensures that a particular valuation is not reliant
on the company significantly changing their operational structure and efficiency.
We choose to not focus heavily on aligning estimated and historical model tuning
parameters for two reasons. First, the historical values of these metrics capture AMG in
their austerity period while we wish to model the company’s value after a period of high
growth. Second, we are already able to ensure that our model is realistic by basing our
assumptions for the lithium project, EBITDA, and CAPEX on management’s explicit
guidelines. These are more reliable than the company’s historical performance in
gauging their future performance.
Monte Carlo Results
These results can be found in the MC tab of the accompanying spreadsheet
To determine a margin of safety around the estimated FCF / share generated
from the P-DCF, we performed a Monte Carlo simulation.
A chart of the resulting distribution of share price is shown below. The resulting
distributions for almost every model tuning parameter was significantly out of historical
ranges, but this is because AMG will effectively be a different company in upcoming
years as it has been in the past. With EBITDA poised to double and over $100M in
capital expenditures planned, the asset base and earnings ratios for the company are
sure to change significantly in upcoming years. Comparing estimated values to historical
values, as a result, offers little insight.
Running the model yields an average estimated FCF / share of $33.50
compared to the current share price of $29.58 (Figure 12). This is an estimated gain of
13.25%.
17Investment Thesis: Advanced Metallurgical Group (AEX: AMG)
By: Anshul Subramanya
Last Updated: 06/16/17
Figure 12: Distribution of Expected Share Price with only the Lithium Project
priced in – The average estimated FCF per share is approx. $33.50, a gain of 13.25%
over the current share price. Even when ignoring any potential organic growth projects
in the future, AMG’s fundamental value is still greater than its market value.
The results of our Monte Carlo Simulation offer significant confidence in our
investment thesis. Management’s expectations of $200M EBITDA by 2021 result in the
distribution shown in Figure 12. So long as AMG completes their spodumene project,
consequently achieving management’s EBITDA goal, they will offer significant growth in
shareholder value.
Capital Allocation
Debt
As mentioned before, AMG focused a great deal on deleveraging over the last
three years and coined this strategy their ‘austerity measures’. These efforts succeeded
as the company’s net debt was negative in 2015 and rose to only $7.3M in 2016, a
debt-to-EBITDA ratio of 8.2%.
As a result, AMG has a significant amount of liquidity available to them in the
form of their RCF that expires in 2021 and their existing cash on hand (Figure 13). Just
the amount available in the RCF is enough to finance both spodumene mines, and
additional initiatives could be paid through debt if AMG decided to issue bonds as well.
This continues to align with our thesis that AMG has significant resources they
can use to fund their various value-driving projects. If desired, the company could issue
long term bonds, fund all upcoming projects through debt, and reduce cost of capital.
18Investment Thesis: Advanced Metallurgical Group (AEX: AMG)
By: Anshul Subramanya
Last Updated: 06/16/17
Figure 13: AMG’s Leverage Opportunities – AMG still has approx. $243M available
in its RCF as well as $160M cash on hand.
AMG’s Annual Report, 2016
Management Compensation
AMG’s management board consists of CEO Mr. Heinz Schimmelbusch, COO Mr.
Eric Jackson, and CFO Mr. Jackson Dunckel. A full summary of their compensation can
be found in Figure 14.
Figure 14: AMG Management Board Compensation – Heinz Schimmelbusch, Eric
Jackson, and Jackson Dunckel are the three members of AMG’s management board. A
summary of their compensation is shown here.
AMG’s Annual Report, 2016
The annual bonus in the figure above depends on three key performance metrics
(weighting): return on capital employed (ROCE, 40%), operating cash flow (40%), and
individual performance (20%). AMG does not provide a definition of ROCE, and the
traditional definition of earnings before interest and tax (EBIT) divided by the sum of
19Investment Thesis: Advanced Metallurgical Group (AEX: AMG)
By: Anshul Subramanya
Last Updated: 06/16/17
shareholder equity and debt (Capital Employed) does not align with published values.
However, management states that ROCE and operating cash flow in 2016 were
significantly above targets set by the supervisory board. In addition, the first two metrics
are measured against agreed target ranges, and performance under the target range
yields 0% payout. Measurement of ‘individual performance’ is done at the discretion of
the Supervisory Board.
These particular metrics indicate that compensation is not particularly tied to top-
line revenue, but rather to cash and earnings after operating costs. We have already
shown that AMG has the growth potential to attain the $200M EBITDA target by 2021,
but this compensation scheme shows that management is also incentivized to do so.
EBIT should be an appropriate proxy for EBITDA, as we have seen that AMG’s D&A
expenses have been remarkably consistent historically. As a result, we can further
increase our confidence in our investment thesis.
Long Term Incentives include stock options and performance share units (PSU).
The number of PSUs vested is subject to a minimum average ROCE over the
performance period and the relative total shareholder return (TSR) compared to the
Bloomberg World Metal Fabricate/Hardware index. The reliance of vested PSUs on TSR
compared to the Bloomberg World Metal Fabricate/Hardware Index is reassuring. This
metric isolates AMG’s performance from global market conditions and incentivizes the
development of competitive advantages against AMG’s peers.
AMG’s peer group can be found below (Figure 15). The group follows a US-
centric approach, and was revised for this year.
Figure 15: AMG’s Peer Group
AMG’s Annual Report, 2016
20Investment Thesis: Advanced Metallurgical Group (AEX: AMG)
By: Anshul Subramanya
Last Updated: 06/16/17
Conclusion
Our investment thesis for AMG is rooted in explicit guidelines released by
management regarding EBITDA targets and return from the spodumene plants. The
particular target of $200M+ EBITDA by 2021 has been stated numerous times; our
model finds that achieving this goal yields an expected FCF / share significantly above
the current market value (Figure 12). In addition, by pricing only the lithium project into
our model according to the public production schedule, our model finds that AMG is
clearly able to reach this target. We find that the stock is currently trading at a 13.25%
discount from their fundamental value, even when we ignore the impact of upcoming
organic growth projects, use conservative revenue growth assumptions for AMG’s base
business, and model the spodumene CAPEX using cash rather than debt, which would
offer a lower cost of capital. AMG’s clear debt schedule and steady cash flow allow
them to finance these opportunities as they see fit, and management’s compensation is
tied to EBIT, an effective proxy for EBITDA, that ensures they prioritize the achievement
of these targets.
In summary, AMG has the resources to fund their growth opportunities en route
to their financial targets, which, when met, should in turn buoy the company’s share
price compared to the present value. Any additional upside from future growth projects
or from more effective financing is simply an added bonus. As a result, we rate AMG a
BUY.
Appendix
21Investment Thesis: Advanced Metallurgical Group (AEX: AMG)
By: Anshul Subramanya
Last Updated: 06/16/17
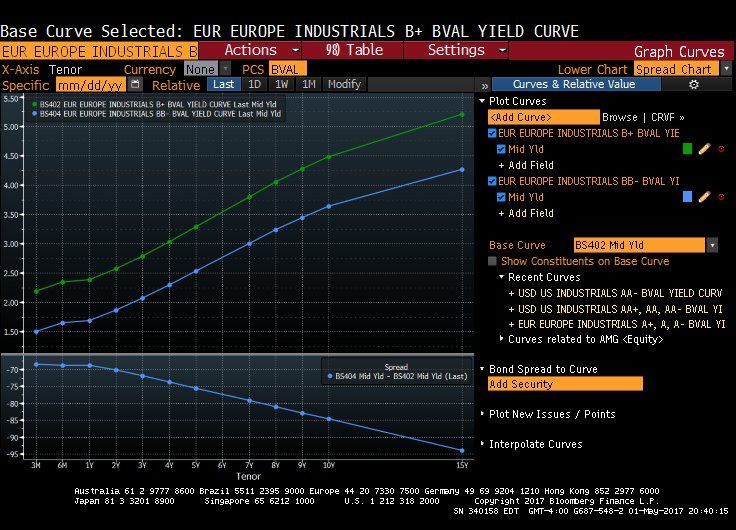
Appendix 1: Yield curves for B+ and BB- bonds
Bloomberg Terminal ; Accessed 05/05/2017
Appendix 2: AMG’s deleveraging over the last five years
Bloomberg Terminal ; Accessed 05/05/2017
22Investment Thesis: Advanced Metallurgical Group (AEX: AMG)
By: Anshul Subramanya
Last Updated: 06/16/17
Appendix 3: Ownership Summary
Bloomberg Terminal ; Accessed 05/05/2017
Appendix 4: Ownership Summary, cont.
Bloomberg Terminal ; Accessed 05/05/2017
23You can also read