9M-2020 Results LEG Immobilien AG 12 November 2020
←
→
Page content transcription
If your browser does not render page correctly, please read the page content below
LEG Immobilien AG
9M-2020 Results

12 November 2020

1 I   November 2020
Disclaimer

While the company has taken all reasonable care to ensure that the facts stated in this presentation are accurate and that the
opinions contained in it are fair and reasonable, this presentation is selective in nature and is intended to provide an
introduction to, and an overview of the Company’s business. Any opinions expressed in this presentation are subject to
change without notice and neither the Company nor any other person is under any obligation to update or keep current the
information contained in this presentation. Where this presentation quotes any information or statistics from any external
sources, you should not interpret that the Company has adopted or endorsed such information or statistics as being accurate.

This presentation may contain forward-looking statements that are subject to risks and uncertainties, including those
pertaining to the anticipated benefits to be realised from the proposals described herein. Forward-looking statements may
include, in particular, statements about future events, future financial performance, plans, strategies, expectations, prospects,
competitive environment, regulation, and supply and demand. The Company has based these forward-looking statements on
its views and assumptions with respect to future events and financial performance. Actual financial performance could differ
materially from that projected in the forward-looking statements due to the inherent uncertainty of estimates, forecasts and
projections, and financial performance may be better or worse than anticipated. Given these uncertainties, readers should not
put undue reliance on any forward-looking statements. The information contained in this presentation is subject to change
without notice and the Company does not undertake any duty to update the information and forward-looking statements, and
the estimates and assumptions associated with them, except to the extent required by applicable laws and regulations.

This presentation does not constitute an offer or invitation to purchase or sell any shares in the Company and neither this
presentation or anything in it shall form the basis of, or be relied upon in connection with, any contract or commitment
whatsoever.

 2 I   November 2020
Agenda

I.          HIGHLIGHTS 9M-2020

II.         PORTFOLIO AND OPERATING PERFORMANCE

III.        FINANCIAL PERFORMANCE

IV.         OUTLOOK

V.          APPENDIX

3 I    November 2020
Highlights 9M-2020
Strong performance – FFO I Guidance 2020 narrowed
and positive outlook for 2021
Financials Operations ESG
FFO I +14.5% to €296.7m Net cold rent +5.6% EPRA Gold award and
Sustainalytics upgrade
EBITDA-Margin 77.5% L-f-l rental growth +2.3%
CO2 Accounting – well on track
LTV 36.4%/pro forma LTV ~40%1 L-f-l vacancy 3.1% (-50bps)
7.7y for 1.35% Initiated Germany’s first real-
Acquisition of Fischbach
world laboratory for serial
NAV ps €115.21 Services to scale apartment
modernisation
renovation capacities
Corona bonus for all employees
to recognize performance
Strong performance in 9M-2020
Guidance narrowed to upper end of ~€380m for FY 2020
Minimal Corona effect YTD
Strong financial profile maintained – in line with strategy
Further growth ahead: FY 2021 guidance of €410m – 420m
1 Pro forma LTV - taking the remaining ~6,400 units acquisition as well as the linked cash outflows into account.
4 I November 2020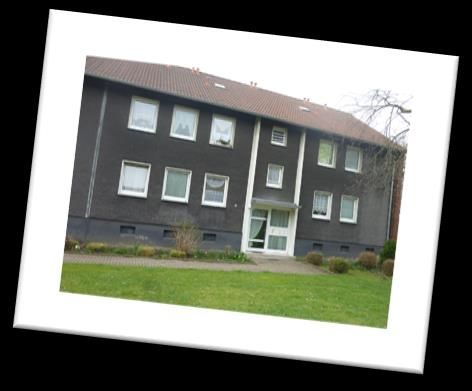
Highlights 9M-2020
COVID-19 update: Effects remain minimal – up to now no
effects from second wave
Impact on rental growth: ~50bps Shift towards digital
Voluntary suspension of Miet- on operations
spiegel rent increases: ~20bps Virtual and full self-serviced
Resumed in Q3/ effective in Q4 viewings for prospective tenants
Postponement of modernisation Resilient Enabling employees to work
measures in H1: ~30bps Business from home up to 100%
Model
Deferral of rents Acquisitions

Highlights 9M-2020
We act in line with our strategy – LWS Plus extends value
chain successfully
Our strategy Expanding the
value chain
Optimizing the Expanding Growing
Overall a focussed approach – no intention to
core business the value the platform
chain insource everything
Acquisition of Fischbach Services to smartly
Tapping rental Increasing and Focusing on
growth potential extension of affordable housing position along the value chain with special focus
value-add services
Improving customer Scaling position on apartment renovation capacitites
satisfaction Reasonable in NRW
development
Enhancing efficiency
activities
Exploiting Integration as fourth pillar of our services offering
opportunities
in Germany as LWS Plus
Scalable business
Strong balance sheet ESG framework Digitalization
SOLID PLATFORM
6 I November 2020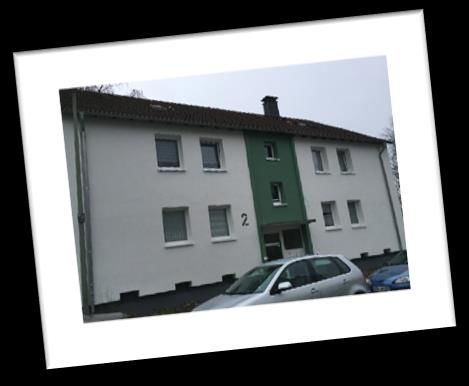
Highlights 9M-2020
Further improving our ESG profile

   ESG                           2016   2017     2018            2019          2020

                       ESG
                       Rating

                       ESG
                       Rating
                                                                 20.1           10.4

                       sBPR
                       Award

                       ESG                                                    New scoring
                       Rating
                                                                  52           in progess

                       ESG
                       Index

                       ESG                          MSCI EAFE Choice ESG Screened Index
                                                     MSCI World Custom ESG Climate Series
                       Indices                 MSCI OFI Revenue Weighted Global ESG Index

 7 I   November 2020
Agenda

I.          HIGHLIGHTS 9M-2020

II.         PORTFOLIO AND OPERATING PERFORMANCE

III.        FINANCIAL PERFORMANCE

IV.         OUTLOOK

V.          APPENDIX

8 I    November 2020
Internalization of business
Acquisition of Fischbach Services GmbH
Scalable business model
Company Transaction Rationale Financials
background details for LEG
Project management company LEG purchased 100% of Goal is to scale business to EBITDA contribution1 of ~€5m for
specialized on managing the Fischbach Services GmbH conduct 75% of LEG‘s renovation 2021
renovation of vacant apartments per 01.10.2020, wholly of vacant apartments through EBITDA-margin effect1 on Group
Currently conducting 25% of LEG‘s owned subsidiary of Fischbach in the medium-term level of +100bps
renovation of vacant apartments Fischbach Holding GmbH Access to attractive margin part Future growth primarily fuels
Scalable, efficient and proven and Contractual framework of value chain without positive cash effect and will not
highly digitalized platform ensures commitment of requirement to add craftsmen to be transparent in Group KPI due
founders, management, payroll to consolidation
Low personal intensity with only 25
staff and contractors for the Faster / better quality renovation
employees, managing approx. 80
coming years to reduce duration of vacancies
contractors
Significant margin contribution due to attractive position at the value chain
Planning & Commisioning Control & Co-ordination Execution
Margin Personell
intensity
Value Generation Value Generation 3rd parties
1 Expected FY 2021 effect; for accounting effects see slide no.37 in Appendix.
9 I November 2020Portfolio and operating performance
Rent development positive across all market clusters
Market split (GAV) In-place rent €/sqm Vacancy
6.73 4.8%
21.1%
5.61 5.45
44.2% 3.1%
1.7%
34.7%
Markets Total portfolio High-growth Stable Higher-yielding
9M-2020 (YOY) 9M-2020 (YOY) 9M-2020 (YOY) 9M-2020 (YOY)
1
# of units 138,601 +3.6% 41,918 +5.6% 54,203 +6.2% 42,360 -1.6%
GAV residential assets (€m) 12,692 +17.4% 5,612 +13.5% 4,404 +26.8% 2,676 +20.4%
In-place rent (sqm), l-f-l €5.93 +2.3% €6.73 +2.3% €5.61 +2.6% €5.45 +2.0%
EPRA vacancy, l-f-l 3.1% -50 bps 1.7% -20 bps 3.1% -40 bps 4.8% -110 bps
1 Incl. 120 units intended for disposal.
10 I November 2020Portfolio and operating performance
+2.3% l-f-l rental growth in 9M 2020
L-f-l rent development L-f-l free financed rent development
(€/sqm/month) (€/sqm/month)
+2.4%
+2.3%
+2.7%
+2.3%
+1.9%
6.16 6.31 7.16 7.34
5.79 5.93
5.78 5.94 5.71
5.60
9M-2019 9M-2020 9M-2019 9M-2020
Residential rent Free financed rent High-growth Stable Higher-yielding
Performance of free financed units demonstrates strong underlying fundamentals
Some negative effects from Corona due to Mietspiegel rent increase suspension and postponed modernisation projects
Rent restricted units: +2.0% year-on-year (like-for-like) due to cost rent adjustment in January 2020
High exposure to structural growth markets and respective commuter belts support strong performance
11 I November 2020Portfolio and operating performance
Capex & maintenance
Ongoing focus on growth and energy efficiency
+34.8%
€262.8m €202.7m Investments increased c.35%
(€29.4/sqm) (€22.67/sqm)
Largest share of
year-over-year due to strong
modernisation from increase in line with value
€194.9m energy efficiency
(€22.3/sqm) enhancing capex
measures
Benefitting from available capacities
202.7
Among others and low VAT
136.5 • Floors
• Electronical installations 9M increase mainly driven by
• Heating energy efficient modernisation as
• Bathrooms
well as value-enhancing turn-cost
spending
58.4 60.1
9M-2019 9M-2020
Other
Capex Modernisation
Maintenance Turn costs
Maintenance
12 I November 2020Portfolio and operating performance
Total portfolio related expenditures – breakdown
Split across types Split across markets
of expenditures and segments
€390 – 400m1
€365 – 375m1 €40 – 42/sqm
€38 – 40/sqm
Repair (TSP)
Energetic modernisation
Bathrooms
Doors/walls/ceilings
Floors
Elevators
Electricity
Outdoor
facilities/balconies
Other
FY2020e FY2021e FY2021e FY2021e
Capex Stable markets
Maintenance
High-growth markets
Acquisition backlog
New development Higher-yielding
markets
1 Capex + Maintenance
13 I November 2020Agenda I. HIGHLIGHTS 9M-2020 II. PORTFOLIO AND OPERATING PERFORMANCE III. FINANCIAL PERFORMANCE IV. OUTLOOK V. APPENDIX 14 I November 2020
Financial performance
Margin expansion story continues
Margins 79.6% 81.0% 75.1% 77.5% 59.6% 63.9%
€m
+5.6% +7.5% +9.0% +14.5%
FFO I ps
464.5 €4.09
439.8
€4.25
376.3 360.2
350.1
330.5
296.7
259.1
9M-2019
9M-2020
Net cold rent Adj. net rental Adj. EBITDA FFO I
and lease income
▲ ▲ ▲
Ongoing efficiency Reduced admin costs Lower cash taxes
gains and scale effects and higher income from and lower minorities
other services
15 I November 2020Financial performance
FFO bridge 9M-2020:
Increase of +€37.6m (+14.5%)
€m
1.2 2.7 296.7
8.0
18.2 -6.6 2.7 -0.4 0.7 -1.4
12.4
259.1
+14.5%
FFO I Organic Net rental Effect from Lower Higher Lower Higher Lower Minorities Other FFO I
9M-2019 rental growth disposals I-f-I I-f-I recurring net cash net cash 9M-2020
growth from acquis. operating maintenance admin interest taxes
cost costs
+€22.8m (+7.2%)
16 I November 2020Financial performance
EPRA Net Asset Value of €115.21 per share
Adj. EPRA NAV ps (in €)
4.96 -0.11 -3.60
-0.041 115.21
8.60
Profit and revaluation gains as
the key drivers for NAV uplift in
105.39 9M 2020
Minor effects from OCI and the
capital increase
+9.3%
31.12.2019 Valuation Profit for OCI Dividend Financing 30.09.2020
IAS 40 the period effects payout effect
(excl.
Valuation)
1 Effects from capital increase (€-0.14 per share) and 2017/2025 convertible bond (in the money; €+0.10 per share).
17 I November 2020Financial performance – Portfolio
Portfolio valuation: With €1,440/sqm @4.8% gross yield
still at attractive levels in absolute and relative terms
GAV In-Place GAV
Residential Residential GAV/ Gross Rent Market Commercial/ Total GAV
Market segment Units Assets (€m) sqm (€) yield Multiple Multiples1 Other (€m) (€m)
High-
Growth 41,918 5,612 2,001 4.0% 25.2x 21.4x 252 5,864
Markets
Stable
Markets 54,203 4,404 1,284 5.2% 19.3x 17.1x 141 4,545
Higher-Yielding
Markets 42,360 2,676 1,036 6.1% 16.5x 15.0x 86 2,762
Total Portfolio2 138,601 12,692 1,440 4.8% 20.7x 18.2x 478 13,171
1 Estimated rental values as of 30 June 2020.
2 Incl. 120 units intended for disposal.
18 I November 2020Portfolio and operating performance – Capex & maintenance
Increased investments in modernisation and energy
efficiency measures translate into strong returns
Monheim Dortmund Herne
Market High-growth Stable Higher-yielding
# of units 1,963 415 56
Total sqm 134,022 30,263 3,565
Year(s) of construction 1967 – 1971 1967 1962
Mod. start/completion1 2014 - 2021 2015 - 2018 2019 - 2020
8.20 8.25 7.53
Rent development2 6.25 5.92 5.53
6.75 6.32
4.60
(€/sqm)
+31.2% +28.7% +22.1%
Before mod. After mod. Market rent Before mod. After mod. Market rent Before mod. After mod. Market rent
Total investment3 €60.3m €10.2m €1.7m
Share of modernisation 66% 60% 72%
Yield total vs. mod.4 5.3% 8.1% 4.7% 7.9% 3.0% 4.2%
E.g. thermal insulation composite E.g. thermal insulation composite E.g. thermal insulation composite
system, windows, roof renewal with system, dismantling asbestos facade, system, top floor ceiling insulation attic
Modernisation and
insulation, balconies renovation, windows, balconies, bell systems, fire ceiling insulation, windows, balconies,
maintenance measures
cellar ceiling insulation, staircase protection doors, elevator system, house entrance doors, canopies, cellar
paint intercom system exits
Average reduction of
energy demand p.a. -40% -46% -45%
after modernisation5
1 With the exception of the Herne project, all modernisation projects include several residential properties with staggered start and end dates over the specified period.
2 Square meter prices across all projects; market rent = median, offer rents for new lettings from 01.10. to 30.09.2020, excluding subsidised units and new buildings, including LEG's own offers.
3 Including investments for modernisation, maintenance and repair.
4 Statistical initial yield; spread of rent income after and before modernisation in relation to total investment or investment for modernisation; target yield for Monheim project as not all projects have yet been completed.
5 Calculated values.
19 I November 2020Portfolio and operating performance – Capex & maintenance
Example 1: 1,963 modernised units in Monheim
"Here in Monheim, LEG has invested many millions of euros to modernise the Berlin
district over the past few years. We are of course delighted that the company is Market High-growth
realising its largest project so far here. We have been working well together for many
years on the stepwise development of this particular district – # of units 1,963
with great success." Total sqm 134,022
Mayor of Monheim Minden-
Lübbecke Year(s) of construction 1967 – 1971
Daniel Zimmermann Steinfurt
Herford Mod. start/completion1 2014 - 2021
8.20 8.25
6.25
Bielefeld
Lippe
Borken Münster
Rent development2 +31.2%
Coesfeld
Warendorf
Gütersloh
(€/sqm)
Before mod. After mod. Market rent
Kleve Hamm Paderborn Höxter
Wesel Recklinghausen
Unna
Gelsenkirchen
OberhausenHerne Dortmund
Soest Total investment3 €60.3m
Bochum
DuisburgEssen
Share of modernisation 66%
Krefeld Hagen
Mettmann
Viersen Hochsauerlandkreis Yield total vs. mod.4 5.3% 8.1%
Düsseldorf Wuppertal Märkischer Kreis
Mönchengladbach Solingen
Rhein-Kreis
Neuss Leverkusen Olpe
Heinsberg E.g. thermal insulation composite
Cologne OberbergischerSiegen- system, windows, roof renewal with
Rhein-Erft-Kreis Kreis Wittgenstein Modernisation and
insulation, balconies renovation,
Düren maintenance measures
Aachen
Rhein-Sieg-Kreis cellar ceiling insulation, staircase
Bonn paint
Average reduction of
Euskirchen
energy demand p.a. -40%
after modernisation5
1 With the exception of the Herne project, all modernisation projects include several residential properties with staggered start and end dates over the specified period.
2 Square meter prices across all projects; market rent = median, offer rents for new lettings from 01.10. to 30.09.2020, excluding subsidised units and new buildings, including LEG's own offers.
3 Including investments for modernisation, maintenance and repair.
4 Statistical initial yield; spread of rent income after and before modernisation in relation to total investment or investment for modernisation; target yield for Monheim project as not all projects have yet been completed.
5 Calculated values.
20 I November 2020Portfolio and operating performance – Capex & maintenance
Example 2: 415 modernised units in Dortmund
Market Stable
# of units 415
Total sqm 30,263
Minden-
Lübbecke Year(s) of construction 1967
Steinfurt
Herford
Mod. start/completion1 2015 - 2018
7.53
5.92
Bielefeld 4.60
Lippe
Münster
Borken Rent development2 +28.7%
Coesfeld
Warendorf
Gütersloh (€/sqm)
Before mod. After mod. Market rent
Kleve Hamm Paderborn Höxter
Wesel Recklinghausen
Unna
Gelsenkirchen
OberhausenHerne Dortmund
Soest Total investment3 €10.2m
Bochum
DuisburgEssen
Share of modernisation 60%
Krefeld Hagen
Mettmann
Viersen Hochsauerlandkreis Yield total vs. mod.4 4.7% 7.9%
Düsseldorf Wuppertal Märkischer Kreis
Mönchengladbach Solingen
Rhein-Kreis
Neuss Leverkusen Olpe
Heinsberg E.g. thermal insulation composite
Cologne OberbergischerSiegen- system, dismantling asbestos
Rhein-Erft-Kreis Kreis Wittgenstein Modernisation and
facade, windows, balconies, bell
Düren maintenance measures
Rhein-Sieg-Kreis systems, fire protection doors,
Aachen
Bonn
elevator system, intercom system
Average reduction of
Euskirchen
energy demand p.a. -46%
after modernisation5
1 With the exception of the Herne project, all modernisation projects include several residential properties with staggered start and end dates over the specified period.
2 Square meter prices across all projects; market rent = median, offer rents for new lettings from 01.10. to 30.09.2020, excluding subsidised units and new buildings, including LEG's own offers.
3 Including investments for modernisation, maintenance and repair.
4 Statistical initial yield; spread of rent income after and before modernisation in relation to total investment or investment for modernisation; target yield for Monheim project as not all projects have yet been completed.
5 Calculated values.
21 I November 2020Portfolio and operating performance – Capex & maintenance
Example 3: 56 modernised units in Herne
Market Higher-yielding
# of units 56
Total sqm 3,565
Minden-
Lübbecke Year(s) of construction 1962
Steinfurt
Herford Mod. start/completion1 2019 - 2020
6.75 6.32
5.53
Bielefeld
Lippe
Borken Münster
Rent development2 +22.1%
Coesfeld
Warendorf
Gütersloh
(€/sqm)
Before mod. After mod. Market rent
Kleve Hamm Paderborn Höxter
Wesel Recklinghausen
Unna
Gelsenkirchen
OberhausenHerne Dortmund
Soest Total investment3 €1.7m
Bochum
DuisburgEssen
Share of modernisation 72%
Krefeld Hagen
Mettmann
Viersen Hochsauerlandkreis Yield total vs. mod.4 3.0% 4.2%
Düsseldorf Wuppertal Märkischer Kreis
Mönchengladbach Solingen
Rhein-Kreis
Neuss Leverkusen Olpe
Heinsberg E.g. thermal insulation composite
Cologne OberbergischerSiegen- system, top floor ceiling insulation
Rhein-Erft-Kreis Kreis Wittgenstein Modernisation and
attic ceiling insulation, windows,
Düren maintenance measures
Aachen
Rhein-Sieg-Kreis balconies, house entrance doors,
Bonn canopies, cellar exits
Average reduction of
Euskirchen
energy demand p.a. -45%
after modernisation5
1 With the exception of the Herne project, all modernisation projects include several residential properties with staggered start and end dates over the specified period.
2 Square meter prices across all projects; market rent = median, offer rents for new lettings from 01.10. to 30.09.2020, excluding subsidised units and new buildings, including LEG's own offers.
3 Including investments for modernisation, maintenance and repair.
4 Statistical initial yield; spread of rent income after and before modernisation in relation to total investment or investment for modernisation; target yield for Monheim project as not all projects have yet been completed.
5 Calculated values.
22 I November 2020Financial performance
Strong financial profile
Maturity profile 9M highlights
€m Successful implementation of scrip dividend
2020 0 resulting in a reduced dividend payment by €84.6m
No significant maturities until 2023
2021 0 Strong liquidity as of end of October with ~€300m
2022 0 cash at hand and ~€400m RCF’s1
2023 326 1.8%
Average debt maturity (years)
2024 883 1.6%
9M-2020 7.7
2025 975 1.3%
9M-2019 7.3
2026 524 1.5%
2027 918 1.2%
Average interest costs
2028 1,007 0.9%
9M-2020 1.35%
2029 178 1.2%
2030
9M-2019 1.64%
302 1.4%
2031 0
2032+ 400 1.8%
Loan-to-value
9M-2020 36.4%/~40%1
Debt Bonds Convertible % Weighted avg. interest 9M-2019 36.3%
(excl. subsidised loans)
1 Taking the ~6,400 units acquisition from June with transfer of ownership by end of October
as well as the linked cash outflows into account.
23 I November 2020Agenda I. HIGHLIGHTS 9M-2020 II. PORTFOLIO AND OPERATING PERFORMANCE III. FINANCIAL PERFORMANCE IV. OUTLOOK V. APPENDIX 24 I November 2020
Outlook
Higher guidance 2020 and new 2021 guidance
Margin expansion story set to continue

                                 2020                                              Drivers/Comments

                       FFO I     ~€380m                €410m – 420m                2021 to benefit from 2020 acquisitions
                                 (prev. €375 – 380m)                               and rental growth

             l-f-l rent growth   ~2.3%                 ~3.0%                       Including postponed effects from 2020

                l-f-l vacancy    Slightly decreasing   –                           No longer an explicit target as vacancy
                                                                                   is close to structural level

            EBITDA margin        ~74%                  ~75%                        Scale effects + services business

                Investments      ~38 – 40€/sqm         ~40 – 42€/sqm               Excl. new construction, backlog
                                                                                   acquisitions
                          LTV    40 – 43%              40 – 43%                    Preserve strong financial basis

                    Dividend     70% of FFO I          70% of FFO I                Confirm attractive pay-out. Depending
                                                                                   on market condition also as scrip
                                                                                   dividend

                                                       Not reflected in guidance
        Acquisition ambition     >7,000 units                                      Focus on affordable living in Germany
                                                       ~7,000 units

 25 I     November 2020
Well positioned in a no-yield environment
Hunt for yield to continue as BUNDS only offer negative
yields and interest income will diminish
10Y BUND yield/ avg coupon
2.9 2.7 1.8 1.7 2.2 2.2
200 0.8 0.3 1.2
9% 0.1
~ €675bn 150 80
96
82
0,0 ~ €11bn
of maturing 100 60 70 66 60 of interest
8% 54 55 53 -5,0
BUNDS 50 shortfall
7%
2020-2029 0 -10,0 2020-2029
2020 2021 2022 2023 2024 2025 2026 2027 2028 2029
Amount maturing (€bn) Weighted average coupon (%)
6% ~1.8%
5% ~2.0%
4% ~1.0%
3%
~3.5%
2%
~4.0%
1%
0%
Current 10y Bund yield
(i.e. theoretical new coupon)
-1%
'00 '01 '02 '03 '04 '05 '06 '07 '08 '09 '10 '11 '12 '13 '14 '15 '16 '17 '18 '19 '20 '21 '22 '23 '24 '25 '26 '27 '28 '29
Source: Bloomberg. 10y German Bund yield 5 Periode
Moving gleit. Mittelw.
average (Bund
of last five Maturities
Bund (Coupon))
maturities (coupon)
26 I November 2020Outlook Well positioned in current environment Pure Play German residential 100% Focus on affordable housing €5.93 /sqm Attractive yields 4.8% GAV yield Strong financial profile ~40% LTV1 Growth opportunities ~€700m fire power 1 Pro forma LTV - taking the remaining ~6,400 units acquisition as well as the linked cash outflows into account. 27 I November 2020
Agenda

I.         HIGHLIGHTS 9M-2020

II.        PORTFOLIO AND OPERATING PERFORMANCE

III.       FINANCIAL PERFORMANCE

IV.        OUTLOOK

V.         APPENDIX

28 I   November 2020
Appendix
Key figures

Operating results                                                              9M-2020       9M-2019        %/bp
Net cold rent                                                          €m         464.5         439.8         5.6
Net rental and lease income                                            €m         365.7         340.2         7.5
EBITDA adjusted                                                        €m         360.2         330.5         9.0
FFO I                                                                  €m         296.7         259.1        14.5
FFO I per share                                                         €          4.25          4.09         3.9
FFO II                                                                 €m         295.5         255.9        15.5
EBITDA margin (adj.)                                                    %          77.5          75.1      240 bp
FFO I margin                                                            %          63.9          59.6      580 bp
Portfolio                                                                    30.09.2020    30.09.2019    +/- %/bp
Residential units                                                   number      138,601       133,806          3.6
In-place rent (l-f-l)                                                €/sqm         5.93          5.79          2.3
Capex                                                                   €m        202.7         136.5         48.5
Maintenance                                                             €m          60.1          58.4         2.9
EPRA vacancy rate (l-f-l)                                                %           3.1           3.6      -50 bp
Balance sheet                                                                30.09.2020    31.12.2019    +/- %/bp
Investment properties                                                  €m      13,222.2      12,031.1          9.9
Cash and cash equivalents                                              €m         848.8         451.2         88.1
Equity                                                                 €m       6,677.6       5,933.9         12.5
Total financing liabilities                                            €m       5,728.8       5,053.9         13.4
Current financing liabilities                                          €m         487.3         197.1        147.2
Net debt                                                               €m       4,850.5       4,570.8          6.1
LTV                                                                     %          36.4          37.7     -130 bp
LTV adjusted1                                                           %         ~40%
Equity ratio                                                            %          45.8          45.9      -10 bp
Adj. EPRA NAV, diluted                                                 €m       8,702.6       7,273.0        19.7
Adj. EPRA NAV per share, diluted                                        €        115.21        105.39         9.3
1     Taking the remaining ~6,400 units acquisition into account.

    29 I    November 2020
Appendix
EPRA-Net Asset Value
€m 30.09.2020 31.12.2019 €593.3m revaluation
€354.1m capital increase
Equity (excl. minority interests) 6,653.1 5,909.9 €257.0m dividend payment
(of which €84.6m in shares)
Effect of exercising options, convertibles and other rights 444.9 26.1
NAV 7,098.0 5,936.0
Including €418.8m positive
Fair value measurement of derivative financial instruments 120.2 84.0 equity effect from 2017/2025
convertible bond (“in the
Deferred taxes1 1,567.4 1,336.4 money”2) and €15.4m
negative equity accounting
EPRA-NAV 8,785.6 7,356.4
effect
Number of shares fully-diluted incl. convertible (m) 75,534 69.010
EPRA-NAV per share in € 116.31 106.60
Goodwill resulting from synergies 83.0 83.4
Adjusted EPRA-NAV (excl. goodwill) 8,702.6 7,273.0
Adjusted EPRA-NAV per share in € 115.21 105.39
Gross yield of 4.8% (thereof free financed portfolio: 5.0%) and value per sqm (€1,440)
still reflect decent gap to recent portfolio transactions
Value of services business not included in NAV
Scenario: additional value approx. €5.30 - €8.00 per share (FY 2019; discount rate of
4.0% - 6.0%)
1 And goodwill resulting from deferred taxes on EPRA-adjustments.
2 As of 30 September 2020 the share price of €121.80 is higher than the current conversion price (€116.34) of the 2017/2025 convertible bond. Therefore, the
effects in the NAV reconciliation are shown as dilutive (3,438,349 dilutive shares).
30 I November 2020Appendix
FFO calculation
€m 9M-2020 9M-2019
+€24.7m YOY/+5.6%
Net cold rent 464.5 439.8
Profit from operating expenses -1.2 -0.9
Growth in staff costs mainly
Maintenance (externally-procured services) -37.4 -36.9 due to increased tariff and
Staff costs -53.7 -48.8 additional FTE’s (operations
and craftsmen services)
Allowances on rent receivables -5.6 -5.8
Other 6.5 -0.3
Adj. NRI increased by
Non-recurring project costs (rental and lease) 3.2 2.9 +€26.3m YOY (+7.5%)
Recurring net rental and lease income 376.3 350.0
Recurring net income from other services 6.6 3.4 Staff costs impacted by one-
Staff costs -16.0 -24.4 time payments in 2019
Non-staff operating costs -13.6 -10.9
Non-recurring project costs (admin.) 6.9 12.0 Admin. cost slightly reduced
Recurring administrative expenses -22.7 -23.3
Other income and expenses 0.0 0.4
EBITDA increased by
Adjusted EBITDA 360.2 330.5
+€29.7m YOY (+9.0%)
Cash interest expenses and income -59.7 -58.4
Cash income taxes from rental and lease -2.0 -10.0 Nearly stable interest costs
FFO I (including non-controlling interests) 298.5 262.1 (average costs in Q3-2020:
1.35% vs. 1.64% in Q3-2019)
Non-controlling interests -1.8 -3.0
despite higher debt volume
FFO I (excluding non-controlling interests) 296.7 259.1
FFO II (including disposal of investment property) 295.5 255.9
Capex-adjusted FFO I (AFFO) 94.0 122.6
31 I November 2020Appendix
Balance sheet
€m 30.09.2020 31.12.2019
Investment property 13,222.2 12,031.1 Revaluation €593.3m
Acquisitions €431.5m
Other non-current assets 350.5 322.7 Capex, additions €203.5m
Non-current assets 13,572.7 12,353.8
Receivables and other assets 128.9 89.6
Cash flow from operating
Cash and cash equivalents 848.8 451.2 activities €240.5m
Investing activities
Current assets 977.7 540.8 -€607.9m
Financing activities
Assets held for sale 33.7 25.2 €765.0m
Issue of convertible bond
Total Assets 14,584.1 12,919.8 €544.0m
Capital increase
Equity 6,677.6 5,933.9 €269.6m
Borrowing of bank loans
Non-current financing liabilities 5,241.5 4,856.8 €258.4m
Repayment of loans
Other non-current liabilities 1,878.8 1,654.2 -€173.5m
Cash dividend
Non-current liabilities 7,120.3 6,511.0 -€172.4m
Current financing liabilities 487.3 197.1
Other current liabilities 298.9 277.8
Current liabilities 786.2 474.9
Total Equity and Liabilities 14,584.1 12,919.8
32 I November 2020Appendix
LTV
€m 30.09.2020 31.12.2019
Financial liabilities 5,728.8 5,053.9
Strong balance sheet with LTV of
36.4%
Excluding lease liabilities (IFRS 16) 29.5 31.8 Pro forma LTV (including payment
of acquisitions) of around 40%
Cash & cash equivalents 848.8 451.2
Net Debt 4,850.5 4,570.8
Investment properties 13,222.2 12,031.1
Properties held for sale 33.7 25.2
Prepayments for investment properties 69.7 53.5
Property values 13,325.6 12,109.8
Loan to Value (LTV) in % 36.4 37.7
Pro forma LTV in %1 ~40.0 37.7
1 Taking the remaining ~6,400 units acquisition into account.
33 I November 2020Appendix
Income statement
€m 9M-2020 9M-2019
Net rental and lease income 365.7 340.2 Higher rental income +€24.7m
YOY/+5.6%
Net income from the disposal of investment property -0.8 -0.8
Net income from the valuation of investment property 593.3 551.6
Net income from the disposal of real estate inventory -2.3 -2.0
Net income from other services 4.2 1.5
Administrative and other expenses -32.6 -38.0 Recurring admin. costs
reduced
Other income 0.1 0.4
Net income from fair value
Operating earnings 927.6 852.9 measurement of derivatives
-€43.7m (9M-2019: -€91.3m)
Slight increase of cash
Net finance costs -112.9 -182.0 interests (€59.7m; +€1.3m
YOY) due to rising debt volume
Earnings before income taxes 814.7 670.9
Cash taxes FFO I -€2.9m,
Income tax expenses -158.6 -182.0
cash taxes from disposals
-€0.9m
Consolidated net profit 656.1 488.9
34 I November 2020Appendix
Cash effective interest expense
€m 9M-2020 9M-2019
Reported interest expense 71.2 92.7
Interest expense related to loan amortisation -9.8 -29.5 Previous year: early
conversion of convertible
bond, early repayment of
Interest costs related to valuation of assets/liabilities -0.1 -0.6
subsidised loans and
refinancing
Interest expenses related to changes in pension provisions -0.9 -1.9
Other interest expenses -0.6 -2.1
Cash effective interest expense (gross) 59.8 58.6
Cash effective interest income 0.1 0.2
Interest coverage improved
further (6.0x up from 5.7x
Cash effective interest expense (net) 59.7 58.4 YOY)
35 I November 2020Appendix
Fischbach to become new contributor to our services
business as LWS Plus
Partner Partner Partner former
Cooperation Cooperation Joint venture (51%) 100% entity
Multimedia: TV, Electricity, heating, Small repair work, General contractor
internet and telephone gas, metering craftsmen services services
Launch January 2014 Launch March 2015 Launch January 2017 Acquisition Oct 2020
36 I November 2020Appendix
Group P&L effect of LWS Plus
€m 2019 Annual effect 2021
Net cold rent 586.1
Profit from operating expenses -2.8 Lower staff costs
Maintenance (externally-procured services) -61.0 from internalization/
Staff costs -68.2 - €5-6m capitalization of costs
Allowances on rent receivables -7.9
Other -1.3
Non-recurring project costs (rental and lease) 8.3
Recurring net rental and lease income 453.2 + €5-6m Improved income
Recurring net income from other services 6.0
Staff costs -30.1
Non-staff operating costs -32.6
Non-recurring project costs (admin.) 29.5
Recurring administrative expenses -33.2
Other income and expenses 0.5 Improved EBITDA /
Adjusted EBITDA 426.5 + €5-6m EBITDA-Margin + ~100bps
Cash interest expenses and income -78.7
Cash income taxes from rental and lease -2.8
FFO I (including non-controlling interests) 345.0 + €4-5m Cash tax effect of ~€1m
Non-controlling interests -3.7
FFO I (excluding non-controlling interests) 341.3 + €4-5m Improved FFO
37 I November 2020Appendix
Portfolio overview
North Rhine-Westphalia Flensburg
Outside North Rhine-Westphalia1
(~132,700 units / ~92%) ~1,100 (~12,000 units / ~8%)
8%
Oldenburg
Bremen
~1,400 ~1,400
Hanover/Laatzen
Osnabrück ~1,400 3%
~700
1%
Brunswick
North Rhine- ~1,500
Westphalia 2018 2019 Pro-
~132,700 forma YTD
Koblenz
~2,000
Growth along our investment criteria
Asset class affordable living
Rhine-Neckar area
~2,100 Entry via orange and green markets
High-Growth
Stable
>1,000 units per location
Higher-Yielding
Acquisitions June 2020
1 Including ~7,500 units acquired in June 2020.
38 I November 2020Appendix
Portfolio transactions: Based on date of transfer of
ownership1,2
Change 6,082 144,6833
Diagrammtitel
Total # of units on the reporting date
1,076 138,601
1,308
2,186
133,969 57 112 225 134,031
-332
31.12.2018 Q1 2019 Q2 2019 Q3 2019 Q4 2019 31.12.2019 Q1 2020 Q2 2020 Q3 2020 30.09.2020 Q4 2020 31.12.2020
Acquisitions 0 146 181 3,205 3,532 2,361 1,509 1,122 4,992 6,380 11,372
Locations / State 4 NRW NRW NRW NRW NRW NRW NRW
Bremen (HB) Kaiserslautern Flensburg (SH) Brunswick (LS)
Godingen (LS) (RP) Hanover (LS)
Hanover (LS) Koblenz (RP)
Oldenburg (LS) Rhine-Neckar
Salzgitter (LS) (RP/BW)
Divestments 332 89 69 2,980 3,470 175 201 46 422 298 720
Change -332 57 112 225 62 2,186 1,308 1,076 4,570 6,082 10,652
1 Residential units.
2 Note: The date of the transaction announcement and the transfer of ownership are usually several months apart. The number of units may therefore differ from other disclosures, depending on the data basis.
3 Pro-forma number of residential units including ~7,500 units acquired in June 2020, total transfer of ownership expected for Q4 2020. Subject to change should additional acquisitions and/or disposals occur.
4 BW = Baden-Wurttemberg, HB = Bremen, LS = Lower Saxony, NRW = North Rhine-Westphalia, RP = Rhineland-Palatinate, SH = Schleswig-Holstein.
39 I November 2020Appendix
Refinancing of subsidised loans lifting value
Rent potential subsidised units Number of units1 coming off restriction and rent upside
# Units
16,725
Until 2028, around 25,000 units1 will 479 10,429
2,567 267
come off rent restriction
1,311 1,167
1,118
Units show significant upside to 755 749 901 105
252 365
market rents 625 209
185
2020 2021 2022 2023 2024 2025 2026 2027 2028 2029 2030ff.
The economic upside can Units coming off restriction Most recently acquired units (06/2020) coming off restriction
theoretically be realised the year
after restrictions expire, subject to Spread to market rent
general legal and other restrictions5 (in €/sqm/month)
3.69
Around 70% of units1 to come off restriction until 2028
2.20 2.34
1.78 1.89 1.97 1.79
1.68
1.09 0.84 1.07
>10 years
28.5% ≤ 5 years
16.6%
2020 2021 2022 2023 2024 2025 2026 2027 2028 2029 2030 ff.
≤ 5 years3 6 – 10 years3 > 10 years3
In-place rent €4.73 €5.00 €4.90
Market rent2 €6.53 €6.74 €5.97
6-10 years
Upside potential4 38% 35% 22%
54.6% Upside potential p.a.4 €9.0m €24.9m €9.0m
1 Pro forma number of units including ~7,500 units acquired in June 2020; total transfer of ownership expected for Q4 2020.
2 Employed by CBRE as indicator of an average rent value that could theoretically be achieved, not implying that an adjustment of the in-place rent to the market rent is feasible, as stringent legal and
contractual restrictions regarding rent increases exist.
3 ≤5 years = 2020-2024; 6-10 years = 2025-2029; >10 years = 2030ff.
4 Rent upside is defined as the difference between LEG in-place rent and market rent (defined in footnote 2).
5 For example rent increase cap of 15% or 20% for three years.
40 I November 2020Appendix
LEG additional creditor information
Unsecured financing covenants Financing mix
Covenant Threshold 30.09.2020
Variable interest Fixed interest
Consolidated Adjusted EBITDA / 7.4% 82.6%
Net Cash Interest
≥1.8x 5.7x
Unencumbered Assets / Derivatives
Unsecured Financial Indebtedness
≥125% 237%
10.0%
Net Financial Indebtedness /
Total Assets
≤60% 34%
Secured Financial Indebtedness /
Total Assets
≤45% 21%
Ratings (Moody’s) Key financial ratios
Type Rating Outlook 30.09.2020 30.09.2019
Long Term Rating Baa1 Stable Net debt / EBITDA 10.6x 9.8x
Short Term Rating P-2 Stable LTV 36.4% 36.3%
41 I November 2020Appendix
Capital market financing
Corporate bonds
2017/2024 2019/2027 2019/2034
Issue Size €500m €500m €300m
Term / 7 years / 8 years / 15 years /
Maturity Date 23 January 2024 28 November 2027 28 November 2034
Coupon 1.250 % p.a. 0.875 % p.a. 1.625 % p.a.
(annual payment) (annual payment) (annual payment)
Issue Price 99.409 % 99.356 % 98.649 %
Financial Covenants • Net financial debt/ total assets ≤ 60%
• Secured financial debt/ total assets ≤ 45%
• Unencumbered assets/ unsecured financial debt ≥ 125%
• Adj. EBITDA/ net cash interest ≥ 1.8 x
ISIN XS1554456613 DE000A254P51 DE000A254P69
WKN A2E4W8 A254P5 A254P6
42 I November 2020Appendix
Capital market financing
Convertible bonds
2017/2025 2020/2028
Issue Size €400m €550m
Term/ 8 years/ 8 years/
Maturity Date 1 September 2025 30 June 2028
Coupon 0.875% p.a. 0.4% p.a.
(semi-annual payment: (semi-annual payment:
1 March, 1 September) 15 January, 15 July)
# of shares 3,438,349 3,546,869
Initial €118.4692 €155.2500
Conversion Price
Adjusted €116.3349 €155.0663
Conversion Price (as of 4 September 2020) (as of 7 September 2020)
Issuer Call From 22 September 2022, From 5 August 2025,
if LEG share price >130% if LEG share price >130%
of the then applicable conversion price of the then applicable conversion price
ISIN DE000A2GSDH2 DE000A289T23
WKN A2GSDH A289T2
43 I November 2020Appendix
LEG share information
Basic data Shareholder structure1
Market segment: Prime Standard
Stock Exchange: Frankfurt Other free float MFS
Total no. of shares: 72,095,943 (16.09.2020) 73.7% 10.5%
Ticker symbol: LEG
ISIN: DE000LEG1110 BlackRock
Indices: MDAX, FTSE EPRA/NAREIT, GPR 250,
9.5%
Stoxx Europe 600, DAX 50 ESG, i.a. MSCI
Europe ex UK, MSCI World ex USA, BNP Paribas AM
MSCI World Custom ESG Climate Series 3.2%
Weighting: MDAX 3.42% (30.09.2020)
EPRA 3.81% (30.09.2020) Flossbach von Storch
3.1%
Share (30.10.2020; indexed; in %; 01.02.2013 = 100)
300
200
100
0
Jan-13 Jan-14 Jan-15 Jan-16 Jan-17 Jan-18 Jan-19 Jan-20
LEG EPRA Germany MDAX Euro Stoxx 600
1 Shareholdings according to voting rights notifications; as of 04.11.2020.
44 I November 2020Appendix
Sustainable increase in share price and market
capitalisation since IPO
IPO (02/2013) CI (10/2014) CI (06/2015) CI (11/2015) CIK (05/2016) CB (10/2019) CI (06/2020) SD (09/2020) 09/2020
53.0m shares +4.1m shares +1.2m shares +4.5m shares +0.4m shares +5.8m shares +2.4m shares +0.7m shares 72.1m shares
10000 140
30.10.2020
9000 €124.94
120
8000 +164%
7000 100
6000
01.02.2013 80
30.10.2020
5000 €44.00
€8.4bn
60
4000
3000 40
+259%
2000
01.02.2013 20
1000 €2.3bn
0 0
Jan-13 Jan-14 Jan-15 Jan-16 Jan-17 Jan-18 Jan-19 Jan-20
Market capitalization (in €m) Closing price (in €)
IPO = Initial Public Offering; CI = capital increase; CIK = capital increase in kind; CB = convertible bond; SD = stock dividend
45 I November 2020Appendix
Financial calendar
Date Report/Event Venue/Note
2020
12.11.2020 Quarterly Statement Q3 as of 30 September 2020 Release
24.11.2020 Roadshow, Deutsche Bank Virtual
26.11.2020 Real Estate Paris Seminar, Berenberg Virtual
01. - 02.12.2020 Global Real Estate Conference, UBS Virtual
02.12.2020 Convertible Bond Conference, Unicredit Virtual
04.12.2020 Roadshow Scandinavia, Berenberg Virtual
07.12.2020 Roadshow Canada, Credit Suisse Virtual
09.12.2020 Real Estate Conference, HSBC Virtual
2021
10.03.2021 Annual Report 2020 Release
11.05.2021 Quarterly Statement Q1 as of 31 March 2021 Release
10.08.2021 Quarterly Report Q2 as of 30 June 2021 Release
10.11.2021 Quarterly Statement Q3 as of 30 September 2021 Release
46 I November 2020Appendix
Investor Relations Contact
Frank Kopfinger, CFA Elke Franzmeier
Head of Investor Relations & Strategy Assistant Investor Relations & Strategy
Tel: +49 (0) 211 4568-550 Tel: +49 (0) 211 4568-159
E-Mail: frank.kopfinger@leg.ag E-Mail: elke.franzmeier@leg.ag
Karin Widenmann Julia Pschribülla
Senior Manager Investor Relations Senior Manager Investor Relations
Tel: +49 (0) 211 4568-458 Tel: +49 (0) 211 4568-286
E-Mail: karin.widenmann@leg.ag E-Mail: julia.pschribuella@leg.ag
LEG Immobilien AG ǀ Hans-Boeckler-Str. 38 ǀ 40476 Düsseldorf, Germany
Phone: +49 (0) 211 4568-400 ǀ Fax: +49 (0) 211 4568-22 204 ǀ E-Mail: ir@leg.ag ǀ Internet: www.leg.ag
47 I November 2020You can also read