A Simple Synthesis of Porous Titanium Dioxide Nanofibres with a Large Specific Surface Area by Electrospinning as High-Performance Anode ...
←
→
Page content transcription
If your browser does not render page correctly, please read the page content below
Int. J. Electrochem. Sci., 16 (2021) Article ID: 210420, doi: 10.20964/2021.04.55

 International Journal of
 ELECTROCHEMICAL
 SCIENCE
 www.electrochemsci.org

A Simple Synthesis of Porous Titanium Dioxide Nanofibres with
a Large Specific Surface Area by Electrospinning as High-
Performance Anode Materials for Lithium-Ion Batteries
Manman Xia, Jun Li*, Ruyan Lei, Baige Yuan, Ying Zhang, Peng Zhao and Xiao Li

School of Materials Engineering, Shanghai University of Engineering Science, Shanghai 201620,
China
*
 E-mail: jacob_lijun@sues.edu.cn

Received: 18 December 2020 / Accepted: 29 January 2021 / Published: 28 February 2021

Anatase titanium dioxide is considered a promising anode material for lithium-ion batteries (LIBs),
however its application is restricted due to the poor Li+ transport. Nano-crystallization and pore
creation are regarded as two effective strategies for solving the above shortcomings. This study aims to
realize the combination of the two strategies by synthesizing porous anatase TiO2 nanofibres by
electrospinning with camphene as the pore-creating agent. Porous anatase TiO2 nanofibres as anode
materials for LIBs demonstrated excellent electrochemical performance when a suitable content of
camphene was added. The results indicated that a larger specific surface area (72 m2·g-1) was obtained
in anatase TiO2 nanofibres with 12 wt.% camphene than in those without camphene (61 m2·g-1). The
former exhibited a higher initial discharge specific capacity (518.71/294.99 mAh·g-1) than the latter
(305.56/114.68 mAh·g-1). Moreover, the former demonstrated outstanding cycle performance due to
the higher retention rate of 21.7% obtained after 100 cycles. Meanwhile, an excellent rate performance
was also achieved due to a larger average discharging specific capacity (58.96 mAh·g-1) being when
the current density increased from 0.5 C to 10 C and recovered to 0.5 C (145.71 mAh·g-1). The
improvement in electrochemical performance should be attributed to the low charge transfer resistance
(Rct) and large transportation rate of Li+ resulting from the obtained high specific surface area.

Keywords: Electrospinning, porous anatase titanium dioxide, Camphene, Lithium-ion battery anode

1. INTRODUCTION

 Lithium-ion batteries (LIBs) have attracted wide attention due to their light weight, small size,
good safety, high working voltage, high energy density, and long service life. Anode materials are
considered an essential factor responsible for their service performance[1-5]. Graphite, as a traditional
commercial anode material is applied to LIBs; however, its electrochemical performance is seriously
restricted due to its low theoretical capacity (372 mAh·g-1), abundant reactions, poor structural
Int. J. Electrochem. Sci., 16 (2021) Article ID: 210420 2

stability, and low charge-discharge platform[6-8]. Titanium dioxide (TiO2) is regarded as a very
promising anode material for LIBs owing to its low cost, good safety, small volume expansion (4%)
and high potential of discharge-charge platforms (1.5-1.8 V (vs. Li/Li+)). However, the low lithium ion
diffusion rate and poor electronic conductivity limit its practical application[9-11].
 Nano-crystallization and pore creation have been regarded as two effective strategies for
solving the above shortcomings. TiO2 with nanostructures (nanofibres, nanotubes, nanorods,
nanoparticles, etc.) was fabricated to improve its electrochemical performance. R. Qing et al.[12]
prepared TiO2 nanofibres by electrospinning followed by calcining in air or a flowing argon
atmosphere. The electrode made of TiO2 subjected to calcination in an argon atmosphere exhibited a
discharging specific capacity of 250 mAh·g-1 at 10 C, which was increased by 27% compared with that
of the air-calcined TiO2 electrode. O. Fasakin et al.[13] synthesized anatase TiO2 nanotubes via
hydrothermal treatment. The TiO2 electrode demonstrated a discharge specific capacity of 142 mAh·g-
1
 at 36 mA·g-1 after 100 cycles, which was superior to that obtained in the pristine material (38 mAh·g-
1
 at 36 mA·g-1 after 100 cycles). Y. Liu et al.[14] prepared rutile/anatase TiO2 nanorods via a
hydrothermal method. The electrode exhibited a higher retained discharge specific capacity of 102.7
mAh·g-1 after 1000 cycles at 10 C, which was higher than that of pure rutile/anatase TiO 2 (45.8
mAh·g-1 at 10 C after 1000 cycles). H. Liu et al.[15] prepared TiO2 (n)-T (n and T are the
hydrothermal reaction time and calcination temperature) nanoparticles by a template method. The TiO2
(48)-550 sample showed a superior rate performance of 165 mAh·g-1 at 10 C and 116 mAh·g-1 at 60 C.
Moreover, there are many investigations into porous TiO2 to improve the electrochemical performance
of TiO2 electrodes. W. Wu et al.[16] successfully synthesized mesoporous TiO2 (MT) by a
hydrothermal method with a template (a nonionic copolymer template, a cationic template, or an
anionic template) approach, and investigated the effect of template type and addition amount on the
electrochemical performance of MT. The results indicated that the MT-3F (F refers to the template
type) sample had a high discharge specific capacity of approximately 131.2 mAh·g-1 at 1 C after 1000
cycles. S.I. Choi et al.[17] prepared lotus-root shaped meso-/macroporous TiO2 (LR-TiO2) through
calcination at different temperatures. LR-TiO2 calcined at 450 °C with the highest anatase ratio and
largest specific surface area showed the best discharge specific capacity of 120 mAh·g-1 after the first
cycle and the highest retention rate of 74% after 100 cycles. All these studies proved that nano-
crystallization and pore creation endowed TiO2 with a larger specific surface area and more active
sites, further improving its electrochemical performance.
 In this work, nano-crystallization and pore creation were combined to successfully synthesize
porous A-TiO2 nanofibres via simple electrospinning followed by calcining with camphene as the
pore-creating agent. The morphology of TiO2 nanofibres was changed by adding different loading
amounts of camphene, and the morphological structures of TiO2 nanofibres were characterized by
field-emission scanning electron microscopy (FESEM), transmission electron microscopy (TEM) and
N2 adsorption–desorption patterns. The electrochemical performances of TiO2 nanofibres used as
electrode materials in lithium-ion batteries were determined by cyclic voltammetry, and galvanostatic
charge-discharge tests. Hence, this work provides a simple synthesis of porous anatase TiO2 nanofibres
with promising high-performance for use as anode materials in LIBs.

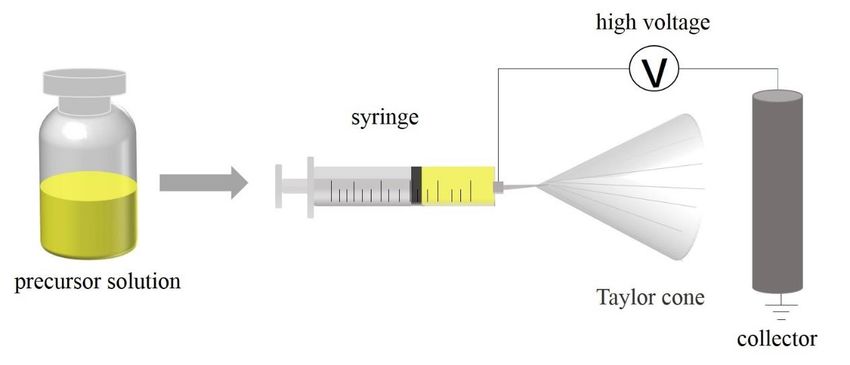
Int. J. Electrochem. Sci., 16 (2021) Article ID: 210420 3

2. EXPERIMENTAL PART

2.1 Preparation of porous anatase TiO2 nanofibres

 Porous anatase TiO2 nanofibres were prepared by electrospinning and subsequent heat
treatment. First, the precursor solution was prepared by adding 2 mL tetra-n-butyl titanate (TBOT,
99%, Sinopharm Chemical Reagent Co., Ltd., Shanghai, China), 2 mL acetic acid (99.5%, Sinopharm
Chemical Reagent Co., Ltd., Shanghai, China), 0.3 g polyvinylpyrrolidone (PVP, MW: 1300000
g·mol-1, Aladdin Industrial Corporation, Shanghai, China) and different contents of camphene (95%,
Aladdin Industrial Corporation, Shanghai, China) to 6 mL absolute ethyl alcohol (99.7%, Sinopharm
Chemical Reagent Co., Ltd., Shanghai, China) with stirring overnight. The relative mass percent of
camphene in the solution was regulated to be 0 wt.%, 8 wt.%, 12 wt.%, and 16 wt.%, and the finally
obtained TiO2 nanofibres were named PT-1, PT-2, PT-3 and PT-4, respectively. Next, the prepared
precursor solution was put in a 20 mL plastic syringe with a 23-gague stainless-steel nozzle. The
applied voltage between the drum and the syringe tip was 8 kV, and the distance between them was
maintained at 15 cm. The rotation speed of the drum was kept at 50 rpm, and the flow rate was 0.01
mL·h-1. The filaments sprayed from the solution were collected on a drum collector covered with
aluminium foil. The obtained as-spun nanofibres were stabilized at 150 °C for 24 h and then heat-
treated at 400 °C, 500 °C and 600 °C for 3 h in air.

 Figure 1. Schematic diagram of electrospinning apparatus.

2.2. Electrochemical measurements of the coin cells

 To prepare the anodes, the active materials, carbon black, and polyvinylidene fluoride (PVDF)
with a mass ratio of 8:1:1 were stirred in a ball mill for three minutes, and then N-methyl-2-
pyrrolidone (NMP) was added to form a uniform slurry. The slurry was coated on a copper foil with a
coating machine. The coated copper foil was moved into a vacuum oven, dried at 60 °C for 12 h, and
then punched into a 12 mm diameter electrode sheet with a punching tool. Pure lithium foil was used
as the counter electrode. A solution composed of 1 M lithium hexafluorophosphate (LiPF6), ethylene
Int. J. Electrochem. Sci., 16 (2021) Article ID: 210420 4

carbonate (EC) and diethyl carbonate (DEC) was used as the electrolyte. The coin cells were
assembled in a glove box full of argon (Super 1220/750/900, Shanghai Mikrouna Electromechanical
Technology Co., Ltd, Shanghai, China).
 Galvanostatic charge-discharge tests were carried out using an electrochemical workstation (CT
4008, Neware Electronics Co., Ltd, Shenzhen, China) with a potential window of 0.05 to 3.0 V (vs.
Li/Li+) at a current density of 0.5 C for 100 cycles (1C=168 mAh·g-1). The rate performance was
evaluated at different current densities of 0.5 C, 1 C, 2 C, 5 C and 10 C. Cyclic voltammetry (CV) tests
were performed on an electrochemical workstation (CHI 760E, CH Instruments Ins, Shanghai, China)
with a potential window of 0-3.0 V (vs. Li/Li+) at 0.1 mV·s-1. Electrochemical impedance spectroscopy
(EIS) was performed with an electrochemical workstation (Autolab-PGSTAT302N, Metrohm, Herisau,
The Netherlands) at room temperature with a perturbation amplitude of 5 mV applied over a frequency
window from 0.1 MHz to 0.01 Hz to probe the kinetic properties of the materials.

2.3. Materials characterizations

 The phase constituents of the samples were identified by utilizing X-ray diffraction (XRD, D2-
PHASER, Bruker, Karlsruhe, Germany) with Cu Kα radiation(γ=0.1540560 nm). The morphologies
and structures of the samples were analysed by a field-emission scanning electron microscopy
(FESEM, S-4800, HITACHI, Tokyo, Japan) and a transmission electron microscopy (TEM, JEM-
2100F, JOEL, Tokyo, Japan) coupled with energy dispersive spectroscopy (EDS, X-MAX 65T,
OXFORD, England, UK). The specific surface area was measured by obtaining Brunauer Emmett
Teller nitrogen adsorption-desorption isotherms (JW-BK200B, Beijing JWGB Sci&Tech Co., Ltd.,
Beijing, China) at 77 K.

3. RESULTS AND DISCUSSION

3.1 Characterization of nanofibres

 Fig.1 shows the XRD patterns of the PT-2 nanofibres subjected to heat treatment at different
temperatures (400 °C, 500 °C, and 600 °C). By comparing the d values with standard values from
JCPDS cards, the nanofibres treated at 400 °C can be identified as single anatase TiO2 (JCPDS, No.
00-021-1272)[18]. However, two weak peaks at 27.4° and 35.9° appear when the temperature is
elevated to 500 °C, which confirms the formation of rutile TiO2. The relative content of rutile TiO2
further increased with increasing temperature to 600 °C because the three peaks related to rutile TiO2
were observed. Two characteristic peaks associated with anatase (101) and rutile (110) can be applied
to calculate their relative contents (90% and 85% anatase TiO2 at 500 °C and 600 °C, respectively)
according to the following Spurr-Myers formula[19]:
 100
 = (1)

 (1 + 1.265 )
Int. J. Electrochem. Sci., 16 (2021) Article ID: 210420 5

 Where XA denotes the mass percent of anatase TiO2, IA and IR refer to the intensities of the
(101) peak related to anatase TiO2 and the (110) peak related to rutile TiO2, respectively.

 Figure 2. XRD patterns of the PT-2 nanofibers treated at different temperatures.

 The results indicate that elevated temperature can promote the transformation from metastable
anatase TiO2 to stable rutile TiO2. Such a transformation will further have a significant effect on the
electrochemical performance of nanofibres due to their difference in crystal structure. Compared with
rutile TiO2, more defects and vacancies are involved in the lattice structure of anatase TiO2, which
allows the latter to trap more electrons. Moreover, anatase TiO2 can provide wide bidirectional
channels or the insertion/extraction of Li+ unlike rutile TiO2 with a narrow channel 4 nm in radius, so
anatase TiO2 has a the higher lithium intercalation capacity than rutile TiO2 [20,21]. The samples
subjected to heat treatment at 400 °C will be selected for subsequent studies to achieve more anatase
TiO2 with better activity recovery.
Int. J. Electrochem. Sci., 16 (2021) Article ID: 210420 6

 Figure 3. The SEM images of (a) PT-1, (b) PT-2, (c) PT-3 and (d) PT-4.
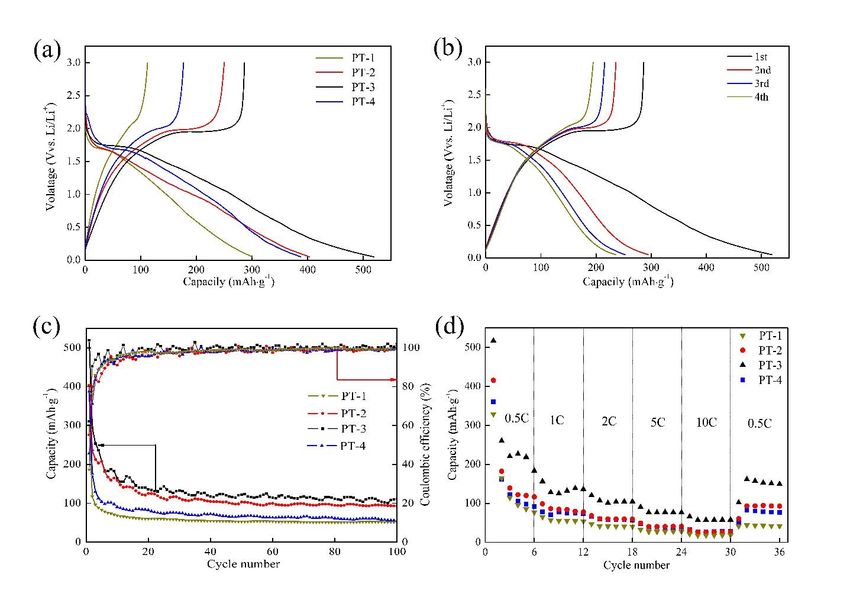
Int. J. Electrochem. Sci., 16 (2021) Article ID: 210420 7

 Figure 4. Changes in nanofiber morphology with different camphene.

 FESEM testing was performed to investigate the evolution in morphology with varying the
content of camphene (shown in Fig. 3). The morphology is closely related to the content of camphene.
The camphene free nanofibres are uniform and approximately 200 nm in diameter, and their surfaces
are very smooth (Fig. 3(a)). A high-magnification image reveals that the nanofibres are mainly
composed of numerous tightly connected particles (Fig. 3(b)). There are almost no changes in the
diameter of nanofibres when the camphene content is increased to 8 wt.% (Figs. 3(c) and (d));
however, their surfaces and cross-sections become rougher. The roughness of the nanofibres with 12
wt.% camphene is further increased, so that many wrinkled patterns are formed on their surfaces. Two
other changes are also observed, corresponding to the formation of some pores and the reduction in the
diameter of nanofibres (approximately 150 nm). Moreover, the addition of more camphene (16 wt.%)
results in a further reduction in diameter (to approximately 120 nm); however, the nanofibres again
become smooth and dense, coupled with the disappearance of pores. The change in morphology with
changing the content of camphene can be clearly demonstrated by the schematic diagram (Fig. 4).
When the nanofibres with camphene undergo heat treatment, the camphene will be thermally
decomposed from nanofibres, which may result in the formation of some pores. A low content of
camphene (lower than 8 wt.%) hardly has an obvious effect on the morphology of nanofibres.
However, the pores are gradually clearly observed when the content of camphene reaches 12 wt.%, at
which the point structure of nanofibres cannot be stably maintained and collapses. The nanofibres are
correspondingly shrunken and deformed, causing a reduction in the diameter and the formation of a
wrinkled pattern on their surfaces. Nevertheless, their collapse will become more serious in the
nanofibres with 16 wt.% camphene due to the presence of more pores, which results in the
disappearance of pores and structural reconstruction during subsequent heating. Consequently, the
nanofibres become finer, and their structure becomes denser. The above results imply that the suitable
content of camphene (12 wt.%) will contribute to the improvement in the electrochemical performance
of TiO2 nanofibres due to the increase in specific surface area.
Int. J. Electrochem. Sci., 16 (2021) Article ID: 210420 8

 Figure 5. (a) TEM images of PT-3, and (b-c) HRTEM images, and (d) SAED patterns.

 Transmission electron microscopy images of titanium dioxide nanofibres with a load of 12
wt.% camphene are shown in Fig. 5. TEM images provide detailed information on the nanostructure of
titanium dioxide. Fig. 5(a) shows that the diameter of the fiber is approximately 150 nm, which as
agrees with the SEM result. Many bright spots can be observed in nanofibres (Fig. 5(b)), which are
supposed to be fine pores caused by camphene acting as a pore marker. In an HRTEM image (Fig.
5(c)), the orderly lattice fringes with a spacing of approximately 0.347 nm can be assigned to the (101)
plane of anatase TiO2. The selected electron diffraction (SAED) diagram (Fig. 5(d)) obtained from a
fibre shows many concentric diffraction rings, which correspond well with the planes of anatase TiO2
(JCPDS, No. 00-021-1272). This is consistent with the XRD results, which clarifies its high
crystallinity; comparing the SEM and XRD; results shows that camphene only has a morphological
structure, but the crystal structure is not affected.
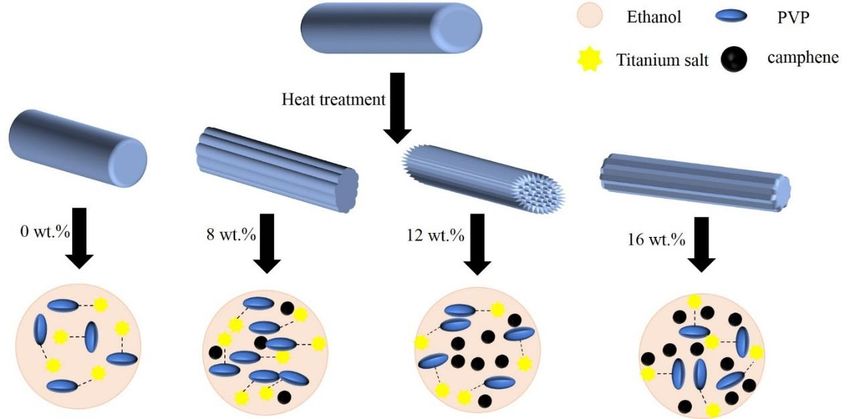
Int. J. Electrochem. Sci., 16 (2021) Article ID: 210420 9

 Figure 6. N2 adsorption-desorption isotherms of PT-1 and PT-3.

 The N2 physical adsorption-desorption isotherm and BJH pore-size distribution (inner figure)
are shown in Fig. 6. Two samples without camphene and with 12 wt.% camphene exhibit type IV
patterns with an H3 hysteresis loop in terms of the Brunauer, Deming, Deming, and Tellers (BDDT)
classification, which is associated with a large number of fine pores resulting from the aggregation of
particles. The pore diameter distributions are similar, with a range from 2 nm to 10 nm. However, the
average pore diameter is slightly reduced from 6.64 nm to 5.79 nm after introducing 12 wt.%
camphene. Moreover, the specific surface area of nanofibres is increased by approximately 14.3%,
which is in accordance with the SEM and TEM results.

3.2 Electrochemical performance

Figure 7. (a) The CV curve of all samples for the 1st cycle and (b) Nyquist plot and equivalent circuit
 of the sample for EIS.
Int. J. Electrochem. Sci., 16 (2021) Article ID: 210420 10

 Fig. 7(a) shows the cyclic voltammetry (CV) curve obtained at a scan rate of 0.1 mV·s-1. With
respect to all samples, a very strong reduction peak can be clearly observed at 1.625 V (vs. Li/Li +)
during the cathodic scan, accompanied by a corresponding oxidation peak at 2.055 V (vs. Li/Li+)
during the anodic scan. The redox peak is closely related to the insertion and extraction of lithium in
the anatase lattice, which can be described as follows[22,23]:
 2 + + + −1 ⟷ 2 (0 < < 1) (2)
 where x is the lithium insertion coefficient of TiO2 (the theoretical capacity of anatase is 168
mAh·g , so the maximum value is 0.5).
 -1

Figure 8. (a) The galvanostatic charge-discharge curve of all samples for the 1st and (b) PT-3 for the
 1st, 2nd, 3rd and 4th. (c) Cycle performances of all samples at 0.5 C. (d) Rate performances of
 all samples at 0.5-10 C.

 In addition to the basic characteristic reversible redox peaks, a weak reduction peak can be
detected at approximately 1.45 V, and no corresponding oxidation peak appears in the reverse scan,
which may be attributed to an irreversible Li+ insertion reaction occurring beyond the
tetragonal/orthorhombic phase boundary[24]. The peak currents present a regular change with
changing the content of camphene, namely, they first increased and then reduced. The highest peak
currents are recorded for the PT-3 sample. This phenomenon should be associated with the change in
the specific surface area of the samples. As mentioned above, the largest specific area was obtained for
the PT-3 sample, which will provide more active sites for Li+ insertion/extraction and greatly shorten
the diffusion path of Li+. Moreover, a large number of fine pores in the sample will offer considerable
Int. J. Electrochem. Sci., 16 (2021) Article ID: 210420 11

tunnels to accelerate the diffusion of Li+ into the interior of the sample. The synergistic effect resulting
from the above factors causes more drastic Li+ insertion/extraction reactions. The EIS results provide
strong evidence of this. As shown in Fig. 7(b), Nyquist plots can be divided into two regions, the high-
frequency region (a semicircle) and the low-frequency region (a straight line). The equivalent circuit
model was simulated based on the Nyquist plots (the inset in Fig. 7(b)). Rs is the ohmic resistance in
the electrolyte, which can be assessed by the intercept of the semicircle and the real (Z') axis. The
value hardly changed (approximately 3 Ω) among the four samples. Rct represents the interfacial
charge transfer resistance, which is associated with the diameter of the semicircle. It is clear that the
PT-3 sample has the lowest value (50.8 Ω) because it exhibits the smallest semicircle diameter among
all the samples, followed by PT-2 (124.6 Ω), PT-1 (158.4 Ω) and PT-4 (162.2 Ω). ZW is the impedance
element that is related to the linear slope; PT-3 has a steeper slope than the other samples. The changes
in Rct and Zw are mainly connected with the specific surface area[25-27]. A larger specific surface area
will offer more active sites for lithium insertion and extraction and shorten the transportation path of
Li+.
 Fig. 8(a) shows the galvanostatic charge-discharge curve of the first circle with a cut-off
voltage of 0.05-3 V (vs. Li/Li+) at a current density of 0.5 C. All samples demonstrate two clear
discharging/charging platforms at 1.625 and 2.055 V, corresponding to the insertion/extraction of
lithium ions in the A-TiO2 lattices[28-30]. This is consistent with the results obtained in the CV tests.
The discharge specific capacity, charge specific capacity and coulombic efficiency of PT-3 can be
calculated to be 518.71 mAh·g-1, 294.99 mAh·g-1 and approximately 62.1%, which are higher than
those of the other samples (PT-1: 305.56 mAh·g-1, 114.68 mAh·g-1 and 37.4%; PT-2 :402.87 mAh·g-1,
250.06 mAh·g-1 and 55.2%; PT-4: 387.77 mAh·g-1, 176.99 mAh·g-1 and 45.7%, respectively). The
reason for the low initial coulombic efficiency is the irreversible loss of Li+, and the loss of partial Li+
is mainly attributed to the formation of the solid electrolyte interface (SEI) layer by the reaction
between the electrolyte and the negative electrode material on the solid-liquid interlayer during the
first discharge cycle. Although the SEI layer will cause irreversible capacity loss, the stable SEI layer
will facilitate the decomposition of the electrolyte and prevent the formation of lithium
dendrites[31,32]. Fig. 8(b) demonstrates the charge-discharge curves obtained during the initial four
cycles. The charge-discharge curves gradually tend to overlap with each other, implying that the
electrode possesses good cycling stability. Moreover, the coulombic efficiency is also gradually
increases from 62.1% (first circle) to 96.7% (fourth circle), which indicates that the electrode has
excellent reversibility.
 Fig. 8(c) shows the cycle performance of all samples subjected to 100 cycles at a current
density of 0.5 C. PT-3 demonstrates the best cycling stability due to its higher retained discharging
specific capacity of 110.11 mAh·g-1 after 100 cycles, followed by PT-2 (92.96 mAh·g-1,), PT-4 (54.64
mAh·g-1) and PT-1 (51.44 mAh·g-1). PT-3 also exhibits a high retention rate of 21.47%, which is
similar to that of PT-2 (23%), and which is superior to that of PT-4 (14.1%) and PT-1 (17.1%). All
samples possess an extremely high coulombic efficiency of nearly 100%, indicating their excellent
reversibility. The decay in discharge specific capacity is mainly associated with the structural change
and mass loss of the active substance suffering from long-term cycling. For the given four samples, the
mass loss may be responsible for the change in cycling stability because they possess the same phase
Int. J. Electrochem. Sci., 16 (2021) Article ID: 210420 12

constituents. For compact PT-1 with fewer pores, its volume variation resulting from discharging and
charging will be severely constrained, causing a portion of active substances to undergo the fatigue
failure and exfoliate from the electrode with an increase in the number of cycles [33,34]. Consequently,
the discharge specific capacity is drastically reduced. When a suitable content of camphene was
introduced into TiO2, a large number of fine pores formed on the nanofibres or in their interor. The
pores will accommodate the volume change of active substances during charge-discharge, implying
that less active substances are lost due to their good structural integrity. This will result in the excellent
cycling stability of PT-3.
 Fig. 8(d) shows the rate performance of all samples at different current densities (0.5 C to 10
C). The average discharge specific capacity of the TiO2 electrode without camphene is sharply reduced
from 114.2 mAh·g-1 to 19.6 mAh·g-1 as the current density from 0.5 C to 10 C with a very low
retention rate of approximately 17.1%. When the current density is recovered to 0.5 C, only 37.1% of
the initial value is retained. It is clear that the introduction of camphene into TiO 2 can significantly
improve the rate performance of the TiO2 electrode. When a suitable content of camphene (12 wt.%) is
introduced, a high average discharge specific capacity of 145.71 mAh·g-1 is maintained when the
current density is increased to 10 C with a retention of rate 21.6 %. Moreover, the value can reach
145.71 mAh·g-1 with a retention rate of approximately 53.3 % when the current density is recovered to
0.5 C. The excellent rate performance of PT-3 should be ascribed to its large specific surface area,
which greatly shortens the transportation path of Li+ and allows Li+ to diffuse in the active substances
at a more rapid rate.

Table 1. The initial discharge/charge capacity, cycle performance and rate performance of
 nanostructured TiO2 reported in some related references

 Ref Materials Discharge/charge Cycle performance Rate Performance
 Capacity
 136.12 mAh·g-1 at
 168mA·g-1
 106.88 mAh·g-1 at
 This
 12wt.% 518.71/294.99 mAh·g-1 at 110.11 mAh·g-1 after 1 336 mA·g-1
 wor
 camphene 84 mA·g-1 00 cycles at 84 mA·g -1
 78.99 mAh·g-1 at 840
 k
 mA·g-1
 57.90 mAh·g-1 at
 1680 mA·g-1
 [13] TiO2 160 mAh·g-1 at 36 mA·g-1 142 mAh·g-1 after 122 mAh·g-1 at
 nanotubes 100 cycles at 36 144 mA·g-1
 mA·g -1

 [17] LR-TiO2 120 mAh·g-1at 0.5C 89 mAh·g-1 after 67 mAh·g-1 at 2
 100 cycles at 0.5C C
 242.1 mAh·g-1 after
 298.9 mAh·g-1 at 44.5 70 mAh·g-1 at 1780
 [35] TiO2-NCs 100 cycles at 44
 mA·g-1 mA·g-1
 mA·g-1
 262/221 mAh·g-1 at 100 213 mAh·g-1 after 40
 [36] TiO2 rods -
 mA·g-1 cycles at 100mA·g-1
Int. J. Electrochem. Sci., 16 (2021) Article ID: 210420 13

 TiO2 263/229 mAh·g-1 at 10.05 56 mAh·g-1 at 1005
 [37] -
 nanospheres mA·g-1 mA·g-1
 TiO2 204.7 mAh·g-1 at 170 m 151.9 mAh·g-1 after 60 151.7 mAh·g-1 at 340
 [38]
 mesocrystals A·g-1 cycles at 170mA·g-1 mA·g-1
 TiO2 355/249 mAh·g-1 at 33.6 66 mAh·g-1 at 1680
 [39] _
 microspheres mA·g-1 mA·g-1
 TiO2-B 413/216 mAh·g-1 at 33.5 203 mAh·g-1 after 35
 [40] -
 nanobelts mA·g-1 cycles at 33.5 mA·g-1
 TiO2 195 mAh·g-1 after
 [41] 505/225 mAh·g-1 at 0.1C 132 mAh·g-1 at 1C
 microspheres 20cycles at 0.1C

 In order to evaluate the electrochemical performance of the TiO2 nanofibres with 12 wt.%
camphene synthesized in this work, we compared it with that of TiO2 reported in the relative references
[13,17 35-41]. As shown in Table 1, the initial discharge/charge capacity acquired in this work is
higher than that reported in those references. With respect to the cycle performance, it is difficult to
evaluate which is better due to the difference in selected cycling number or current density between
our work and above-mentioned references. When the cycling number is small or the current density is
low, the resultant value is usually large, and vice versa. For the rate performance, the retained
discharge capacity in our work is usually superior to that reported in those references, indicating that
the synthesized TiO2 nanofibres with 12 wt.% camphene demonstrate more outstanding rate
performance. Based on the above comparison, it can be concluded that TiO2 nanofibres possess
excellent electrochemical performance by introducing 12 wt.% camphene into those.

4. CONCLUSIONS

 Porous anatase TiO2 nanofibres with a very large specific surface area were successfully
synthesized by introducing camphene as the pore-creating agent through the electrospinning followed
by calcination at a suitable temperature. The TiO2 electrode with 12 wt.% camphene demonstrated an
outstanding electrochemical performance in terms of its capacity, rate performance and cycling
performance because it exhibited the largest specific area surface of approximately 72 m2·g-1. Its initial
discharge specific capacity was 518.71 mAh·g-1, which was approximately 1.7 times that obtained in
the TiO2 electrode without the addition of camphene. The former also had a higher average discharge
capacity of 273.27 mAh·g-1 and a larger retention rate of 21.6% when the current density was gradually
increased from 0.5 C to 10 C. Moreover, the discharge capacity recovered to a higher value of
approximately 145.71 mAh·g-1 with a retention rate of 53.3%. In addition, the highest discharging
capacity remains at 114.41 mAh·g-1, and the retention rate is 21.7% when the sample is subjected to
100 cycles at 0.5 C, which is larger than that of the electrode without camphene (51.44 mAh·g-1,
17.1%).
Int. J. Electrochem. Sci., 16 (2021) Article ID: 210420 14

ACKNOWLEDGEMENT
This work was financially supported by the National Natural Science Foundation of China, China
(51471105) and Natural Science Foundation of Shanghai (20ZR1422200).

References

1. C. Gervillié, A. Boisard, J. Labbé, S. Berthon-Fabry and K. Guérin, Synthetic Met., 267 (2020)
 116477.
2. S. Goriparti, E. Miele, F. De Angelis, E. Di Fabrizio, R. Proietti Zaccaria and C. Capiglia, J. Power
 Sources, 257 (2014) 421-443.
3. R. Kumar, S. Sahoo, E. Joanni, R.K. Singh, W.K. Tan, K.K. Kar and A. Matsuda, Prog. Energ.
 Combust., 75 (2019) 100786.
4. W.B. Hawley and J. Li, J. Energy Storage, 25 (2019) 100862.
5. A. Tomaszewska, Z. Chu, X. Feng, S. O'Kane, X. Liu, J. Chen, C. Ji, E. Endler, R. Li, L. Liu, Y. Li,
 S. Zheng, S. Vetterlein, M. Gao, J. Du, M. Parkes, M. Ouyang, M. Marinescu, G. Offer and B. Wu,
 eTransportation., 1 (2019) 100011.
6. J. Inamoto, Y. Matsuo, M. Katsumi, S. Uchida, M. Ishikawa, T. Masuyama, K. Tsukamoto and Y.
 Sato, Carbon, 163 (2020) 162-168.
7. S. Kumagai, T. Ishikawa and N. Sawa, J. Energy Storage, 2 (2015) 1-7.
8. D. Narsimulu, G. Nagaraju, S. Chandra Sekhar, B. Ramulu, S. Khaja Hussain and J.S. Yu, J. Alloy.
 Compd., 846 (2020) 156385.
9. D.H. Lee, B.H. Lee, A.K. Sinha, J.H. Park, M.S. Kim, J. Park, H. Shin, K.S. Lee, Y.E. Sung and T.
 Hyeon, J. Am. Chem. Soc., 140(48) (2018) 16676-16684.
10. V.M. Zainullina, V.P. Zhukov and M.A. Korotin, J. Photoch. Photobio. C., 22 (2015) 58-83.
11. Y. Ma, Y. Li, D. Li, Y. Liu and J. Zhang, J. Alloy. Compd., 771 (2019) 885-891.
12. R. Qing, L. Liu, C. Bohling and W. Sigmund, J. Power Sources, 274 (2015) 667-675.
13. O. Fasakin, K.O. Oyedotun, M. Kebede, M. Rohwer, L.L. Roux, M. Mathe, M.A. Eleruja, E.O.B.
 Ajayi and N. Manyala, Energy Rep., (2020) 2352-4847.
14. Y. Liu, T. Ding, D. Shen, J. Dou and M. Wei, J. Electroanal. Chem., 804 (2017) 87-91.
15. H. Liu, Z. Bi, X.G. Sun, R.R. Unocic, M.P. Paranthaman, S. Dai and G.M. Brown, Adv. Mater., 23
 (30) (2011) 3450-3454.
16. W. Wu and D. Zhang, Micropor. Mesopor. Mat., 285 (2019) 89-95.
17. S.I. Choi, E.J. Jung, M. Park, H.S. Shin, S. Huh and Y.S. Won, Appl. Surf. Sci., 508 (2020) 145237.
18. D. Xu, W. Chen, Y. Luo, H. Wei, C. Yang, X. Cai, Y. Fang and X. Yu, Appl. Surf. Sci., 479 (2019),
 980-988.
19. C. Guo, Q. Tian and L. Yang, J. Alloy. Compd.,776 (2019) 740-745.
20. R. Katal, S. Masudy-Panah, M. Tanhaei, M.H.D.A. Farahani and H. Jiangyong, Chem. Eng. J., 384
 (2020) 123384.
21. A. Yamakata and J.J.M. Vequizo, J. Photoch. Photobio. C., 40 (2019) 234-243.
22. Z. Wang,Y. Tong, L. Dang, F. Gao and Q. Lu, Chem. Eng. J., 370 (2019) 1434-1439.
23. Y.F. Yuan, F. Chen, S.M. Yin, L.N. Wang, M. Zhu, J.L. Yang, Y.C. Wu and S.Y. Guo, J. Power
 Sources, 420 (2019) 38-45.
24. W.H. Choi, C.H. Lee, H.e. Kim, S.U. Lee and J.H. Bang, Nano Energy, 74 (2020) 104829.
25. C. Zhang, Y. Qi, S. Liu, Y. Men and F. Cui, Mat. Chem. Phys., 237 (2019) 121822.
26. Q. Liu, J. Hou, C. Xu, Z. Chen, R. Qin and H. Liu, Chem. Eng. J., 381 (2020) 122649.
27. L. Huang, Y.H. Ding, P. Zhang, H.L. Zhang and R.H. Zhou, Ionics, 21(6) (2014) 1553-1559.
28. G. Calcagno, A. Lotsari, A. Dang, S. Lindberg, A.E.C. Palmqvist, A. Matic and C. Cavallo, Mater.
 Today Energy, 16 (2020) 100424.
Int. J. Electrochem. Sci., 16 (2021) Article ID: 210420 15

29. J.F. Wang, J.J. Zhang and D.N. He, Nano-Structures & Nano-Objects, 15 (2018) 216-223.
30. H.C. Zeng, Curr. Opin. Chem. Eng., 1(1) (2011) 11-17.
31. L. Zhao, I. Watanabe, T. Doi, S. Okada and J.-i. Yamaki, J. Power Sources, 161(2) (2006) 1275-
 1280.
32. J. Collins, G. Gourdin, M. Foster and D. Qu, Carbon, 92 (2015) 193-244.
33. G.-P. Kim, S. Park, I. Nam, J. Park and J. Yi, J. Power Sources, 237 (2013) 172-177.
34. W. Wang, P. Zhang, S. Li, C. Zhou, S. Guo, J. Liu, J. Zhou, X. Jian, Y. Yang, Y. Lei, K. Li, J. Wu
 and L. Chen, J. Power Sources, 475 (2020) 228683.
35. Y.-M. Jiang, K.-X. Wang, X.-X. Guo, X. Wei, J.-F. Wang and J.-S. Chen, J. Power Sources, 214
 (2012) 298-302.
36. Y. Cai, H.-E. Wang, J. Jin, S.-Z. Huang, Y. Yu, Y. Li, S.-P. Feng and B.-L. Su, Chem. Eng. J., 281
 (2015) 844-851.
37. H.-E. Wang, H. Cheng, C. Liu, X. Chen, Q. Jiang, Z. Lu, Y.Y. Li, C.Y. Chung, W. Zhang, J.A.
 Zapien, L. Martinu and I. Bello, J. Power Sources, 196(15) (2011) 6394-6399.
38. J. Ye, W. Liu, J. Cai, S. Chen, X. Zhao, H. Zhou and L. Qi, J. Am. Chem. Soc., 133(4) (2011) 933-
 40.
39. J. Jin, S.-Z. Huang, J. Shu, H.-E. Wang, Y. Li, Y. Yu, L.-H. Chen, B.-J. Wang and B.-L. Su, Nano
 Energy, 16 (2015) 339-349.
40. D.P. Opra, S.V. Gnedenkov, A.A. Sokolov, V.Y. Mayorov and S.L. Sinebryukhov, Scripta Mater.,
 165 (2019) 150-153.
41. J. Yi, Y.-l. Liu, Y. Wang, X.-p. Li, S.-j. Hu and W.-s. Li, Int. J. Min. Met. Mater., 19(11) (2012)
 1058-1062.

© 2021 The Authors. Published by ESG (www.electrochemsci.org). This article is an open access
article distributed under the terms and conditions of the Creative Commons Attribution license
(http://creativecommons.org/licenses/by/4.0/).
You can also read