Schroder Real Estate Investment Trust - Interim Results Presentation - Duncan Owen, Nick Montgomery and Rick Murphy - Schroders

Page created by Esther Frank
 
CONTINUE READING
Schroder Real Estate Investment Trust - Interim Results Presentation - Duncan Owen, Nick Montgomery and Rick Murphy - Schroders
Schroder Real Estate Investment Trust
Interim Results Presentation

Duncan Owen, Nick Montgomery and Rick Murphy                                               17 November 2020
                                               For professional clients only. This material is not suitable for retail clients
Schroder Real Estate Investment Trust - Interim Results Presentation - Duncan Owen, Nick Montgomery and Rick Murphy - Schroders
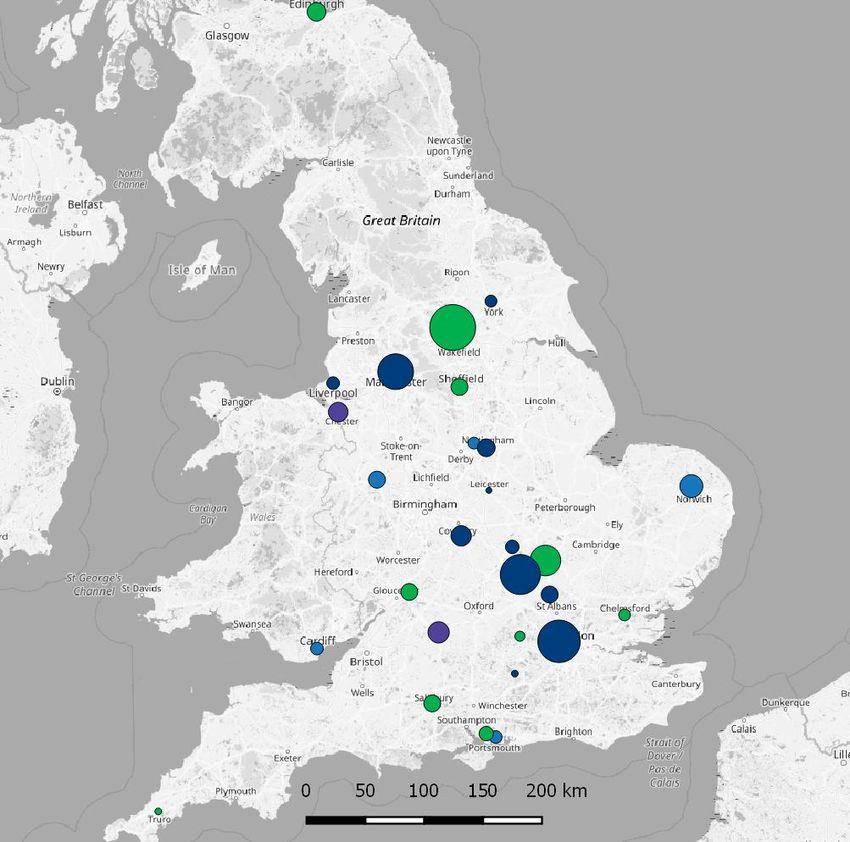
Agenda

01                    SREIT overview

02                    Portfolio

03                    Outlook

04                    Appendix

Throughout this presentation the Schroder Real Estate Investment Trust will be referred to as SREIT.

1
Schroder Real Estate Investment Trust - Interim Results Presentation - Duncan Owen, Nick Montgomery and Rick Murphy - Schroders
SREIT overview
Schroder Real Estate Investment Trust - Interim Results Presentation - Duncan Owen, Nick Montgomery and Rick Murphy - Schroders
Overview of the half year to 30 September 2020
Active asset management, strong balance sheet and capital to invest
     Property Performance                               Financial Performance                                    Income Focus                                           Portfolio

       Sustained real estate
                                                       NAV total return of -2.2%                         84% rent collection for the
     outperformance vs. MSCI
                                                       over the interim period to                          quarter to September                            Focus on regional offices
           Benchmark
                                                          30 September 2020                                                                                 and multi-let industrial
                                                                                                        86% current rent collection                        warehousing comprising
     +1.0% over interim period;
                                                       NAV total return of +1.2%                            for the quarter to                            70% of the portfolio’s value
         +1.1% over 1 year;
                                                          over quarter to 30                                    December
     +2.0% p.a. over 3 years; and
                                                           September 2020
    +1.0% p.a. since IPO in 20041

                                                                                                       Dividend reinstated in June
                                                     Share buy-back programme
                                                                                                       at 0.38575 pps equivalent to                        25.9% net loan to value at
     46 lettings, rent reviews                        in September and October
                                                                                                          50% of pre-Covid level                              2.25% total cost p.a.
      and renewals totalling                         achieved average discount
    £6.0m, generating an uplift                             of 46% to NAV
                                                                                                           Further 50% dividend                            £79 million of cash and
           of £2.0m p.a.2
                                                                                                        increase announced for the                        undrawn debt facilities for
                                                      Buy-back programme to be
                                                                                                          quarter to September to                              reinvestment
                                                            recommenced
                                                                                                                 0.575 pps

Past performance is not a guide to future performance and may not be repeated. The value of investments and the income
from them may go down as well as up and investors may not get back the amount originally invested
Source: Schroders, November 2020.   1. Source:   MSCI property level returns gross of fees on a like-for-like basis including direct and indirect. 2. This includes activity post-period end.

3
Schroder Real Estate Investment Trust - Interim Results Presentation - Duncan Owen, Nick Montgomery and Rick Murphy - Schroders
Unaudited interim NAV as at 30 September 2020
Total decrease of -2.8% and a NAV total return of -2.2%
                                            £m     PPS Comments

NAV as at 31 March 2020                   309.8    59.7

Unrealised decrease in the valuations
of the direct real estate portfolio and    (8.4)   (1.6)
Joint Ventures                                             Like-for-like valuation movements net of capex -3.4%; by sector was Industrial -0.1%,
                                                           Offices -0.9%, Other -6.0% and Retail -10.4%
Capital expenditure (direct portfolio
                                           (5.4)   (1.0)
and share of Joint Ventures)

Realised gains on disposals                 Nil     Nil No disposals were made during the six month period

Net revenue                                 5.1     1.0 EPRA earnings for the six months ended 30 September

                                                           No dividend was paid for Q1 2020. The Q2 2020 dividend paid was 50% of the target
Dividend paid                              (2.0)   (0.4)
                                                           rate

NAV as at 30 September 2020
                                          299.1    57.7 Reflects prior shares outstanding of 518,513,409
(excluding the share buyback)

                                                           c.7.2m shares repurchased at average of 31.6 pps at 30 September 2020
Share buyback                              (2.3)    0.3
                                                           c.15.2m shares repurchased at average of 32.2 pps per share including post period

NAV as at 30 September 2020               296.8    58.0 Reflects shares outstanding of 511,364,955 as at 30 September 2020

4
Schroder Real Estate Investment Trust - Interim Results Presentation - Duncan Owen, Nick Montgomery and Rick Murphy - Schroders
Income and Dividend illustration
Dividend increased to 0.575 pps to reflect positive activity
                                       EPRA Earnings                                                        Dividend

                                         6 months to      6 months to    12 months to    –   Increased dividend of 0.575 pence per
                                       30 September     30 September         31 March        share will be paid in December 2020
                                            2020 £m          2019 £m          2020 £m        relating to the period 1 July 2020 to 30
                                                                                             September 2020
    Rental income – direct portfolio            10.3             11.8            22.2
                                                                                         –   The dividend payment will be made on 11
                                                                                             December 2020 to shareholders on the
    Rental income – joint ventures               1.3              1.3             2.6        register as at 27 November 2020. The ex-
                                                                                             dividend date will be 26 November 2020.
    Other income                                 0.1              1.0             1.3    –   The dividend of 0.575 pps will be
                                                                                             designated 0.575 pps as an interim
    Rental and related income                   11.7             14.1            26.1        property income distribution (‘PID’)

                                                                                         –   Future dividend increases will be
    Property operating expenses                 (1.7)            (1.2)           (2.3)       considered dependent on further progress
                                                                                             with rental collection rates, acquisitions
                                                                                             and other earnings accretive activity
    Expenses                                    (2.6)            (2.9)           (5.8)
                                                                                         –   Note: Additional future income from
    Finance costs – net interest                                                             reinvestment, asset management and
                                                (2.3)            (3.3)           (5.3)
    payments                                                                                 lower number of shares
    EPRA Earnings                                5.1              6.7            12.7

Source: Schroders, November 2020.

5
Schroder Real Estate Investment Trust - Interim Results Presentation - Duncan Owen, Nick Montgomery and Rick Murphy - Schroders
Active strategy to deliver sustainable net income growth
Sales at 3%; refinancing; active management; reinvestment 6.5%+; buy backs

                                                                        Active Asset                                                 Share Buyback
       Asset Disposals                   Debt Refinancing                                                Acquisitions
                                                                        Management                                                    Programme
•     £95m of disposals             •    Refinancing of          •    Immediate Covid-19        •     Disciplined acquisition   •   Commenced on 8
      completed in 2019 at               £129.6m reduced the          response focussed on            strategy focused on           September 2020
      an average net initial             cost of debt on the          safety and wellbeing            Winning Cities and
      yield of 3.0%                      facility by £2.5m per        of all stakeholders             resilience of income
                                                                                                                                •   The Company’s shares
                                                                                                                                    at the prevailing price
                                         annum, with one-off
•     Disposals crystallised
                                         break fee of £27.4m
                                                                 •    Continued activity        •     Focussed on income            and discount to NAV
      profits from asset                                              with 46 new lettings,           resilience and good           offers attractive value
      management and                •    Extended term to 13          renewals and reviews            fundamentals                  for its shareholders
      supported                          and 20 years                 since 31 March 2020
      performance
                                                                                                •     £60m of acquisitions      •   £5m of share
                                    •    Significant covenant    •    This activity increased         at 6.5% equates to c.         buybacks to date
•     Further disposals of               headroom                     contracted rental               £4m of rental income          added 1.4% of NAV
      non-core assets will                                            income by £2.0m p.a.                                          accretion and
      be considered
                                                                                                •     Strong pipeline but no
                                                                                                                                    improves dividend
                                                                                                      urgency to invest due
                                                                                                                                    cover
                                                                                                      to market softening
    Strong balance sheet
                                        Reduced cost of debt       Improved defensive               Disciplined approach            Accretive to NAV
        with low LTV
                                                                 qualities of the portfolio
                                        Improved covenant                                           Potential for c. £4m of         Income saving on
    Positioned to reinvest
                                            flexibility              Improved net income                rental income                   dividend
    post market correction

Past performance is not a guide to future performance and may not be repeated. The value of investments and the income from them may go down as
well as up and investors may not get back the amount originally invested.
Source: Schroders, November 2020.

6
Schroder Real Estate Investment Trust - Interim Results Presentation - Duncan Owen, Nick Montgomery and Rick Murphy - Schroders
Overview of share buyback programme
Daily average of 500,000 shares per day at average price of 32.2 pps
                                                  Price (pps)
        Overview (as at 16 October 2020)
                                                       80
    # shares repurchased
                                       15.2
    (m)
                                                       70

    Shares outstanding
                                      503.3
    post repurchases (m)                               60

    Average price pps                  32.2            50

                                                       40
    Total investment                  £4.9m

                                                       30
    Average discount to
                                       -46%                     Lowest share price of 28.7 pps
    NAV
                                                       20

    NAV accretion                      1.4%            10

    Implied buyback yield                               0
                                    9.6% / 4.8%
    (100% / 50% dividend)

Source: Schroders, November 2020.

7
Schroder Real Estate Investment Trust - Interim Results Presentation - Duncan Owen, Nick Montgomery and Rick Murphy - Schroders
UK real estate market overview
Polarisation accelerating across the sectors

MSCI all property index – capital value

% age change – month-on-month (average – bars; range1 – drop-down lines) and cumulative from end 2015 (line)
      SDLT increase EU referendum
 6%                                                                                                                                                                                 6%
                                         Industrial sector                                                                          Industrial sector     Industrial sector
 5%                                                                                                                                                                                 5%
 4%                                                                                                                                                                                 4%
 3%                                                                                                                                                                                 3%
 2%                                                                                                                                                                                 2%
 1%                                                                                                                                                                                 1%
 0%                                                                                                                                                                                 0%
-1%                                                                                                                                                                                 -1%
-2%                                                                                                                                                                                 -2%
-3%                                                                                                                                                                                 -3%
-4%                                                                                                                                                                                 -4%
-5%                                                                                                                                                                                 -5%
-6%                               Retail sector                          Retail sector                                                                                              -6%
-7%                                                                                                                                                                                 -7%

             Dec
             Dec

            Sept

             Dec

             Dec
             Feb

            Sept
             Oct

             Oct

            Sept
             Oct

            Sept
             Oct

            Sept
               Jul

             May

               Jul

               Jul

               Jul
         2016 Jan

             Mar

             May
              Jun

             Mar

             May

             Mar

              Jun

             Mar

             May
              Jun

             May
              Jun
             Apr

         2017 Jan
             Nov

             Feb

             Apr

         2018 Jan
             Nov

             Feb

             Apr

         2019 Jan
             Nov

             Feb

             Apr

         2020 Jan

             Mar
             Nov

             Feb

             Apr
             Aug

             July
            June

             Aug

             Aug

             Aug

             Aug
                                                                Monthly change                 Range               Cumulative

 Source: MSCI as at 30 September 2020; 1Range shows highest and lowest change across 10 segments: Standard retail SE and rest UK; Shopping centres; Retail warehouses; Offices City, West
 End/Midtown, rest SE and rest UK; Industrial SE and RUK; other.

 8
Portfolio
COVID-19: Rent collection and deferrals
86% of September quarter date rent currently collected

         Rent collection overview (September quarter)                                     Case-by-case approach to tenant deferment requests

                     Rent demanded by sector (%)                                                                 Income impact     Capital impact   %1
        Other                                                         Office
                                                                                                                  Negative short
                                                                                                                      term
                                                                                        Rent deferment                                Neutral       41
        96%                                                           94%                                        Neutral medium
                                     4%                                                                               term

                    27%
                                                           40%                          Lease extension in       Negative short
                                                                                                                                      Positive      30
                                                                                        return for rent free         term
                                      86%

                                                                                        Remove break in          Negative short
                                                                                                                                      Positive      8
                                                                                        return for rent free         term
       Retail &
                                                                   Industrial
       Leisure
                                 29%

        60%                                                           99%
                                                                                        Other structural         Negative short
                                                                                                                                      Positive      21
                                                                                        deal                         term

                    Rent collected as % of demanded rent

Source: Schroders, November 2020. 1 This analysis is illustrative of proposals both agreed and in negotiation.

10
Portfolio overview
Structure vs. the MSCI Benchmark
                                                                   SREIT                   MSCI                  Structure as a % of value post disposals
                                                                 30/09/2020             30/09/2020
                                                                                                                                    Office - City          0.0
Portfolio value (£m)                                                  397.8                     -
                                                                                                                                                                 3.7
                                                                                                                                                                             9.5
Number of properties                                                    39                      -                 Office - Mid and West End
                                                                                                                                                                          7.6
                                                                                                                                                                         7.3
Net initial yield (%)                                                  5.9                    4.8                    Office - Rest South East
                                                                                                                                                                             8.9
Reversionary yield (%)1                                                7.4                    5.3                           Office - Rest of UK                                                   22.6
                                                                                                                                                                          7.7
Rent (£m)                                                              24.9                     -                                                                               11.1
                                                                                                                      Industrial - South East
                                                                                                                                                                                          17.2
Estimated rental value (£m)                                            29.4                     -
                                                                                                                       Industrial - Rest of UK                                             18.6
Unconditional contracted uplifts for the                                                                                                                                    9.8
                                                                       2.7                      -
next 24 months (£m)                                                                                                         Retail - South East            0.6
                                                                                                                                                                           8.5
Average unexpired lease term (years)2                                  5.6                    9.7
                                                                                                                                                                             10.0
                                                                                                                            Retail - Rest of UK
                                                                                                                                                                   4.5
Void rate (%) 3                                                        7.1                    7.4
                                                                                                                    Retail - Shopping centre               0.0
Office weighting (%)                                                   39.4                   27.9                                                               3.3
                                                                                                                                                                                   12.6
                                                                                                                           Retail - Warehouse
Industrial weighting (%)                                               29.7                   26.9                                                                          9.1
Retail weighting (%)                                                   23.2                   25.4                                                                       7.7
                                                                                                                                          Others
- Retail single use                                                    17.5                    -                                                                                             19.7
- Retail ancillary to main use                                          5.7                    -
                                                                                                                                                       0          5        10       15     20       25
Other weighting (leisure etc.) (%)                                     7.7                    19.7
                                                                                                                                               Portfolio          MSCI Benchmark

1 On   a like-for-like basis with MSCI i.e. ignoring acquisition costs. 2 Assuming earlier of lease break and expiry capped at 30 years. 3 % of ERV.

11
Reversionary income yield of 7.4% (MSCI 5.3%)
Supporting income growth during a period of negative growth
£m
35
                                                                                                                                   c.4

                                                                                            2.1
30                                                                                                                    29.4
                                         2.7                       1.0
                                                                                                             -1.3

               24.9
25

                                                                                    Uplift
                                               Top five fixed uplifts                             Timing
                                                                                    £k p.a.
20                                             University of Law (London)             +416        Jan-21
                                               Lidl (Bedford)                         +335        Jun-21
                                               BBC Scotland (Edinburgh)               +191        Dec-20
                                               Home Bargains (Bedford)                +190        Jun-21
                                               Quentor (Norwich)                      +181        Dec-20
15
         Contracted    Fixed uplifts next                   ERV growth               Vacant space          Overrent   ERV    New acquisitions
       income as at 30    24 months                                                                                              income of
          Sep 2020                                                                                                            c.£60m at 6.5%

Source: Schroders, Knight Frank, September 2020. New acquisition income shown for illustrative purposes

12
Asset management overview
High quality assets let at sustainable rents with income growth potential
        Milton Keynes, Stacey Bushes                           Leeds, Millshaw                       London, Bloomsbury, Store Street
                 (Industrial)                                    (Industrial)                              (Office; 50% Share)

–    345,000 sq ft multi-let industrial estate   –   460,000 sq ft multi-let industrial estate   –   85,814 sq ft freehold office and
     comprising of 42 units                          comprising of 27 units                          educational campus across 0.8 acres
–    10 lettings, renewals and reviews           –   6 lettings, renewals and reviews            –   Rent review with the University of Law
     completed generating additional                 completed generating additional                 completed post period end
     net rent of £225,000 p.a. vs. Mar-20            net rent of £130,000 p.a. vs. Mar-20        –   New rent of £1.85m p.a. or £42 per
–    Sustainable average rent of £6.25 per       –   Sustainable average rent of £5.75 per           sq ft delivering a £415,500 increase
     sq ft vs. average ERV of £7.00 per sq ft        sq ft vs. average ERV of £6.50 per sq ft    –   The Company will receive £326,708 of
–    Heathfield Gateway development              –   Progressing change of use strategy              back rent and the tenant has received
     completed comprising six units of               with completion of the JD Sport Gyms            a three month rent free period
     circa 15,000 sq ft. Terms out on five           unit that adds amenity to the estate        –   Improving location due to mix of uses,
     units at £14.00 per sq ft.                  –   Working with the adjoining land                 ‘Camden Project’ and infrastructure
–    Potential to acquire further adjoining          owner to promote a new station to           –   The new rent reflects a yield of 4.9%
     ownerships                                      service the location                            based on the valuation

              Multi-let industrial                         Multi-let industrial                      Redevelopment opportunity
Source: Schroders, November 2020.
13
Asset management overview (2)
Mixed use and retail assets with sustainable rents in urban locations
           Manchester, City Tower                      Leeds, Headingley Central                  Bedford, St. John’s Retail Park
       (Office / Mixed-use; 25% share)                    (Retail / Mixed-use)                         (Retail Warehouse)

–    610,000 sq ft of office, retail, leisure   –   90,000 sq ft convenience retail, 98-     –   130,000 sq ft retail warehouse scheme
     and hotel accommodation on a three             room hotel and gym scheme                    let to 11 tenants with two vacant units
     acre island site in the heart of           –   Top tenants by income are Premier        –   Lidl and Home Bargains letting
     Manchester                                     Inn, Sainsbury’s, The Gym (AFL) and          completed generating £525,000 p.a.
–    6 lettings, renewals and reviews               Boots. Average rent on retail units          rent with higher footfall forecast
     completed generating additional                reflects c. £50 per sq ft Zone A rents       across the scheme
     net rent of £130,000 p.a. vs. Mar-20       –   Recent asset management includes         –   10 year letting to Easy Bathrooms at
–    Offering short term ‘plug-and-play’            converting office space into new gym,        £22 per sq ft and re-gear with Curry's
     leases to achieve premium to ERV               lease renewals with William H Brown          PC World for 10 years
–    Sustainability and public realm                and BHF, re-gear with Market Town        –   Average rent of £17.25 per sq ft with
     improvements are a focus. Achieved a           Taverns and Heavenly Desserts letting        average ERV of £16.20 per sq ft.
     BREEAM In Use certification of ‘Good’      –   Potential to increase food retail use    –   Valuation reflects c.7% yield on expiry
     for Part 2 Building Management                                                              of Lidl and Home Bargains rent free

                   Winning City                      Mixed-use convenience-led                     Value retail warehousing
Source: Schroders, November 2020.
14
Sustainable investing
Sustainable and Impact Investing central to approach
–    Focussed on ESG and ‘positive impact’ investing to generate
                                                                     ISAP Case Study:
     improved returns, contribute to tenants’ business
     performance and create tangible benefits to communities         City Tower, Manchester
–    ESG and Impact integrated in asset management processes:                Community & Social Impact

     –   Acting responsibly during Covid-19 pandemic                         –   Residencies for local start-ups and charities in the City
                                                                                 Tower pop-up shop
     –   Signatory to BBP Climate Change Commitment
                                                                             –   Dedicated occupier engagement portal to promote City
     –   Energy audits undertaken to identify asset opportunities                Tower specific events and provide discounts and reduced
                                                                                 fees to local shops, restaurants and gyms
     –   LED lighting and Automatic Metering programmes
     –   EV charging installation programme                                  Energy & Waste Management
     –   99.5% landlord procured electricity on renewable tariff;            –   Energy management strategy being implemented
         5% fall in like-for-like landlord procured energy in 2019               following building-wide metering audit

–    Impact and sustainability action plans (‘ISAP’) for major               –   Re-negotiated waste management contract to improve
     refurbishments initiated with the aim of industry                           recycling, occupier engagement to reduce plastics and
                                                                                 building awareness of waste reduction at work and home
     sustainability accreditations
–    Key recent achievements include:                                        Green & Active Transport
     –   Three star rating in 2019 GRESB survey with 16% scoring             –   Two onsite dedicated cycle storage areas
         improvement. 2020 results expected shortly
                                                                             –   New ‘VeloZone’ with increased cycle storage with drying
     –   EPRA Best Practice Sustainability Reporting Gold Award                  room, showers and changing facilities
         for the year end accounts
                                                                             Health & Wellbeing
     –   BREEAM In Use Certification: ‘Good’ Rating at The Arc,
         Nottingham and City Tower, Manchester; ‘Very Good’ at               –   Health and well-being programme which includes
         Cheltenham                                                              exercise classes three times per week and on-line yoga

15   Source: Schroders, November 2020.
Summary
Summary
Strong balance sheet provides investment capacity to grow net income
–    Sales of £95 million of assets at an                                                                 Investment Capacity
     average net initial yield of 3.0% in
     2019                                                  £ (million)
                                                                                               £52.5m               £79m        Acquisitions
                                                           80
–    Refinancing to lower debt cost and                                                                                         at 6.5% NIY
     extend term
                                                           70                                                                      c.£4m
–    25.9% net loan to value and £79                                                            (Non-                              rental
     million of cash and undrawn debt                      60                                 utilisation                         income
     facilities                                                                              fee of 0.64%
                                                           50                                with margin
–    Reinvestment to generate                                                                  of 1.6%)
     additional c. £4 million of rental                                                                                          Share buy
                                                           40                                                                      backs
     income, with strong pipeline of                                                                                 c.£65
     opportunities                                                                                                  million
                                                           30            £27m                                                    NAV and
                                                                                                                   to invest
–    Share buy backs to increase NAV                                                                                              income
     and increase dividend cover                                                                                                 accretive
                                                           20

–    Active management to capture
                                                           10
     £4.5 million of reversion, of which
     £2.7 million is fixed contractual                                                                                             Asset
     uplifts                                                 0                                                                  management
                                                                   Cash 30-Sep-20            RCF facility           Cash for     activity to
–    Review dividend each quarter as                                                                              investment      capture
     reinvestment occurs and asset                                                                                               reversion
     management delivers
Source: Schroders, November 2020. Note activity and additional income are shown for illustrative purposes only.

17
Management update from July 2020
No change day to day
                                RNS ANNOUNCEMENT UPDATE ON THE INVESTMENT MANAGER

The Board of Schroder Real Estate Investment Trust (‘’SREIT’’), the actively managed UK-focused REIT, has
been notified that Duncan Owen, SREIT’s Fund Manager since IPO in 2004, has decided to step down from
his role as Global Head of Real Estate at Schroders REIM (‘’SREIM’’). Duncan Owen will remain at SREIM as
Global Head of Real Estate until 31st December 2020.

From 1st January 2021 Duncan will become a special advisor to SREIM with a focus on SREIT. This will mean
he will continue to work closely with the Board and the existing team including Nick Montgomery, assisting
Schroders in fulfilling its role as the appointed investment manager. SREIT’s investment strategy and
objectives remain unchanged. The board of Schroder Real Estate Investment Trust will continue to monitor
the position closely.

Source: Schroders, July 2020.

18
Appendices
SREIT portfolio performance to 30 September 2020
 Higher income return and asset management generating relative outperformance
                 Six Month Total Return                                                            Three Year Total Return                                          Since IPO Total Return *

            1.0% relative outperformance                                               2.0% relative outperformance p.a.                                     1.0% relative outperformance p.a.

(%) 4.0                                                                          (%) 7.0                                                                 (%) 10.0
                                                                                                                                                                       Total Return          Income Return
                                                                                      6.0
                                                                                                                                                             8.0
                                                                                      5.0
      2.0
                                                                                      4.0                                                                    6.0

                                                                                      3.0                                                                    4.0
      0.0
                                                                                      2.0
                                                                                                                                                             2.0
                                                                                      1.0
   -2.0                                                                               0.0                                                                    0.0
                      SREIT                 MSCI Benchmark                                              SREIT                 MSCI Benchmark                           SREIT           MSCI Benchmark

  MSCI sector/total return                                        SREIT total return                                         MSCI Index total return                             Relative
                                                       Six                   Three                                     Six                   Three                   Six          Three
                                                                                              Since IPO*                                               Since IPO*                                Since IPO*
  To 30 September 2020                                months                 years                                    months                 years                  months        years
                                                                                                (% p.a.)                                                 (% p.a.)                                  (% p.a.)
                                                       (%)                  (% p.a.)                                   (%)                  (% p.a.)                 (%)         (% p.a.)

  Offices                                                 1.7                   5.9                  7.9                  -0.5                  4.3       7.3         2.2             1.5            0.6

  Industrial                                              2.8                  14.2                  9.4                  2.2                  10.6       8.6         0.6             3.2            0.8

  Retail                                                  -6.0                 -4.6                  3.8                  -5.1                 -4.5       3.4         -0.9            -0.1           0.4

  Other commercial                                        -8.7                 -1.6                  2.2                  -1.8                  4.5       7.5         -7.0            -5.9           -4.9

  All                                                     -0.3                  5.0                  7.1                  -1.3                  2.9       6.0         1.0             2.0            1.0
 Past performance is not a guide to future performance and may not be repeated. The value of investments and the income from them may go down as
 well as up and investors may not get back the amount originally invested.
 Source: MSCI property level returns gross of fees on a like-for-like basis including direct and indirect property investments. *IPO in July 2004.

 20
Compliance Disclosure Requirement
Schroder Real Estate Investment Trust – discrete yearly performance

                                                            12 months to   12 months to      12 months to         12 months to          12 months to
Discrete Yearly Performance (%)
                                                            Sep-2020       Sep-2019          Sep-2018             Sep-2017              Sep-2016

Share Price                                                  -39.5         -3.2               1.4                  11.9                 2.7

SREIT NAV Total Returns                                      -12.6         2.8                8.9                  11.8                 4.4

SREIT Real Estate Total Returns                              -1.1          5.4                11.0                 12.2                 6.6

MSCI UK Balanced Monthly and Quarterly
                                                             -2.3          2.7                8.6                  9.8                  4.4
Funds Quarterly Property Index

Past performance is not a guide to future performance and may not be repeated. The value of investments and the income from them may go down as
well as up and investors may not get back the amounts originally invested.

Schroder Real Estate Investment Trust – Risk Considerations:

Investments in real estate are relatively illiquid and more difficult to realise than equities or bonds. Yields may vary and are not guaranteed. The use of
gearing is likely to lead to volatility in the Net Asset Value (‘NAV’) meaning that a relatively small movement either down or up in the value of the
Company’s total assets will result in a magnified movement in the same direction of that NAV. There is no guarantee that the market price of shares in
Investment Companies such as SREIT will fully reflect their underlying NAV. The value of real estate is a matter of a valuer’s opinion rather than fact.

The trust may be concentrated in a limited number of geographic regions, industry sectors, markets and/or individual positions. This may result in large
changes in the value of the fund, both up or down, which may adversely impact the performance of the funds.
The Company may borrow money to invest in further investments, this is known as gearing. Gearing will increase returns if the value of the assets
purchased increase in value by more than the cost of borrowing, or reduce returns if they fail to do so.

Source: Property portfolio level returns. MSCI September 2020.

21
86% of the portfolio located in higher growth locations

                                                                                                   % of SREIT Capital Value

                                                                                                                                    3%
                                                                                                                        11%

                                                                                                                               11%

                                                                                                                     15%
                                                                                                                                 % of UK
                                                                                                                                                      51% 49%
                                                                                                                                  GDP

                                                                                                             37%         23%

                                                                                                    Fastest growing centres                       Second quartile

                                                                                                    Third quartile                                Slowest growing centres

Source: Oxford Economics, Schroders November 2020. Note: Size of the bubbles represents capital values as at 30 September 2020. The colours are where the cities and towns are within
the four quartiles of GDP growth between 2020 and 2025. For illustrative purposes only and should not be viewed as a recommendation to buy or sell. Forecast risk warning: Please refer to
the important information slide at the end of this presentation.

22
Overview of SREIT income at 30 September 2020
Diversified income base with 294 tenants across a range of sectors
                                    Top 20 Tenants                                                                   % by industry2
                                                       Rent p.a.
     #   Tenant
                                                         (£m)
                                                                     % Portfolio
                                                                                                                        3%      1%
                                                                                                                   3%                               19%
     1   University of Law Limited                       1.58           6.1                              4%
     2   Buckinghamshire New University                  1.15             4.4
                                                                                                      4%
     3   The Secretary of State                          0.73             2.8
     4   Cineworld Cinema Properties Limited             0.58             2.2
                                                                                                  5%
     5   Matalan Retail                                  0.57             2.2
     6   Express Bi Folding Doors                        0.53             2.0                                                                                  14%
     7   TJX UK Limited T/A Homesense                    0.51             1.9                     5%
     8   Jupiter Hotels Limited T/A Mercure              0.46             1.8
     9   SportsDirect.com Retail Limited                 0.46             1.7                          7%
 10 Premier Inn Hotels Limited                           0.42             1.6
 11 Lidl Great Britain Limited
                                    1
                                                         0.42             1.6                                                                             11%
                                                                                                                9%
 12 Geldards LLP                                         0.41             1.6
 13 Wickes Building Supplies Limited                     0.40             1.5
                                                                                                                                    11%
 14 Morgan Sindall Construction                          0.38             1.4             Retail Non-Food             Manufacturing               Education
 15 Lloyds Banking Group                                 0.35             1.3
                                                                                          Business Services           Leisure                     Other Industries
 16 Tulip Limited                                        0.34             1.3
 17 Jaguar Land Rover Limited                            0.33             1.3             Retail Food                 Public Sector               Wholesale
 18 Higher Education Statistics Agency Limited           0.32             1.2             Construction                Financial                   IT
 19 Sennheiser UK Limited                                0.30             1.2
                                                                                          Transport                   Other Services              Healthcare
 20 Smyths Toys UK Limited                               0.30             1.1
         Sub-total top 20 tenants                       10.55            40.3
                                                                                          Utilities                   Charity
Source: Schroders, MSCI, October 2020. 1 This includes agreement for lease at St John’s Retail Park, Bedford. For illustrative purposes only and should not be viewed as
a recommendation to buy or sell. 2 This data is as at 30 September 2020. Post period end rent review settled that increased University of Law rent to £2m p.a. or 7.5%

23
Reinvestment overview
No urgency to reinvest. Focus on resilience of income
                               Winning Cities                                                                  Active Management Potential
                                                                                                                         +
                                       Differentiated economy                                                                              Secondary                      Prime
                                                                                                                                            Grade A

                                                                                                                    Building quality
                                       Infrastructure

                                       Employment
                                                                                                                                                                       Secondary
                                                                                                                                            Tertiary
                                                                                                                                                                        Grade B
                                       Environment                                                                        -
                                                                                                                                       -          Income quality               +

                                  Sector Focus                                                                                              Target Metrics
                    •   Multi-let industrial acquired below
                        replacement cost                                                           Asset value                                Net Initial Yield                    Timing
                                         Industrial

•    Regional offices                                          •   Potential as part of
     Strong fundamental                                            mixed-use building or
                                                                                                 £10-30m                                            6%+                       2020/21
•
                              Office

                                                      Retail

     occupational demand                                           where valuation
•    Active management
                                       Mixed-use                   supported by
     to capture                                                    alternative use
     reversionary potential                                    •   Mispriced assets

                                          Other                                                  Sep-20: £10.2 million                        Sep-20: portfolio net
                                                                                                       average                                 initial yield of 5.9%
                                                                        Past performance is not a guide to future performance and may not be repeated. The value of investments and the
                    •   Creating rather than buying                         income from them may go down as well as up and investors may not get back the amounts originally invested.
                                                                                                                                                    Source: Schroders, November 2020.

24
Results for the six month period to 30 September 2020
Key metrics

 Period to                                                                            30 September 2020                   30 September 2019                                 % change

 (Loss)/Profit for the period                                                                            (£8.8m)                               £4.6m                              -291%

 EPRA1 earnings                                                                                            £5.1m                               £6.7m                                -23%

 EPRA1 earnings per share                                                                                   £1.0p                               £1.3p                               -23%

 Dividend per share paid                                                                                  £0.39p                                £1.3p                               -70%

 As at                                                                                30 September 2020                   30 September 2019                                 % change

 Net Asset Value                                                                                       £296.8m                             £354.3m                                  -16%

 Net Asset Value per share (pence)                                                                            58.0                               68.3                               -15%

 Property valuation2                                                                                   £397.8m                             £456.2m                                  -13%

 Loan to Value, net of cash                                                                                25.9%                               23.1%                                -12%

Past performance is not a guide to future performance and may not be repeated. The value of investments and the income from them may go down as
well as up and investors may not get back the amounts originally invested.
Source: Schroders. 1European Public Real Estate Association (“EPRA”) earnings calculated as total comprehensive net income (i.e. after fund expenses and finance costs) excluding realised
and unrealised gains/losses on investment property and share of profit on joint venture investments. 2Independent valuers’ valuation of property and joint ventures..

25
Balance sheet
Summary Balance Sheet (£m)

                                                                             30 September 2020              31 March 2020    30 September 2019
 As at
                                                                                      £million                   £million             £million

 Investment properties 1                                                                           388.3            397.0                409.1

 Cash                                                                                               78.7             33.1                 23.3

 Net current assets                                                                                 11.2              8.4                 49.3

 Debt                                                                                             (181.4)          (128.7)              (127.4)

 Net Asset Value                                                                                   296.8            309.8                354.3

 NAV (pence per share)                                                                             58.0p            59.7p                68.3p

 Loan to Value (%)                                                                                25.9%            23.7%                23.1%

Past performance is not a guide to future performance and may not be repeated. The value of investments and the income from them may go down as
well as up and investors may not get back the amounts originally invested.
Source: Schroders as at November 2020. 1 Excludes leasehold interests grossed up under IFRS 16.

26
Underlying EPRA profitability
24% reduction in underlying profit
£ (million)

10

                  6.7

                                                                                                           1.3                    5.1
 5
                                       (1.5)

                                                           (0.9)
                                                                                   (0.5)

 0
              HY 2019               Rental income      Other income        Property expenses           Expenses                HY 2020

Past performance is not a guide to future performance and may not be repeated. The value of investments and the income from them may go down as
well as up and investors may not get back the amounts originally invested.
Source: Schroders, November 2020.

27
Profit bridge
   HY 2020 vs. HY 2019
                                                  £m                   Sep-20      Sep-19   £m              Sep-20     Sep-19
£ £ (million)
                                                  Profit on sale                            Valuation
   15                                                                       -        £1.5                   (£13.9m)   (£3.6m)
                                                  of properties                             (Loss)/Gain*

   10

                    4.6m                       (1.6m)
     5
                                                                          (1.5m)
                                                                                                  (10.3m)
                                                                                                                            (8.8m)
     0

    -5

   -10
                 HY 2019                Net rental income          Profit on disposal of      Valuation loss*              HY 2020
                                                                       investments

   Past performance is not a guide to future performance and may not be repeated. The value of investments and the
   income from them may go down as well as up and investors may not get back the amounts originally invested.
   Source: Schroders, November 2020. *Properties and Joint Ventures.

    28
Statement of comprehensive income
                                                                               30 September            30 September                31 March
                                                                                    2020 £m                 2019 £m                 2020 £m
 Rental income – direct portfolio                                                          10.3                    11.8                   22.2

 Rental income – joint ventures                                                             1.3                     1.3                    2.6

 Other income                                                                               0.1                     1.0                    1.3
 Property operating expenses                                                               (1.7)                   (1.2)                  (2.2)
 Net rental and related income                                                             10.0                    12.9                   23.9
 Profit on disposal of investment property                                                     -                    1.5                    1.9
 Net valuation (loss)/gain on investment property                                        (13.5)                    (3.5)                (17.4)
 Expenses                                                                                  (2.6)                   (2.9)                  (5.8)
 Refinancing costs                                                                             -                       -                (27.4)
 Finance costs – net interest payments                                                     (2.3)                   (3.3)                  (5.3)
 Joint venture (loss)/gains                                                                (0.4)                   (0.1)                  (2.4)
 (Loss)/Profit before tax                                                                  (8.8)                    4.6                 (32.5)

 Ongoing charges – fund only expenses                                                     1.3%                    1.4%                   1.4%
 Ongoing charges – fund and property expenses                                             2.5%                    2.3%                   2.3%
Past performance is not a guide to future performance and may not be repeated. The value of investments and the income from them may go down as
well as up and investors may not get back the amounts originally invested.
Source: Schroders as at November 2020.

29
EPRA earnings

Earnings excluding property revaluations, gains on disposals and non-recurring expenditure
                                                                                 30 September          30 September          31 March 2020
                                                                                         2020                  2019                    £m
 Year to
                                                                                          £m                    £m

 (Loss)/Profit after tax                                                                     (8.8)                   4.6                (32.5)
 Excluding:
 Profit on disposal of investment property                                                       -                 (1.5)                 (1.9)
 Net valuation (loss)/gain on investment property                                            13.5                    3.5                 17.3
 Joint venture (gains)/loss                                                                    0.4                   0.1                   2.4
 Refinancing costs                                                                               -                     -                 27.4
 EPRA earnings                                                                                5.1                    6.7                 12.7

 Weighted average number of shares                                                  518,056,505           518,513,409           518,513,409

 EPRA earnings per share (pence)                                                              1.0                    1.3                   2.5

Past performance is not a guide to future performance and may not be repeated. The value of investments and the income from them may go down as
well as up and investors may not get back the amounts originally invested.
Source: Schroders, November 2020.

30
Balance sheet overview
Net LTV of 25.9%
–    The Company has two debt facilities – a £129.6 million long term fixed loan and a £52.5 million revolving credit facility –
     providing operational flexibility. The table below is as at 30 September 2020:

Lender             Loan         Maturity                  Total interest     Assets Value       Loan to Value       LTV ratio          Interest cover ICR ratio
                   (£m) 1                                 rate (%)           (£m)               ratio (%)2          covenant (%)2      ratio (%)3     covenant (%)3

Canada Life        129.6        50%: 15/10/2032           2.5 4              254.1              51.0                65                 359                185
                                                                                                (43.8 net of
                                50%: 15/10/2039
                                                                                                cash in facility)
RBS                52.55        03/07/2023                1.7 6              104.8              50.1                65 7               871                185

–    The Company’s consolidated net loan to value is 25.9% as at 30 September 2020
     – Total debt £182.1 million, portfolio value of £397.8 million and cash of £78.9 million
     – The Company’s target leverage range is 25-35%
–    The debt facilities are secured against the Company’s assets. The Company retains uncharged properties valued at £38.9
     million as at 30 September 2020

Source: Schroders as at September 2020. 1 Balance as at 30 September 2020.
2 Loan to Value (‘LTV’) is the loan balance divided by the property value as at 30 June 2020.

3 For the quarter preceding the Interest Payment Date (‘IPD’), ((rental income received – void rates, void service charge and void insurance)/interest paid). In addition,

there is a forward ICR covenant of for the four quarters following the IPD (rental income to be received void rates, void service charge and void insurance)/interest
paid).
4 Fixed total interest rate for the loan term.

5 Facility drawn at 30 June 2020 from a total facility of £52.5 million.

6 Total interest rate as at 30 June 2020 comprising 3 months LIBOR of 0.14% and the margin of 1.6% at an LTV below 60% and a margin of 1.90% above 60% LTV.

7 This covenant drops to 60% after year three of the five-year term.

31
£129.6 million Canada Life Loan
Two main covenant tests which are closely monitored by the Manager
–     The Canada Life security pool comprises of 32 assets valued at £254.1 million, with the metrics below as at 30 September 2020

                            Loan to Value (‘LTV’)                                                Interest Cover Ratio (‘ICR’)
                                          As at 30 September 2020              Actual from quarter to September 2020
    Loan (£m)                                       129.6                      Rent (£m)                                        £3.3m

    Portfolio Value (£m)                            254.1                      Non-recoverable Costs (£m)                      (£0.4m)

    Gross Loan to Value (%)                         51.0%                      Net Rent (£m)                                    £2.9m

    Cash held in Facility (£m)                      18.3                       Interest (£m)                                    £0.8m

    Net Loan to Value (%)                           43.8%                      Interest Cover Ratio (%)                         359%

    Covenant (%)                                    65%                        Covenant (%)                                     185%

–    Net Loan to Value on the secured assets against this loan is 43.8%. On this basis, a decline of 33% in the property value could be sustained
     prior to the 65% covenant being breached
–    The ICR is 359% based on actual net rents. A 48% fall in net income could be sustained prior to 185% covenant being breached. Assuming
     25% non-recoverable costs in addition to rental declines, this equates to 34% rent decline
–    The Company has additional flexibility to add cash and assets to the facility to further improve cover against loan covenants

Source: Schroders as at November 2020.

32
Important Information
Marketing material for professional clients only.
Past performance is not a guide to future performance and may not be repeated. The value of investments and the income from them may go
down as well as up and investors may not get back the amount originally invested. Exchange rate changes may cause the value of any overseas
investments to rise or fall.
Schroders has expressed its own views and opinions in this document and these may change.
This information is not an offer, solicitation or recommendation to buy or sell any financial instrument or to adopt any investment strategy.
Nothing in this material should be construed as advice or a recommendation to buy or sell. Information herein is believed to be reliable but we
do not warrant its completeness or accuracy.
Any data has been sourced by us and is provided without any warranties of any kind. It should be independently verified before further
publication or use. Third party data is owned or licenced by the data provider and may not be reproduced, extracted or used for any other
purpose without the data provider’s consent. Neither we, nor the data provider, will have any liability in connection with the third party data.
The material is not intended to provide, and should not be relied on for accounting, legal or tax advice. Reliance should not be placed on any
views or information in the material when taking individual investment and/or strategic decisions. No responsibility can be accepted for error of
fact or opinion.
Any references to securities, sectors, regions and/or countries are for illustrative purposes only.
Schroders will be a data controller in respect of your personal data. For information on how Schroders might process your personal data, please
view our Privacy Policy available at www.schroders.com/en/privacy-policy or on request should you not have access to this webpage.
The forecasts stated in the presentation are the result of statistical modelling, based on a number of assumptions. Forecasts are subject to a
high level of uncertainty regarding future economic, and market factors that may affect actual future performance. The forecasts are provided
to you for information purposes as at today's date. Our assumptions may change materially with changes in underlying assumptions that may
occur, among other things, as economic and market conditions change. We assume no obligation to provide you with updates or changes to
this data as assumptions, economic and market conditions, models or other matters change
Schroder Real Estate Investment Trust (‘SREIT’) is a real estate investment company with a premium listing on the Official List of the UK Listing
Authority and whose shares are traded on the Main Market of the London Stock Exchange. On 1 May 2015 SREIT converted to UK-REIT status.
SREIT continues to be an authorised closed ended investment scheme registered in Guernsey with number 41959. Registered office: Royal Bank
Place, Glategny Esplanade, St Peter Port, Guernsey GY1 2HS

33
Important Information (continued)
Risk considerations of The Real Estate Investment Trust
Investments in real estate are relatively illiquid and more difficult to realise than equities or bonds. Yields may vary and are not guaranteed. The
use of gearing is likely to lead to volatility in the Net Asset Value (‘NAV’) meaning that a relatively small movement either down or up in the value
of the Company’s total assets will result in a magnified movement in the same direction of that NAV. There is no guarantee that the market price
of shares in Investment Companies such as SREIT will fully reflect their underlying NAV. The value of real estate is a matter of a valuer’s opinion
rather than fact.
The trust may be concentrated in a limited number of geographic regions, industry sectors, markets and/or individual positions. This may result
in large changes in the value of the fund, both up or down, which may adversely impact the performance of the funds.
The Company may borrow money to invest in further investments, this is known as gearing. Gearing will increase returns if the value of the
assets purchased increase in value by more than the cost of borrowing, or reduce returns if they fail to do so.
Use of MSCI data and indices: © and database right MSCI and its Licensors 2013. All rights reserved. IPD has no liability to any person for any
losses, damages, costs or expenses suffered as a result of any use of or reliance on any of the information which may be attributed to it

For your security, communications may be recorded or monitored.
Issued in November 2020 by Schroder Real Estate Investment Management Limited, 1 London Wall Place, London EC2Y 5AU. Schroder Real
Estate Investment Management Limited is authorised and regulated by the Financial Conduct Authority. Registration number 1188240 England.
UP000206

34
Contact
Duncan Owen, Nick Montgomery, Rick Murphy

Schroder Real Estate
Investment Management Limited,
1 London Wall Place, London EC2Y 5AU.

schroders.com
You can also read