A dust particle based technique to measure potential profiles in a plasma - export.arXiv.org
←
→
Page content transcription
If your browser does not render page correctly, please read the page content below
A dust particle based technique to measure potential profiles in a plasma
                                                              Garima Arora,1, a) P. Bandyopadhyay,1 M.G. Hariprasad,1 and A. Sen1
                                                              Institute For Plasma Research, HBNI, Bhat, Gandhinagar,Gujarat, India, 382428
                                                              (Dated: 17 September 2021)
                                                              A simple approach to measure the potential profile in a plasma based on the visualization of charged tracer
                                                              dust particles is reported. The method is used to experimentally determine the potential around a grounded
                                                              wire that is mounted on the cathode of a DC glow discharge. Argon plasma is produced in a Π–shaped Dusty
                                                              Plasma Experimental (DPEx) device. The tracer particles, consisting of a few micron sized mono-dispersive
                                                              Melamine Formaldehyde (MF) grains, are made to flow over the grounded wire by suitable variations in the
                                                              background gas flow. By a visual tracking of the individual particle trajectories, that yields their positions
arXiv:1712.01566v2 [physics.plasm-ph] 27 Aug 2018

                                                              and velocities at various times, the potential values at these positions are directly estimated by using energy
                                                              conservation arguments. The results agree very well with conventional probe based measurements. The
                                                              technique is free of some of the inherent limitations of probe based diagnostics and offers a direct and
                                                              minimally invasive means of visualizing potential profiles in a plasma.

                                                    I.   INTRODUCTION                                              equilibrium electric field13 and the potential structures
                                                                                                                   in the sheath are studied18 by looking at the dust par-
                                                       Sheath formation is an ubiquitous phenomenon when-          ticle’s equilibrium position in the associated potentials
                                                    ever a plasma is in contact with a material surface and        and field structures. Dust particles are used as a probe
                                                    these fundamental potential structures have been ex-           to estimate the sheath profile in the radial direction of
                                                    tensively studied1–4 both theoretically and experimen-         a RF discharge14,15,21 by resonating the particle motion
                                                    tally over the past few decades. A sheath is basically a       with an applied low frequency AC signal in the central
                                                    space charged region that develops between the physical        pixel of a segmented adaptive electrode. Hartmann et
                                                    boundary (e.g. the wall, electrodes etc.) and the plasma,      al.16 rotated dust particles and estimated the horizon-
                                                    essentially because of the difference in the mobility of       tal electric field by balancing the centrifugal force with
                                                    the electrons and ions that leads to a preferential neg-       the electrostatic force. The nature of these perturbation
                                                    ative charging of the wall. Despite the long history of        is studied by using suspended particles as tracers. In
                                                    research on sheaths there still remain many open ques-         contrast to these single particle tracer studies, that are
                                                    tions relating to their structure and dynamics and the         mainly aimed at diagnosing sheath potential structures
                                                    subject continues to receive active attention both at a        in a plasma, E. Thomas and collaborators have over the
                                                    fundamental level and in the context of its wide variety       past few years used the Particle Image Velocimetry (PIV)
                                                    of applications.                                               technique to study the internal dynamics of dust clouds
                                                    Recently there has been a growing interest in dusty            as well as their interactions with high speed charged par-
                                                    plasma flow experiments and the interaction of flows with      ticle streams22–28 . However, for measurements of plasma
                                                    potential structures in the plasma. A notable example is       potential structures such as sheath profiles it is more con-
                                                    an experimental observation of precursor solitons5 in a        venient to track a single dust particle which acts as a
                                                    dusty plasma medium caused by a supersonic flow of the         non-perturbative microprobe. Most past studies using
                                                    dusty plasma over a stationary electrostatic potential hill.   the microprobe methodology have relied on a series of
                                                    The shape and size of the potential hill was shown to de-      static local measurements to map the profile of plasma
                                                    termine the type of nonlinear waves and structures that        potential structures. In our present work we employ the
                                                    got excited. The experiment highlighted the need for           microprobe in a dynamical fashion by continuosly track-
                                                    precise measurements of the potential structures around        ing the trajectory of a moving particle to provide a direct
                                                    such floating/biased electrodes in order to obtain a bet-      visualization of the potential profile. By launching the
                                                    ter understanding of the nonlinear excitation process and      trace particle at different velocities it is possible to probe
                                                    a more realistic theoretical interpretation of the same.       different regions of the potential structure. Our work
                                                       A variety of electrostatic probes namely, Langmuir          is motivated by the need to know the size and shape
                                                    probes6,7 , floating and laser heated emissive probes7–12      of such potentials in flowing dusty plasma experiments
                                                    are commonly used to measure the space and plasma              that are aimed at exciting nonlinear wake structures5,29 .
                                                    potential profiles even in the sheath region in a variety      We demonstrate this method experimentally by measur-
                                                    of plasmas. The use of dust particles as microprobes           ing the potential profile around a grounded wire that is
                                                    in the plasma is another diagnostic technique that has         mounted on the cathode of a DC glow discharge plasma.
                                                    been widely used in the past in various experiments to         Our experimental measurements carried out over a range
                                                    measure the electric field in the sheath region13–21 . The     of discharge parameters are found to be in good agree-
                                                                                                                   ment with conventional measurements made with an
                                                                                                                   emissive probe. Since the small tracer particles act like
                                                    a) Electronic
                                                                                                                   micro probes which essentially do not modify the poten-
                                                                    mail: garimagarora@gmail.com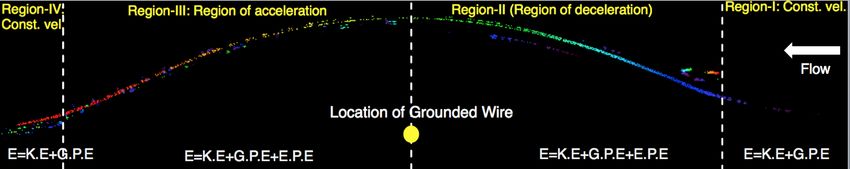
2
tials around the object, this method offers an accurate 30
Distance from Wire (mm)
7
Height from Wire (mm)
(a) (b)
and minimally invasive means of measuring potentials in
6
a plasma. 20
The paper is organized as follows: In the next section 5
(Sec. II) a detailed description of the experimental set up 10
4
along with the production procedure of the plasma and
the introduction of dust tracer particles is given. The 0 3
experimental observations and results are discussed in 10 20 30 40 50 10 20 30 40 50
Velocity (mm/sec) Velocity (mm/sec)
Sec. III. Sec. IV provides a brief summary and discussion
on our findings.
FIG. 2. Variation of (a) the closest approach and (b) the
height achieved by a 4.45 µm particle above the charged wire
versus the velocity of the micro particle.
II. EXPERIMENTAL SET-UP
to a base pressure of 0.1 Pa by a rotary pump. Argon gas
is then flushed in the device several times with the help
of a gas flow controller and every time the vacuum vessel
is again pumped down to the base pressure to remove
impurities from the vessel. Finally the working pressure
is set to 10-20 Pa by adjusting the pumping rate and the
gas flow rate. A plasma is then initiated by applying
a voltage in the range of 280 to 360 V over which the
plasma current varies from 1 to 10 mA. With the creation
of a plasma the wire mounted on the grounded cathode
acquires a sheath around it. The measurement of the
sheath potential structure is the main objective of our
present experiment.
A few mono-dispersive MF particles of radius a = 4.45
µm and mass md = 6.1 ×10⁻¹³ kg are introduced into
the plasma by shaking a dust dispenser. In the plasma
environment these particles get negatively charged and
levitate in the cathode sheath region. These micro parti-
cles levitate ∼ 4.5 mm above the wire. The exact height
of the levitation depends on the discharge condition to
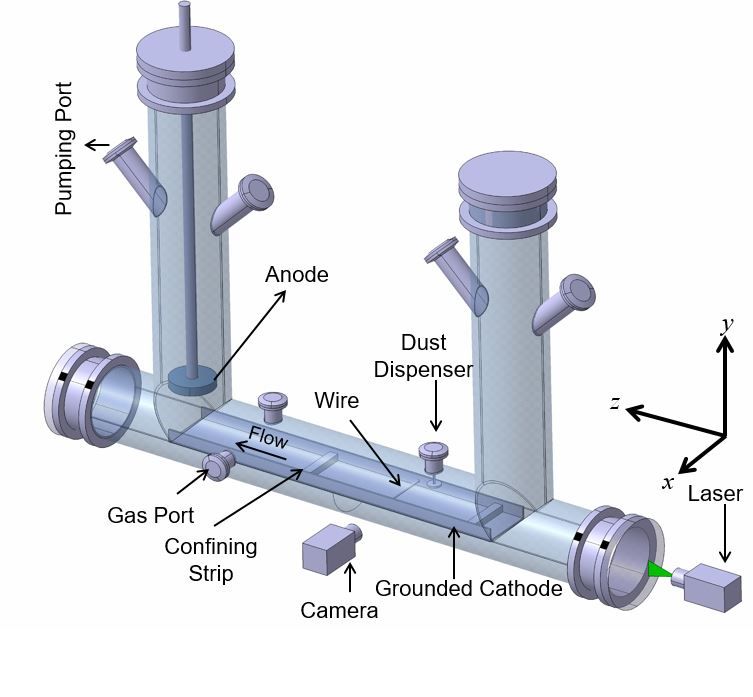
FIG. 1. A schematic diagram of dusty plasma experimental attain the equilibrium. To illuminate these micro parti-
(DPEx) setup. cles in the y − z plane, a green laser is used. The Mie
scattered light from the dust particles is captured by a
The experiments are performed in a Π-shaped Dusty CCD camera and recorded in a computer for analysis of
Plasma Experimental (DPEx) device, whose schematic the dust dynamics.
diagram is shown in Fig. 1. The experimental device has To initiate the flow of dust particles over the charged
several radial and axial ports for the purpose of pump- wire, the single gas injection technique is used as dis-
ing, feeding gas, mounting electrodes, introducing the cussed in detail in Ref.31 . In this technique, an equilib-
dust particles etc. The system geometry and its asso- rium condition of the dust particles is achieved at first by
ciated diagnostics have been explained in greater detail adjusting the pumping speed and the gas flow rate. The
elsewhere30 . To produce the plasma, a stainless steel cir- stationary dust particles are then made to flow by a sud-
cular disc is used as an anode whereas a long grounded den momentary decrease of the gas flow rate. During the
rectangular plate serves as a cathode. The edges of the flow, the particles are seen to move from right to left and
cathode are bent to provide radial confinement of the they come back to their original position when the flow
charged micro particles and two additional strips are kept rate difference is set to original value. When the flow rate
at a distance of 20 cm to provide axial confinement. A difference is increased beyond 5.5 sccm/min the particles
copper wire is mounted in between these two strips which move towards the pump with a higher velocity and cross
acts as a stationary charged object and provides a poten- the potential barrier created by the wire and finally fall
tial barrier to the horizontal flow of the charged particles. down on the left edge of the glass tube where the cathode
This wire is always connected to ground throughout our ends. The trajectory of the particle, as video recorded, is
experiments; however there is a provision to keep the wire then used to find the strength and profile of the barrier
in the floating potential or at an intermediate potential. produced by the wire. We discuss this in detail in the
To begin with, the experimental vessel is pumped down next section.3
FIG. 3. Color plot showing the trajectory of the particle, having radius a = 4.45 µm, while crossing the charged wire at a
pressure of p=12 Pa and a discharge voltage Vd = 320 V. The filled circle represents the location of the wire whereas the arrow
represents the direction of flow.
12
V d =310 V tial hill is seen to be ∼ 5 mm and the height achieved
y - Position (mm)
(a)
10 V =300 V
d by the particle is ∼ 7 mm for a velocity of ∼ 5 cm/sec.
With a further increase of the gas flow rate and hence an
8
increase in the magnitude of the terminal velocity, the
6 particles are found to overcome the confining potential
and do not come back in the well.
4
10 (b)
p=11 Pa Fig. 3 depicts the trajectory of a particle while mov-
p=12 Pa
y - Position (mm)
ing over the grounded wire. In this case, the terminal
8
velocity crosses the threshold value (∼ 6 cm/sec) so that
6 it flows over the grounded wire and crosses the hill. The
violet color (extreme right) of the trajectory indicates
4
the particle coordinates at the initial time whereas the
-20 -15 -10 -5 0 5 10 15 20 red color (extreme left) indicates the coordinates of the
z - Position (mm) same particle at the final stage of its journey. The big
solid circle shows the position of the charged wire. It is
FIG. 4. A plot showing the trajectories of a particle of clear from the figure that the particle almost traces the
radius a = 4.45 µm for different (a) discharge voltages and sheath-plasma boundary (caused by the grounded poten-
(b) background neutral pressures.
tial wire) on its way. Very far from the potential wire,
the particle moves with the terminal velocity (Region-
I) towards the confining strip, climbs up (Region-II) the
III. RESULTS AND DISCUSSION potential hill created by the wire and then moves down
(Region-III) from the hill and finally (Region-IV) trav-
els again with almost the same terminal velocity that
As discussed above, the injected particles attain a sta-
it started with. Using the coordinates of the individual
ble equilibrium when the pumping rate gets exactly bal-
particles we will now deduce the height and width of the
anced by the gas flow rate. In this situation the particles
potential hill and also delineate the axial and radial pro-
are observed to be confined in the potential well between
files of the potential structure.
the right strip and the potential hill of the grounded
wire. The particles display only small random displace- Fig. 4 displays the particle trajectories (similar to
ments due to their thermal energy. Keeping the pumping Fig. 3) for two different discharge voltages (Fig. 4(a))
speed constant when the gas flow rate is decreased, the and background neutral gas pressures (Fig. 4(b)) when
particles are seen to move towards the pump (right to all other discharge parameters are kept constant. It is
left) and approach the grounded wire. If the velocities seen that the height and the width of the potential hill
of these particles are not sufficient to enable them to go increases with the decrease of the discharge voltages for
over the potential hill, they stay inside the potential well a background pressure of p = 12 Pa (see Fig. 4(a)). A
but attain an equilibrium position closer to the wire. The similar trend is seen when the pressure is reduced for a
variation of this closest distance of approach and the par- particular discharge voltage Vd = 310 V. It is also seen
ticle’s height above the wire as a function of its velocity from Fig. 4 that the z-coordinates of the particles are less
are shown in Fig. 2 for a gas pressure of p = 12 Pa and spaced when the particles ride the hill near ∼ z = 7 mm
discharge voltage of Vd = 320 V. It is clear from Fig. 2(a) whereas the coordinates are well spaced when the parti-
and Fig. 2(b) that the distance of closest approach in the cles come down from the hill near ∼ z = −7 mm. This es-
axial direction decreases and the height of the particle sentially means that the particle decelerates while climb-
increases with an increase of the particle velocity. In this ing up the hill whereas it gets accelerated when moving
particular condition, the closest distance from the poten- down the hill. Here the time interval of two consecutive4
22 14 18 9
Width of the Potential hill (mm)
Width of the Potential hill (mm)
Height of Potentential hill (mm)
Height of Potentential hill (mm)
(a) (b)
20 12 16 8
18 10 14 7
16 8 12 6
14 6 10 5
285 290 295 300 305 310 315 320 10 11 12 13 14 15 16
Discharge Voltage (V) Pressure (Pa)
FIG. 5. Variation of width (star) and height (open circle) of the potential hill created by the charged wire with (a) discharge
voltages and (b) background neutral gas pressure.
frames is set to be ∼ 9.3 msec.
)(J)
10
Fig. 5 shows the variation of the width and height of (a)
−15
8
the potential hill created by the charged wire over a wide
K.E. (× 10
range of discharge parameters. It is seen from Fig. 5(a), 6
that both the width and the height of the hill decrease
4
with the increase of the discharge voltage. A similar
trend of the changes in the width and height is observed )(J)
when the pressure is increased from 11 to 15 Pa as shown 7 (b)
−14
in Fig. 5(b). In both the cases when the voltage or the
P.E. (× 10
6
pressure is increased, the plasma density increases which
results in a decrease of the plasma Debye length. As 5
the cathode sheath thickness is a function of the Debye 4
length, hence the sheath thickness around the grounded 14
Wdrag(× 10−16)(J)
potential wire decreases with the increase of discharge 12 (c)
voltage and the background gas pressure. 10
To estimate the axial and radial potential profiles 8
around the grounded object, we can make use of the en- 6
ergy conservation relation, 4
0 (d)
1 1
md v 2 + md gh = md v 2 + md gh + Qφ (1)
2 2
φ (V)
I,IV II,III. −5
where, md , v, and h denote the mass, velocity and height
of the particles (above the cathode tray), respectively. −10
φ is the electrostatic potential created by the grounded
0 0.05 0.1 0.15 0.2 0.25 0.3 0.35
wire, g is the acceleration due to gravity and Q(= −Zd e time (s)
= 4π0 aφs ), where Zd is dust charge number, e is the
electronic charge and φs is the dust surface potential for FIG. 6. Time evolution of (a) kinetic energy, (b) gravita-
an Argon plasma (which is negative in laboratory dusty tional potential energy, (c) energy loss due to neutral drag
plasmas), 0 is the permittivity of free space, a is the ra- force and (d) electric potential of a particle of radius a = 4.45
dius of the dust particle. The subscripts I,II,III,IV refer µm while riding over a charged object for a given pressure
to the various regions of the trajectories as indicated in p = 12 Pa and voltage Vd = 320 V.
Fig. (3). As shown in Fig. 3, when the particles stay far
from the wire (e.g., Region-I and Region-IV) they move
only with the constant kinetic energy (K.E)) and the by the wire can be expressed as:
gravitational potential energy (G.P.E). But when they
md 1 2 1 2
enter in the sheath region, the dynamics of the parti- φ(z, y) = v + gh − v − gh (2)
cles get changed and they start feeling the presence of Q 2 d Z→∞ 2
the charged wire. Hence in Region-II and Region-III, the q
components of total energy are kinetic energy, gravita- where v = vz2 + vy2 and h is the height at a particular
tional potential energy and electrostatic potential energy axial location z and vd is the terminal velocity in Region-
(E.P.E). As a result the potential profile φ(z, y) created I. By tracking individual particles, the potential profile5
14
20
(a) (b)
12
? max (V)
? max (V)
15
10
8
10
6
285 290 295 300 305 310 315 320 10 11 12 13 14 15 16
Discharge Voltage (V) Pressure (Pa)
FIG. 7. Variation of maximum potential calculated from potential profiles for different discharge (a) voltages and (b) gas
pressure.
10.5 the constancy of Te ensures that the charge remains al-
Height of hill (mm)
(a) 18 (b)
10 most constant35,36 . When these micro-probes are made
? max (V)
16 to flow over a grounded wire, their kinetic energy and
9.5 14 potential energy profiles are measured and it is seen that
9 12
the particles decelerate while riding up the potential hill
and they accelerate while coming down from the hill (see
10
10 15 20 25 10 15 20 25
Fig. 6(a)). Fig. 6(b) indicates that the particle starts
Flow-rate diff. (sccm/min) Flow-rate diff. (sccm/min) its journey at a height of ∼ 4.5 mm from the wire and
then attains a maximum height and then ends its jour-
FIG. 8. A plot showing the variation of (a) the height of ney almost at the same height that it started from. It
the potential with flow rate difference and (b) the maximum is to be noted that the energy loss due to dust neutral
potential. friction is not taken into account in Eq. (1). This is a
reasonable assumption as it is seen experimentally that
the particles display the same kinetic energy and height
φ(z, y) along the trajectory can be estimated with the after climbing down from the potential hill indicating
help of Eq. (2). that there is negligible energy loss due to collisional fric-
For determining the potential profile, we first need tion with the neutrals. This is a consequence of the ex-
to estimate the charge acquired by the dust particle periments being carried out in a low pressure regime.
in equilibrium. To estimate the dust charge, a Col- However, in a higher pressure range, where collisional ef-
lision Enhanced plasma Collection (CEC) model32,33 fects may be important, one should consider the instan-
has been used to first calculate the surface potential, taneous energy loss due to dust-neutral collisions. This
R s(t )
φs ∼ −z̃KB Te /e of the dust particle by solving the drag force is calculated as Wdrag = s(t12) F~n .d~s where
electron and ion flux balance equations numerically and Fn = N mn πa2 vtn vg 22 and s(t1 ), s(t2 ) are the positions
subsequently an estimate of the charge is made using of the particle at times t1 and t2 along its trajectory. N ,
Q = 4π0 aφs assuming that the dust particles are spher- mn , a, vtn , vg are the number density of neutrals, mass of
ical in shape. For our experimental conditions p = 11−15 neutral, radius of dust particle, thermal velocity of neu-
Pa, Te = 4 − 2.5 eV and ni = 0.9 − 2 × 10¹⁵ /m334 , z̃ and trals and dust grain velocity, respectively. For our experi-
Q come out to be ∼ 1.34 − 1.56 and ∼ 2.6 − 1.9 × 10⁻¹⁵ mental conditions this loss varies from ∼ 4.2−14.2×10⁻¹⁶
C, respectively. It is to be noted that for the basic J as shown in the Fig. 6(c) which is nearly one order of
plasma parameters such as Te and ni , we have used val- magnitude smaller than the kinetic energy and two or-
ues previously obtained from actual measurements us- ders of magnitude than the gravitational potential energy
ing a single Langmuir probe for discharges of similar and hence its neglect is justified. With the help of the
conditions. These have been discussed and reported kinetic and gravitational potential energy profiles, the
in34 . Here, we have assumed that the charge of the electrostatic potential profile is estimated using Eq. (2)
dust particle is almost constant and does not change dur- and is shown in Fig. 6(d). The electrostatic potential
ing its journey. This assumption is based on findings profile follows an almost a symmetric profile around the
from earlier experiments carried out in the same device wire and a similar kind of potential profile was obtained
and for similar conditions30 . These experiments have when the floating/plasma potentials were measured using
shown that the plasma parameters remain nearly con- Langmuir and emissive probes30 .
stant along the axial direction (along z). In particular,6
14
(a) z=0 10 (b)
12 y=6.6
8 y=5.58
10 z=6
? (V)
? (V)
8 6
y=4.57
6 4
z=16 y=3.56
4
2
2
4 6 8 10 0 5 10 15
Height of Potential hill (mm) Axial Direction (mm)
FIG. 9. (a) Radial potential profiles at z=0, z= 6 mm and z=16 mm. z=0 corresponds to the location of the wire. and (b)
Axial potential profiles at y=6.6, y=5.58 mm, y=4.57 mm, y=3.56 mm
Fig. 7 shows the variation of the maximum potential and y = 3.56 mm. It is clear from this figure that the
strength (near the location of the wire) created by the variation of potential is not significant as we move away
wire with a variation of the discharge parameters. The from the wire axially for a particular radial location.
strength of the potential is seen to increase with an in- Finally we would like to remark that our experimen-
crease in the discharge voltage for a constant neutral gas tal findings have great relevance for past and future dust
pressure p = 12 Pa (Fig. 7(a)) or alternatively with an in- flow experiments aimed at excitation of linear and non-
crease in the neutral pressure keeping the discharge volt- linear wave structures. In the past experiment of Jaiswal
age fixed at Vd = 310 V (Fig. 7(b)). A similar trend was et al.5 , precursor solitons were excited by a supersonic
observed earlier in experiments reported by Jaiswal et mass flow of the dust particles over a stationary electro-
al.30 To fully explore the radial and axial potential pro- static potential hill. A theoretical explanation of these
files around the grounded wire, we have varied the dif- excitations based on the forced Korteweg-deVries (fKdV)
ference of gas flow rate (and hence the terminal velocity) model equation was provided by assuming the shape of
over a wide range such that in all the cases the parti- the potential hill to be Gaussian and using arbitrary val-
cles can overcome the potential barrier. In each case, the ues of the amplitude and width of this potential to solve
particles gain different terminal velocities and as a result the model equation. By doing so they were only able to
in order to satisfy the conservation of total energy, they provide a qualitative comparison between the experimen-
cross the potential hill at different heights. It is observed tal and theoretical results. Our present results not only
that the height of the potential hill decreases when the confirm the shape of the potential to be close to a Gaus-
difference of gas flow rate increases as shown in Fig. 8(a). sian but provide experimental measures of the amplitude
This figure is plotted for a constant gas pressure of p = 12 and width of the potential for carrying out a quantita-
Pa and a constant discharge voltage of Vd =320 V. The tive comparison with modeling results. Furthermore, our
strength of the potential, estimated from the conserva- measurements using the particle tracing technique also
tion of energy, at the peak of the hill is shown in figure show that the amplitude and width of the potential can
Fig. 8(b). It clearly indicates that for different values change with the discharge voltage and the background
of flow rate difference the strength of potential decreases pressure as displayed in Fig. 5 and Fig. 6 respectively.
with height. These results offer valuable clues for further means of ma-
To construct the radial potential profile, we plot the nipulating the size of the potential and can prove useful
variation of potential strength with height as shown in for planning future experiments on flow induced nonlin-
Fig. 9. Fig. 9(a) shows the radial potential variation for ear excitations over a wider range of parameter space.
three different axial locations z = 0 mm, 6 mm and 16
mm respectively, where z = 0 mm corresponds to the
location of the wire. It is to be noted that Fig. 8(a) and IV. CONCLUSION
Fig. 8(b) have been used to plot Fig. 9(a). A similar
exercise is done to construct the potential for other two In conclusion, we have experimentally demonstrated
axial locations. Fig. 9(a) shows that the magnitude of the a simple technique to measure the potential around a
potential increases in all the cases when one goes away charged object using the flow of a few tracer dust par-
from the sheath created by the grounded wire towards the ticles. The experiments have been carried out in the
bulk plasma in radial direction. However, the potential DPEx device in which an Argon discharge was initiated
rise is maximum at the location of the wire as compared between a disc shaped anode and a grounded long cath-
to the other axial locations. Fig. 9(b) shows the variation ode. A few micron sized dust particles were then intro-
of potential strength in axial direction for four different duced into the plasma, which were found to float near
radial locations y = 6.6 mm, y = 5.58 mm, y = 4.57 mm the cathode sheath boundary. A steady state equilib-7
rium of the dust particles was achieved by a fine tuning Fellowship scheme.
of the pumping speed and gas flow rate. A flow of the
dust particles was then initiated by a sudden decrease of 1 K. U. Riemann, J. Appl. Phys. D 24, 493 (1991).
the mass flow rate of neutral gas. As a result the par- 2 S. Robertson, Plasma Phys. Control. Fusion 55, 093001 (2013).
3 R. N. Franklin, J. Appl. Phys. D 36, R309 (2003).
ticles traveled over the grounded wire which was placed
4 K. F. Stephens and C. A. Ordonez, J. Appl. Phys. 85, 2522–2527
on the path of the particles. From a knowledge of the in-
(1999), https://doi.org/10.1063/1.369845.
stantaneous position of the particles and their velocities, 5 S. Jaiswal, P. Bandyopadhyay, and A. Sen, Phys. Rev. E 93,
their potential and kinetic energies were estimated over a 041201 (2016).
wide range of discharge parameters. The axial and radial 6 R. L. Merlino, Am. J. Phys. 75, 1078–1085 (2007),
electrostatic potential around the charged object was es- https://doi.org/10.1119/1.2772282.
7 L. Tonks and I. Langmuir, Phys. Rev. 34, 876–922 (1929).
timated by employing the conservation of total energy. 8 J. P. Sheehan and N. Hershkowitz, Plasma Sources Sci. Technol
In this technique, the particles act as dynamic micro- 20, 063001 (2011).
probes and measure the potential very precisely without 9 M. J. Goeckner, J. Goree, and T. E. Sheridan, Phys. Fluids B
significantly perturbing the potential around the charge 4, 1663–1670 (1992), https://doi.org/10.1063/1.860074.
10 P. D. Goldan, Phys. Fluids 13, 1055–1059 (1970),
object.
http://aip.scitation.org/doi/pdf/10.1063/1.1693008.
Our experimental results show that the potential 11 V. P. Kella, P. Mehta, A. Sarma, J. Ghosh, and
around a small charged object has a symmetric profile P. K. Chattopadhyay, Rev. Sci. Instrum. 87, 043508 (2016),
in the axial direction whereas it has a parabolic shape in https://doi.org/10.1063/1.4945693.
12 R. Schrittwieser, C. Ionita, P. Balan, R. Gstrein, O. Grulke,
the radial direction and the dimension of the potential
shrinks in all directions with an increase of the discharge T. Windisch, C. Brandt, T. Klinger, R. Madani, G. Amaran-
dei, and A. K. Sarma, Rev. Sci. Instrum. 79, 083508 (2008),
voltage and the background neutral gas pressure. In our https://doi.org/10.1063/1.2968114.
experiments, we have used a grounded wire as a sam- 13 H. Kersten, H. Deutsch, M. Otte, G. Swinkels, and G. Kroe-
ple problem to estimate the potential profile around it. sen, Thin Solid Films 377-378, 530 – 536 (2000), international
It does not mean that the method is restricted to such Conference on Metallurgic Coatings and Thin Films.
14 R. Basner, F. Sigeneger, D. Loffhagen, G. Schubert, H. Fehske,
a profile. For any shape of the potential, the instanta-
and H. Kersten, New J. Phys. 11, 013041 (2009).
neous height and the velocity of the particle will change 15 A. A. Samarian and B. W. James, Plasma Phys. Control. Fusion
and accordingly provide us with values of the potential 47, B629 (2005).
16 P. Hartmann, A. Z. Kovács, J. C. Reyes, L. S. Matthews, and
at different points.
The presence of plasma homogeneity is a major sim- T. W. Hyde, Plasma Sources Sci. Technol. 23, 045008 (2014).
17 B. M. Annaratone, T. Antonova, H. M. Thomas, and G. E.
plifying factor in our experiments. However its absence Morfill, Phys. Rev. Lett. 93, 185001 (2004).
does not invalidate our approach. Inhomogeneity would 18 G. Schubert, M. Haass, T. Trottenberg, H. Fehske, and H. Ker-
only change the magnitude of the charge of dust particles sten, Contrib. Plasma Phys. 52, 827–835 (2012).
19 S. V. Vladimirov, K. Ostrikov, and A. A. Samarian, Physics and
(due to the change of plasma parameters) at different lo-
cations. The potential, in that case, can still be measured applications of complex plasmas (World Scientific, 2005).
20 G. Schubert, R. Basner, H. Kersten, and H. Fehske, Eur. Phys.
by following the same technique with the known value of J. D 63, 431–440 (2011).
charge. Thus this technique can not only be implemented 21 B. M. Annaratone, M. Glier, T. Stuffler, M. Raif, H. M. Thomas,
in such devices30,37–40 whose electrode (plasma) config- and G. E. Morfill, New J. Phys. 5, 92 (2003).
22 E. Thomas Jr, Phys. Plasmas 8, 329–333 (2001).
urations are akin to ours but also in devices that have 23 E. Thomas Jr, Phys. Plasmas 9, 17–20 (2002).
more complex electrode configurations. 24 E. Thomas Jr, IEEE Trans. Nucl. Sci. 30, 88–89 (2002).
We believe that this simple technique has potential 25 E. Thomas Jr, New J. Phys. 5, 45 (2003).
advantages over conventional active diagnostic tools like 26 E. Thomas Jr, J. D. Williams, and J. Silver, Phys. Plasmas 11,
probes in flowing dusty plasma experiments as a non- L37–L40 (2004).
27 E. Thomas Jr, Phys. Plasmas 13, 042107 (2006).
invasive diagnostic tool. Like other diagnostics, this tech- 28 E. Thomas and M. Watson, Phys. Plasmas 6, 4111–4117 (1999),
nique also has some disadvantages. To measure the po- https://doi.org/10.1063/1.873672.
tential, one has to initiate a flow of the dust particles 29 S. Jaiswal, P. Bandyopadhyay, and A. Sen, Phys. Plasmas 23,
with respect to the background plasma. In addition, this 083701 (2016), https://doi.org/10.1063/1.4960032.
30 S. Jaiswal, P. Bandyopadhyay, and A. Sen, Rev. Sci. Instrum.
technique allows us to measure the potential only at those
points through which the particle travels. Nevertheless it 86, 113503 (2015).
31 S. Jaiswal, P. Bandyopadhyay, and A. Sen, Plasma Sources Sci.
does provide a simple and visual approach that can find Technol. 25, 065021 (2016).
useful applications in a variety of laboratory and plasma 32 S. A. Khrapak, S. V. Ratynskaia, A. V. Zobnin, A. D. Usachev,
based industrial devices where sheath dynamics can play V. V. Yaroshenko, M. H. Thoma, M. Kretschmer, H. Höfner,
an important role. G. E. Morfill, O. F. Petrov, and V. E. Fortov, Phys. Rev. E 72,
016406 (2005).
33 S. A. Khrapak and G. E. Morfill, Phys. Plasmas 13, 104506
(2006), https://doi.org/10.1063/1.2359282.
34 S.
V. ACKNOWLEDGEMENTS Jaiswal, P. Bandyopadhyay, and A. Sen,
Rev. Sci. Instrum. 86, 113503 (2015),
https://aip.scitation.org/doi/pdf/10.1063/1.4935608.
A.S. thanks the Indian National Science Academy 35 A. Barkan, N. D’Angelo, and R. L. Merlino, Phys. Rev. Lett.
(INSA) for their support under the INSA Senior Scientist 73, 3093–3096 (1994).8
36 J.Goree, Plasma Sources Sci. Technol. 3, 400 (1994). 38 R. L. Merlino, J. R. Heinrich, S.-H. Kim, and J. K. Meyer,
37 V. Fortov, G. Morfill, O. Petrov, M. Thoma, A. Usachev, Plasma Phys. Control. Fusion 54, 124014 (2012).
H. Hoefner, A. Zobnin, M. Kretschmer, S. Ratynskaia, M. Fink, 39 Y. Nakamura and O. Ishihara, Rev. Sci. Instrum. 79, 033504
et al., Plasma Phys. Control. Fusion 47, B537 (2005). (2008), https://doi.org/10.1063/1.2894300.
40 S. K. Sharma, A. Boruah, and H. Bailung, Phys. Rev. E 89,
013110 (2014).You can also read