March 2020 Corporate Presentation - MEG Energy
←
→
Page content transcription
If your browser does not render page correctly, please read the page content below
March 2020 Corporate Presentation
Corporate Priorities
Building on 2019 Success 2020 Priorities
Focus on Debt reduction
free cash flow and financial
generation liquidity • Free cash flow
generation – WTI 70%
Existing production capacity, Free cash flow will continue hedged H120 at >US$59
supported by low operating to be earmarked for debt per barrel, 55% hedged
costs and low sustaining reduction for FY20
capital, generates material • Preserve financial
free cash flow liquidity and strengthen
balance sheet
18% reduction in G&A relative Reduced and extended modified
to 2018
covenant-lite credit facilities to • Increase barrels sold into
2024 high value USGC
Disciplined capital investment ~$630 MM debt reduction to pricing – expect >50%
focused on sustaining current
date, including $132 MM in of sales exposed to
production 2020 USGC pricing in 2H20
via Flanagan capacity
1/3 of sales to higher priced Annualized cash savings of
increase and rail
USGC market; ~US$2.80 / approximately $45 MM
bbl premium on average vs.
De-risked balance sheet - first • On-going focus on
Canada maturity in 2024 efficient, low cost
Highest annual average production
in MEG’s history
operations
2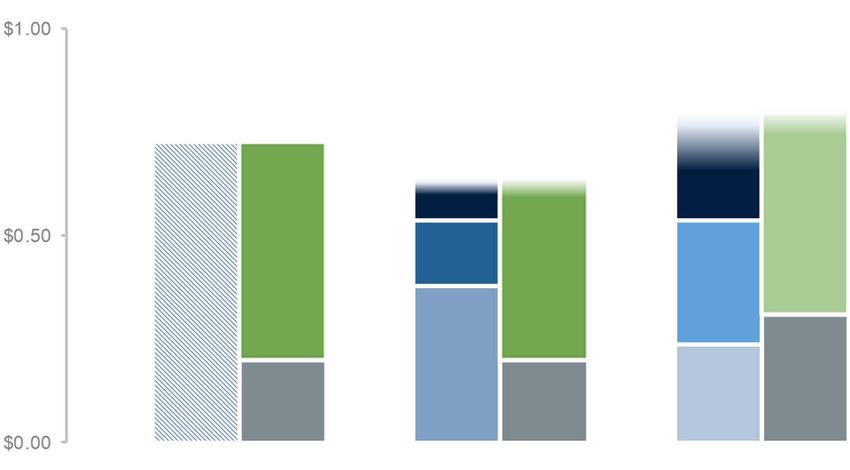
2020 Outlook
Capital budget of $200 million funded from expected adjusted funds flow prioritizes financial strength

 •    Production guidance of 93,000 –                  2020 Capital Budget $200 MM
      95,000 bbls/d includes impact of
      turnaround
                                                                                                              Sustaining and Maintenance
                                                                $40 MM
 •    Capital budget focused on sustaining
      & maintenance                                                                                           Phase 2B brownfield
                                                                                                              completion, field infrastructure,
                                                                                                              regulatory, corporate and other
 •    Guidance includes lowest ever non-
      energy opex and G&A / bbl
                                                                                 $160 MM
 •    2020 cash flow is substantially hedged
      to protect capital program
 •    ~30,000 bbls/d contracted rail capacity
                                                       Operational Guidance
 •    Management remains committed to
      applying all free cash flow above its                                                                                2020 Guidance

      2020 capital investment plan to                    Production1 – average (bbls/d)                                   93,000 – 95,000
      maintain financial liquidity, including
      further debt reduction                             Non-energy operating costs ($/bbl)                                   $4.50 - $4.90

                                                         G&A costs ($/bbl)                                                    $1.75 - $1.85

                                                      1. Blend sales in June / July are expected to be impacted by linefill requirements for volume
                                                      increase from 50 kbbls/d to 100 kbbls/d mid 2020 on the Flanagan South pipeline.

                                                                                                                                                  3
Commodity Price Hedging
 Strategy focused on protecting capital program while providing flexibility to fund debt reduction; ~70% of
 H1 WTI exposure is hedged with 55% hedged in 2020 on average

                                                                                              Q1                Q2                Q3                 Q4
  As of March 3 rd , 2020                                                                                                                                             2020
                                                                                             2020              2020              2020               2020
  WTI Hedges
    WTI Fixed Price Hedges
    Volume (bbl/d)                                                                          72,899            62,395            19,043             16,887            42,806
    Weighted average fixed WTI price (US$/bbl)                                              $58.67            $59.68            $59.38             $59.36            $59.19
     Enhanced WTI Fixed Price Hedges with Sold Put Options
     Volume (bbl/d)                                                                            -                 -              16,870          24,500          10,342
                                                               1
     Weighted average fixed WTI price / Put option strike price (US$/bbl)                     n/a               n/a         $59.38 / $52.00 $59.11 / $52.00 $59.22 / $52.00
     Total WTI Hedge Volume (bbl/d)                                                         72,899            62,395            35,913             41,387            53,148

  WTI:WCS Differential Hedges
          2
    Volume (bbl/d)                                                                          30,150            45,150             32,150            39,150            36,650
     Weighted average fixed WTI:WCS differential at Edmonton (US$/bbl)                     ($20.14)          ($18.50)           ($19.79)          ($19.49)          ($19.39)

  Condensate Hedges
             3
     Volume (bbl/d)                                                                         19,149            23,298            23,208             23,208            22,216
     Average % of WTI landed in Edmonton (%)                                                103%              101%              101%               101%              101%

Note: MEG’s hedging portfolio also includes certain condensate hedges in 2021 and 2022
1. Includes fixed price swap and sold put option entered into for the second half of 2020. At an average 2H20 WTI price of US$52.00 or higher, MEG’s effective hedge price for 2H20
     is US$59.29 per barrel. Illustratively, at an average 2H20 WTI price of US$45.00 and US$35.00, MEG’s effective hedged WTI price for 2H20 is US$55.55 and US$50.20 per barrel,
     respectively.
2. 2020 includes approximately 13,200 bbls/d of physical forward rail blend sales at a fixed WTI:AWB differential.
3. 2020 includes approximately 7,250 bbls/d (annual average) of physical forward condensate purchases. Where applicable, the average % of WTI landed in Edmonton includes
     estimated net transportation costs to Edmonton.

                                                                                                                                                                                  4
Low Breakeven Price in Sustainable Asset
High quality, 10-15% decline rate allows for low sustaining capital, enhancing the sustainability of the
business and financial flexibility
In situ assets have low decline profile (10 – 15% annually)
• Unique thermal oil decline
MEG base
profile results in low annual
production sustaining capital –
decline approximately C$6-8 / bbl
• 2.1 bn bbl of 2P reserves2 at
Christina Lake allows for
MEG shallow decline rate production of ~ 60 years from
drives low full cycle
breakeven economics and existing, well delineated asset
higher free cash flow Significant • Based on low sustaining capital
sustainability
Illustrative advantage in
and attractive operating cost
Permian Base low oil price profile, current full cycle (all
Decline1
~40% in year 1
environment costs to keep production flat)
corporate breakeven ofSignificant Ability to Weather Low Oil Prices
Robust cash flow across range of commodity prices with long-run full-cycle breakeven at4 Year Runway with No Financial Covenants
Substantial runway to continue prioritized debt
reduction Capital Markets Maturity Structure
US$ in Millions
Derisked balance sheet supported by financial
Unsecured note
flexibility provided by undrawn C$800 mm
2nd lien secured note $1,200
modified covenant-lite credit facility with 4 years to
New unsecured note
maturity – no covenants unless drawn > $400 mm $600
~$496
4 years @ 7.000% @ 6.500% @ 7.125%
2020 2021 2022 2023 2024 2025 2026 2027
Comparable Producer Debt Structures
Weighted Average Maturity1
12 10.8 Runway to Nearest Maturity
9.7 Financial
10
flexibility is a
8
6.3 MEG
Years
6 5.4 5.0 5.0 hallmark:
4.8 4.5
3.6 3.6 3.5 3.4 balance
4
2 0.8 4.1 4.1 0.8 1.3 sheet has a
0.2 0.0 3.1 3.2
2.4 1.8 0.0 unique
0
A B C MEG D E F G H I J K combination
of covenant
Modified
Covenant Lite structure and
runway
Covenant
Based
Note: Comparison based on oil and gas peers with enterprise value greater than $1 billion and gas weighting less than 50% including Cenovus, Suncor, Canadian Natural, Baytex, Imperial, Husky,
Seven Gen, Enerplus, Whitecap, Vermillion, and Crescent Point
1. Weighted average maturity calculation assumes revolver is fully drawn; excludes accordion features
7Assets to Access High Value Markets
Strategic marketing assets de-risk the business and enhance net realized bitumen price
1.4 mmbbl
Western Canadian Storage
• Manages Enbridge apportionment
Future 20,000 bbl/d
Edmonton Bruderheim
on TMX
• Access to tidewater and
delivery to growing Asian Hardisty 30,000 bbl/d*
heavy oil market
Enbridge Mainline
rail loading capacity
• Secures apportionment-protected sales
• Sales made FOB at Edmonton, although price
exposure to USGC retained on ~50% of 2020
volumes
40-50% condensate
purchases from USGC Chicago
• Access over-supplied USGC market
• Reduces exposure to AB market volatility
Cushing Enterprise TE
100 mbbl/d Flanagan
South / Seaway
St. James
1.4 mmbbl
on Flanagan South/Seaway (2H20) Bayou Bridge
U.S. storage
• Direct access to USGC • Optimizes Flanagan commitments and exports
• Supply/demand imbalance provides long-term Beaumont / Mont Belvieu
pricing support
• None of capacity is dependent on Line 3 replacement Marine export access
• From MEG assets at Beaumont and St. James
* Based on 100 rail cars per train with 600 bbls / car and 100% efficiency
8Blend Sales by Market
Anticipate growing deliveries to USGC from 1/3 to >50% in H2 2020
Actual 2019 Results Edmonton (US$/bbl) U.S. Gulf Coast (US$/bbl) TOTAL TOTAL
US$/bbl, except as indicated Pipeline FOB Rail Pipeline Delivered Rail (US$/bbl) (C$/bbl)(3)
WTI $ 57.03 $ 57.03 $ 57.03 $ 57.03 $ 57.03 $ 75.67
Differential - WTI:AWB at sales point (15.88) (11.52) (1.28) (3.78) (10.84) $ (14.38)
Blend sales price 41.15 45.51 55.75 53.25 46.19 61.29
Transportation and storage (1) (1.71) (4.28) (10.67) (23.54) (5.70) $ (7.56)
Transportation and storage Christina Lake to Edmonton(2) 1.71 1.71 1.71 1.71 1.71 $ 2.27
AWB sales price, net of transportation $ 41.15 $ 42.94 $ 46.79 $ 31.42 $ 42.20 $ 56.00
Average AWB sales price by location, net of transportation $ 41.36 $ 43.93
Total blend sales - mbbl/d 78 11 36 8 134
% of total sales 58% 9% 27% 6% 100%
Capacity on pipe to USGC doubles in
mid-2020
Over time expect to increase USGC sales
exposure from 1/3 to 2/3 of blend volumes
1. Defined as transportation and storage expenses less transportation revenue, per barrel of blend sales volumes. For reference, total transportation and storage costs per barrel, based on
bitumen sales volumes, were C$10.84/bbl for the year ended December 31, 2019 compared to C$8.42 per barrel for the year ended December 31, 2018.
2. Includes all transportation costs associated with moving barrels of blend from Christina Lake to Edmonton sales point.
3. Results are translated at the average foreign exchange rate of C$1.3269.
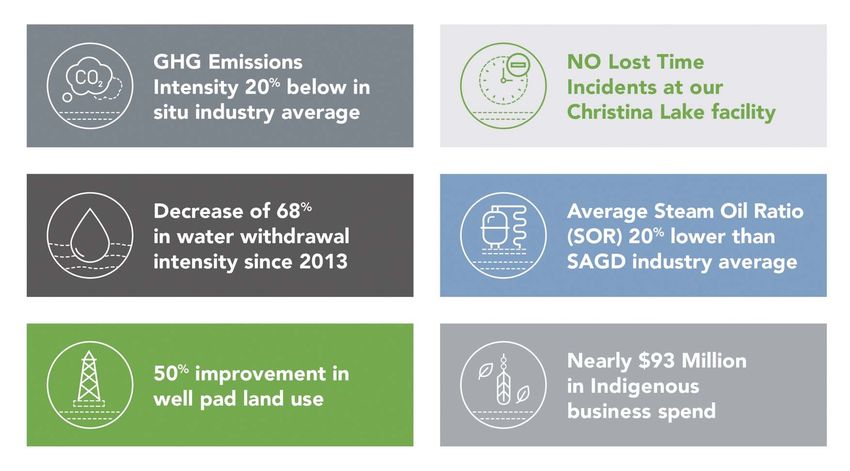
9ESG Highlights
MEG’s focus on ESG supported via executive committee – integrated into all aspects of the business
Data in ESG report based on 2018 results, additional information can be found at https://www.megenergy.com/sustainability
Canadian energy producers are among the most responsible in the world;
MEG is a leader in environmental performance within the sector
10Environmental Leader
Net GHG Intensity (kg CO e/bbl)) 2
Water Withdrawal Intensity(bbl water per bbl bitumen)
75 0.70
0.60
0.50
65
0.40
More than 20% below 0.30
55 in situ industry average 0.20
0.10 68% decrease since 2013
45 -
2013 2014 2015 2016 2017 2018 * 2013 2014 2015 2016 2017 2018
MEG Industry Average MEG Industry Average
MEG is a leader in lowering Greenhouse Gas (GHG) MEG does not use any surface water from streams,
intensity rivers or lakes in its operations
• Technological innovation, such as eMSAGP, • In 2018, MEG recycled 90% of water recovered from
eMVAPEX and cogeneration have driven MEG’s the reservoir to generate steam with remainder coming
GHG intensity down by 9% since 2013 from deep non-potable sub-surface reservoirs
• MEG has the second lowest net GHG intensity • Implementation of eMSAGP and eMVAPEX as well as
among the in situ peer group optimization of water recycling technology enables
• MEG uses cogeneration at its facilities with excess MEG to reduce its total water withdrawal intensity
power being sold into Alberta Power Market – • MEG’s 2018 water withdrawal intensity was 0.18, which
cogeneration results in more efficient use of natural is 58% lower than the industry average
gas and the electricity provided to the power grid had • No water used in MEG’s processes is discharged into
a lower GHG footprint in 2018 than the provincial the environment
average, helping to reduce total GHG intensity for
provincial consumers
11APPENDIX
12Material Unrecognized Value from Tax Pools
$5.7 billion of tax pools immediately deductible
Composition of Tax Pools (C$ billion) Amount of Pools Illustrative Value of Tax Pools
Utilized by Year(1) at 8.0% Discount Rate
Non-Capital Losses CDE
CEE + SR&ED Other Pools (C$ MM) (C$ Bn) (C$/sh)(2)
$500 $1.0 $3.15
$1.2 $1,000 $1.2 $4.05
$1,500 $1.4 $4.40
$0.3
$2,000 $1.4 $4.65
$7.2 billion
$0.6
of tax pools $5.1
Maximum Theoretical Value(3)
Total $1.8 Bn $5.80/sh(2)
Immediately Deductible $1.4 Bn $4.55/sh(2)
$5.7 billion of
tax pools are
immediately
deductible
1. Refers to the amount of tax pools utilized while the pools are fully deductible.
2. Tax pool value based on step down in tax rate from 25% to 23% over next three years (tax pools as at December 31, 2019); Value presented per MEG share, using fully diluted shares
outstanding as of December 31, 2019.
3. Maximum theoretical value is calculated based on 2020 tax rate of 25.0% applied to MEG’s total and immediately deductible tax pools, and using fully diluted shares outstanding as of
December 31, 2019.
13Inventory of Highly Economic Growth
Optional growth projects identified to support buildout to 210,000 bbls/d at Christina Lake are
execution ready – debt repayment takes precedence
~210,000+ bbls/d
+~52,000+ bbls/d
~100,000 bbls/d +~30,000 bbls/d Capital efficiency of
Current production $30-35k/bbl/d(1)
+17,000 bbls/d Capital efficiency of Regulatory approval
capacity +13,000 bbls/d Capital efficiencyDisclaimer
This presentation is not, and under no circumstances is to be construed to be a prospectus, offering memorandum, advertisement or public offering of any securities of MEG Energy
Corp. (“MEG”). Neither the United States Securities and Exchange Commission (the “SEC”) nor any other state securities regulator nor any securities regulatory authority in Canada or
elsewhere has assessed the merits of MEG’s securities or has reviewed or made any determination as to the truthfulness or completeness of the disclosure in this document. Any
representation to the contrary is an offence.
Recipients of this presentation are not to construe the contents of this presentation as legal, tax or investment advice and recipients should consult their own advisors in this regard.
MEG has not registered (and has no current intention to register) its securities under the United States Securities Act of 1933, as amended (the “U.S. Securities Act”), or any state
securities or “blue sky” laws and MEG is not registered under the United States Investment Act of 1940, as amended. The securities of MEG may not be offered or sold in the United
States or to U.S. persons unless registered under the U.S. Securities Act and applicable state securities laws or an exemption from such registration is available. Without limiting the
foregoing, please be advised that certain financial information relating to MEG contained in this presentation was prepared in accordance with International Financial Reporting
Standards as issued by the International Accounting Standards Board, which differs from generally accepted accounting principles in the United States and elsewhere. Accordingly,
financial information included in this document may not be comparable to financial information of United States issuers.
15Disclosure Advisories
Forward-Looking Information
Certain statements contained in this presentation may constitute forward-looking statements within the meaning of applicable Canadian securities laws. These statements relate to future
events or MEG's future performance. All statements other than statements of historical fact may be forward-looking statements. The use of any of the words "anticipate", "continue", "estimate",
"expect", "may", "will", "project", "should", "believe", "plan", "intend", "target", "potential" and similar expressions are intended to identify forward-looking statements. Forward-looking statements
are often, but not always, identified by such words. These statements involve known and unknown risks, uncertainties and other factors that may cause actual results or events to differ
materially from those anticipated in such forward-looking statements. In particular, and without limiting the foregoing, this presentation contains forward looking statements with respect to our
2020 capital budget, allocation and funding, expected 2020-2023 free cash flow, future production capability, including the impact of a turnaround, target 2020 production, anticipated decline
rates, non-energy operating costs, G&A expense, the value of tax pools, our focus and strategy, expected sustaining and maintenance capital and growth capital, the anticipated annualized
interest savings from credit facility refinancing and debt repayments, our projections of commodity prices and anticipated results from hedging activities, the expected impact of IMO 2020 on
our business, capital efficiencies associated with certain growth projects, anticipated GHG and water withdrawal intensities, market access and diversification plans, and plans to improve
overall cost efficiencies.
Forward-looking information contained in this presentation is based on management's expectations and assumptions regarding, among other things: future crude oil, bitumen blend, natural
gas, electricity, condensate and other diluent prices, foreign exchange rates and interest rates; the recoverability of MEG's reserves and contingent resources; MEG's ability to produce and
market production of bitumen blend successfully to customers; future growth, results of operations and production levels; future capital and other expenditures; revenues, expenses and cash
flow; operating costs; reliability; anticipated reductions in operating costs as a result of optimization and scalability of certain operations; anticipated sources of funding for operations and capital
investments; plans for and results of drilling activity; the regulatory framework governing royalties, land use, taxes and environmental laws and Federal and Provincial climate change policies,
and the timing and level of government apportionment easing, in which MEG conducts and will conduct its business; and business prospects and opportunities. By its nature, such forward-
looking information involves significant known and unknown risks and uncertainties, which could cause actual results to differ materially from those anticipated.
These risks include, but are not limited to: risks associated with the oil and gas industry, including the transition to a low carbon environment; the securing of adequate access to markets and
transportation infrastructure and to investment capital ; the availability of capacity on the electricity transmission grid; the uncertainty of reserve and resource estimates; the uncertainty of
estimates and projections relating to production, costs and revenues; health, safety and environmental risks; risks of legislative and regulatory changes to, amongst other things, tax, land use,
royalty, environmental laws, and Federal and Provincial climate change policies and curtailment of production policies, and, MEG’s ability to implement sales under the Alberta Government’s
Special Production Allowance (“SPA”) program; risks related to increased activism and public opposition to fossil fuel development; assumptions regarding and the volatility of commodity
prices, interest rates and foreign exchange rates; risks and uncertainties related to commodity price, interest rate and foreign exchange rate swap contracts and/or derivative financial
instruments that MEG may enter into from time to time to manage its risk related to such prices and rates; risks and uncertainties associated with securing and maintaining the necessary
regulatory approvals and financing to proceed with MEG’s future phases and the expansion and/or operation of MEG’s projects; risks and uncertainties related to the timing of completion,
commissioning, and start-up, of MEG’s turnarounds, and of future phases, expansions and projects; the operational risks and delays in the development, exploration, production, and the
capacities and performance associated with MEG's projects; and uncertainties arising in connection with any future acquisitions and/or dispositions of assets.
Although MEG believes that the assumptions used in such forward-looking information are reasonable, there can be no assurance that such assumptions will be correct. Accordingly, readers
are cautioned that the actual results achieved may vary from the forward-looking information provided herein and that the variations may be material. Readers are also cautioned that the
foregoing list of assumptions, risks and factors is not exhaustive.
Further information regarding the assumptions and risks inherent in the making of forward-looking statements can be found in MEG's most recently filed Annual Information Form ("AIF"), along
with MEG's other public disclosure documents. Copies of the AIF and MEG's other public disclosure documents are available through the Company's website
at www.megenergy.com/investors and through the SEDAR website at www.sedar.com.
The forward-looking information included in this presentation is expressly qualified in its entirety by the foregoing cautionary statements. Unless otherwise stated, the forward-looking
information included in this presentation is made as of the date of this presentation and MEG assumes no obligation to update or revise any forward-looking information to reflect new events or
circumstances, except as required by law.
This presentation contains future-oriented financial information and financial outlook information (collectively, "FOFI") about MEG's prospective results of operations including, without
limitation, cash flow and various components thereof, all of which are subject to the same assumptions, risk factors, limitations, and qualifications as set forth above. Readers are cautioned that
the assumptions used in the preparation of such information, although considered reasonable at the time of preparation, may prove to be imprecise and, as such, undue reliance should not be
placed on FOFI. MEG's actual results, performance or achievement could differ materially from those expressed in, or implied by, these FOFI, or if any of them do so, what benefits MEG will
derive therefrom. MEG has included the FOFI in order to provide readers with a more complete perspective on MEG's future operations and such information may not be appropriate for other
purposes. MEG disclaims any intention or obligation to update or revise any FOFI statements, whether as a result of new information, future events or otherwise, except as required by law.
16Disclosure Advisories
Pricing Assumptions(1)
The following table shows the key assumptions used in the cash flow and free cash flow estimates included in this presentation:
2019A 2020F 2021F
WTI US$/bbl $57.03 $49.00 $50.00
WTI:WCS Differential US$/bbl $12.76 $16.00 $14.75
WTI:AWB Gulf Coast Differential US$/bbl $1.77 $5.00 $4.75
Condensate (% of WTI) % 98% 102% 100%
Delivered Gas Cost C$/mcf $2.20 $2.30 $2.50
Exchange Rate C$/US$ 1.33 1.35 1.35
Mainline Apportionment % 43% 40%-45% 35%
2020 Funds Flow Sensitivities(2)
WTI (US$/bbl) - $1/bbl change C$ MM $15
WTI:WCS Diff. (US$/bbl) - $1/bbl change C$ MM $8
WTI:AWB Diff. (US$/bbl) - $1/bbl change C$ MM $22
Condensate (% of WTI) - 1% change C$ MM $8
Gas Cost (C$/mcf) - $0.25/mcf change C$ MM $8
Exchange Rate - $0.01 change C$ MM $5
Note: 2019 actual pricing shown. 2020F commodity prices include YTD actuals prices with US$50 case for remainder of the year.
1. Exchange rate remains unchanged across WTI scenarios in 2020. In 2021, at US$40/bbl WTI, F/X is adjusted to C$1.42 and differentials are narrowed by US$1/bbl-$US2/bbl. At
US$60/bbl WTI, F/X is adjusted to C$1.29 and differentials are widened by US$1/bbl-$US2/bbl.
2. Sensitivities based on the remainder of the year and include current hedge position.
17Disclosure Advisories
Non-GAAP Measures
This presentation refers to the non-GAAP measure of free cash flow, as well as adjusted funds flow which is defined in Note 26 of the annual 2019 Financial Statements. These terms
may not be comparable to similar measures provided by other companies and are not intended to represent net cash provided by (used in) operating activities. These financial
measures should not be considered in isolation or as an alternative to, or more meaningful than, MEG's consolidated statement of cash flow as determined in accordance with IFRS,
as an indicator of financial performance.
Free cash flow is presented to assist management and investors in analyzing performance by the Corporation as a measure of the capacity of the business to repay debt, incur
discretionary capital or increase returns to shareholders. Free cash flow is calculated as adjusted funds flow less capital expenditures.
Three months ended Year ended
December 31 December 31
($mm) 2019 2018 2019 2018
Net cash provided by (used in) operating activities 225 94 631 280
Net change in non-cash operating working capital items (52) (159) 110 (111)
Funds flow from (used in) operations 173 (65) 741 169
Adjustments:
Other income(1) (20) - (20) -
Decommissioning expenditures 1 1 2 5
(2)
Net change in other liabilities 3 3 3 3
(3)
Realized gain on foreign exchange derivatives - - - (35)
(4)
Defense costs related to unsolicited bid - 19 - 19
Payments on onerous contracts - 5 - 19
Adjusted funds flow 157 (37) 726 180
Capital expenditures (72) (144) (198) (622)
Free cash flow 85 (181) 528 (442)
Note: Values are rounded to the nearest million
1. During the fourth quarter of 2019, the Corporation agreed to relieve the Alberta Petroleum Marketing Commission (“APMC”) of all obligations pursuant to a crude oil purchase and
sale agreement in exchange for a one-time payment of $20 million.
2. Excludes change in long-term cash-settled stock-based compensation liability.
3. A gain related to the settlement of forward currency contracts to manage the foreign exchange risk on Canadian dollar denominated proceeds related to the sale of assets
designated for U.S. dollar denominated long-term debt repayment.
4. The Corporation incurred costs of $19 million in the fourth quarter of 2018 related to Husky Energy Inc.’s unsolicited bid to acquire all of the outstanding shares of the Corporation.
18Investor Relations Investor Relations T 403.767.6206 E invest@megenergy.com Media Relations T 403.767.1485 E media@megenergy.com
You can also read