2Q20 Results Conference Call - Ovintiv Investor Relations
←
→
Page content transcription
If your browser does not render page correctly, please read the page content below
2Q20 Results
Conference Call

                  1
Today’s Key Takeaways
                                                      High confidence in ’20 & ’21 scenarios, cash cost savings on track

                                                      4Q20 avg oil and C5+ raised to 200 Mbbls/d (previously exit rate)

                                                      ‘20 capex of $1.8B now at low-end of previous range

                                                      Tripled passive ownership in OVV since change in domicile

                                                      Excess cash flows goes to debt reduction over the next six quarters

                                                                                                                           2
Note: All references to capital investment and oil and condensate production scenarios do not represent formal guidance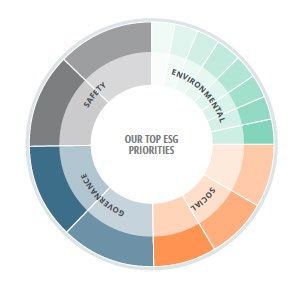
2Q Results Enhance “Next Six Quarters”
High Operational Confidence:                                                                                                                                                           2020 Scenario
• Recent well cost achievements underwrite 2021 scenario                                                                                                                                   Previous     Current
    • 20% gain in capital efficiency vs 2019                                                                                                                                  Oil & C5+      200            200
                                                                                                                                                                              (Mbbls/d)       exit          4Q20
• ‘21 base decline improves 5% YoY to low 30%, adds material production / cash flow                                                                                            Capex
                                                                                                                                                                                ($B)
                                                                                                                                                                                          $1.8 - $1.9       $1.8
• Multi-basin portfolio offers flexibility, multiple “ways to win”

High Financial Confidence:
                                                                                                                                                                               2021 “Stay- Flat” Scenario
• $300 MM cash cost savings expected in 2021
    • Majority of 2020 cost savings & $100 MM legacy cost savings                                                                                                                ‘21 FCFŦ Positive
                                                                                                                                                                                 Post dividend at $35 / $2.75
Unhedged FY21 Price Sensitivities:
• WTI $5 / bbl: $375 MM                                                                                                                                                           ~200 Mbbls/d
• NYMEX Gas $0.25 / MMBtu: $140 MM                                                                                                                                                     Avg 2021 Oil & C5+

                                          “Next Six Quarters”                                                                                                                          $1.4 – $1.6B
                                                                                                                                                                                 2021 capex scenario; 20%
                                excess cash flows goes to debt reduction                                                                                                        capital efficiency gain vs ‘19

                                                                                                                                                                                                                   3
Note: Declaration and payment of future dividends subject to Board discretion
Ŧ Non-GAAP measures defined in advisories. For additional information regarding non-GAAP measures see the Company’s website and disclosure in the appendix of this document
EFFECTIVELY MANAGING VOLATILITY
Priorities for “The Next Six Quarters”
Maintaining Financial
Strength/Reducing Debt Maintaining Scale
Leading cost structure Protecting health &
and capital efficiency safety of our people
4BUILDING CONFIDENCE IN THE FUTURE
Strong 2Q20 Operating Performance
Solid execution in unprecedented period of macro volatility
• Proven world class operator rapidly reducing cost structure
Capital efficiencies evident: 2Q capex at low end of guidance / FY20 capex reduced
• Massive organizational flexibility and optionality
Proven Capital Discipline Dynamic Production Management
2Q20 Capex ($ MM) 2Q20 Production
$300 (High End) 569
32 Shut-in
537
Actual
216
$252 Actual 18 Shut-in
$250 (Low End) 198
Actual
2Q20 1Capex Equivalent
Mboepd Oil & Oil
Condensate
& C5+
Guidance MBOE/d Mbbls/d
5DEMONSTRATED FLEXIBILITY
2Q20 - Effectively Managing Volatility
Delivered Free Cash Cash Flow Ŧ Liquidity
Flow Ŧ
Challenging Macro
@ $28 WTI
$304 MM
$1.17 / share
$3.0B1
Investment Grade
Total Costs Ŧ >$200 MM Savings
Operated Rigs
1Q20 2Q20
x23 x07
$11.23 / BOE
(8%) vs. 1Q20
‘20 Achieved ~50% of
cash cost savings
YTD
Note 1: Refer to Slide Notes
6
Ŧ Non-GAAP measures defined in advisories. For additional information regarding non-GAAP measures see the Company’s website and disclosure in the appendix of this documentFlexibility Continues in 2H20
2H20 Demonstrates Business Resiliency Workforce Balanced with Future Plans
FY20 now on track for $1.8B capex Align business with activity
25%
• Moderate growth vs. history
• Low end of previous range of $1.8 - $1.9B
Confidence in 2021 scenario
200 Mbbls/d oil and condensate now 4Q20 average • Through cycle cost savings
• Previously 200 Mbbls/d oil and condensate was an exit rate 2Q20 workforce
• Demonstrates strong operations and asset performance reduction increases Workforce efficiencies
expected margin and • Since 2013, 67% smaller with oil &
• Strengthens confidence in ability to achieve 2021 scenario condensate production up >6x
cash flow
2H20 Game Plan Sets Up Optimal 2021 Scenario
Confidence in ‘20 & ‘21 scenarios bolstered by 2Q results Oil & C5+ Production (Mbbls/d)
220 215
4Q20 Flat ‘21 oil and
2H20: Resumption of completions 198 200 condensate
200
• Completions to resume in 3Q20
~180
• Frac holiday in 2Q20 to mark 3Q20 as production trough 180
200
• Flexibility of completion schedule allows for dynamic operations 160
• Exiting ‘20 with typical balance of drilled uncompleted wells (DUCs)
140
1Q20 2Q20 3Q20 4Q20 1Q21 2Q21
2021 3Q21 4Q21
7MULTI-YEAR RESILIENCY
>$200 MM of Cash Cost Savings in 2020
2020: >$200 MM of expected cash cost savings Cash Cost Savings ($ MM)
• Nearly half of estimated savings achieved YTD $300
$300
• Reduced operating and midstream costs
• Lower G&A, interest and other costs
>$200
• Midstream optimization
$200
• Cost reductions over and above shut-in related costs and
price-driven production tax reductions
$100
2021: Legacy costs drop $100 MM+
• Primarily unutilized midstream costs that expire in ’21
$0
2020 2021
Durable Cash Cost Savings
Combination improves 2021 Legacy Cost Savings
cash outlook by $300 MM
8DRIVING CAPITAL EFFICIENCY
Track Record of Efficiency Improvements
Core 3 Assets demonstrating capital efficiency gains Go Forward Well Costs ($ MM)
• 2Q20 capital costs 15% lower vs 2019 (9% in 1Q20) 1Q20 NEW
• On track to realize 20% lower D&C in 2021 vs 2019 Play D&C DC&E1 D&C DC&E1
Permian $5.6 $6.2 $5.3 $5.8
1Q Actual 2Q Actual Next Six Quarters STACK $5.0 $5.4 $5.0 $5.4
Capital Efficiency 9% 15% 20% Montney $3.5 $3.7 $3.4 $3.5
2Q20 D&C rates building on efficiencies established in 1Q20
$680
$640 $640
D&C ($ M) / 1,000 ft2
Pacesetter $550 $540
$530 $520
$500 $500 $490 $500
$450
$300 1 2 3
FY19 1Q20 2Q20 Go Forward FY19 1Q20 2Q20 Go Forward FY19 1Q20 2Q20 Go Forward
Previously Same as Previously
Permian $560
STACK 1Q20
Montney $470
9
Note 1, 2: Refer to Slide NotesWORLD CLASS OPERATOR
Capital Efficiency More Important Than Ever
Permian Drilling – Total Well (ft) / day1
2,000
• Continued Simul-Frac improvements leading to increased
completion rates and $350k $400k savings per well
Anadarko 1,500
• 14 STACK wells drilled and completed for under $5 MM2
• 2Q completions avg 20 hrs / day pump time (+5% vs 1Q20) 1,000
2018 2019 1H20
Montney Completions – Lateral Length (ft) / day
• 4-well Pipestone pad achieved Ovintiv average completion rate 3,000
record of 3,450 ft / day 2,500
2,000
Total Company 1,500
• 15% reduction in well facility costs vs FY19 driven by optimized site 1,000
design and multi-basin knowledge transfer 500
• Op. costs down 14% from 1Q20: $3.34 $2.86 / BOE (excl LTI) 2018 2019 1H20
Permian STACK Montney
10
Note 1, 2: Refer to Slide NotesOVV: Well Positioned vs Industry Narratives
“Stay-flat” capital efficiencies Capital efficiency through innovation
’21 scenario: 200 Mbbls/d oil & C5+ for $1.4 - $1.6B Proven track record of safely reducing costs
Optionality through legacy gas production Scale provides stability thru-cycle
Minimal Federal acreage exposure Multi-year track record of returning cashDefining the Successful E&P of the Future
Quality Multi-Basin Portfolio
Financial Strength and Risk Management
Industry Leading Efficiency Driven by Innovation
Size & Scale as One of The Largest Oil & Condensate
Producers
Unique Combination of Capital Discipline &
Flexibility
A Culture That Values Being One, Agile & Driven
Proven Team of Talented & Committed
Professionals
12Future Oriented Information
This presentation contains forward-looking statements or information (collectively, “FLS”) within the meaning of applicable securities legislation, including Section 27A of the Securities Act of 1933, as amended, and Section
21E of the Securities Exchange Act of 1934, as amended. FLS include:
• anticipated operating and midstream costs, legacy costs, capital efficiencies, margins, G&A, cost • number of rigs, drilling locations, well performance, spacing, wells per pad, rig release metrics, cycle
savings and sustainability thereof times, well costs, commodity composition and performance against type curves and versus peers
• financial flexibility and ability to maintain balance sheet strength • potential index exposure and demand for shares
• anticipated hedges, amount of hedge production, value of hedge book and hedging sensitivities based • pacesetting metrics being indicative of future well performance and costs
on oil and gas prices • estimated reserves and resources, including product types
• outcomes of risk management program, including exposure to commodity prices, market access, • commodity price outlook
market diversification strategy and physical sales locations • anticipated success of and benefits from technology and innovation
• capital investment scenarios and associated production • expected transportation and processing capacity, commitments, curtailments and restrictions,
• credit ratings and impact to sources of liquidity and cost of financing thereof including flexibility of commercial arrangements
• expected future interest expense • management of balance sheet, including target leverage, available free cash flow, dividends if any,
• focus of development and allocation of capital, level of capital productivity and expected return debt reduction and expected net debt
• anticipated production, cash flow, free cash flow, payout, net present value, rates of return, including • statements regarding the Company’s application of excess cash flows to reduce debt
expected timeframes and potential upside • statements regarding the benefits of the Company’s multi-basin portfolio
• expected drilling and completions activity and the timing thereof • ESG approach, performance and results, and sustainability thereof
FLS involve assumptions, risks and uncertainties that may cause such statements not to occur or results to differ materially. These assumptions include: future commodity prices and differentials; assumptions as
specified herein; data contained in key modeling statistics; availability of attractive hedges and enforceability of risk management program; assumed tax, royalty and regulatory regimes; and expectations and
projections made in light of the Company’s historical experience. Risks and uncertainties include: suspension of or changes to guidance, and associated impact to production; ability to generate sufficient cash flow to
meet obligations; commodity price volatility and impact to the Company’s stock price and cash flows; ability to secure adequate transportation and potential curtailments of refinery operations, including resulting
storage constraints or widening price differentials; discretion to declare and pay dividends, if any; business interruption, property and casualty losses or unexpected technical difficulties; impact of COVID-19 to the
Company’s operations, including maintaining ordinary staffing levels, securing operational inputs, executing on portions of its business and cyber-security risks associated with remote work; counterparty and credit risk;
impact of changes in credit rating and access to liquidity, including costs thereof; risks in marketing operations; risks associated with technology; risks associated with lawsuits and regulatory actions, including disputes
with partners; risks associated with decommissioning activities, including timing and costs thereof; ability to acquire or find additional reserves; imprecision of reserves estimates and estimates of recoverable
quantities; and other risks and uncertainties, as described in the Company’s most recent Annual Report on Form 10-K, Quarterly Report on Form 10-Q and as described from time to time in its other periodic filings as filed
on EDGAR and SEDAR. Although the Company believes such FLS are reasonable, there can be no assurance they will prove to be correct. The above assumptions, risks and uncertainties are not exhaustive. FLS are made
as of the date hereof and, except as required by law, the Company undertakes no obligation to update or revise any FLS.
Certain future oriented financial information or financial outlook information is included in this presentation to communicate current expectations as to Ovintiv’s performance. Readers are cautioned that it may not be
appropriate for other purposes. Rates of return for a particular asset or well are on a before-tax basis and are based on specified commodity prices with local pricing offsets, capital costs associated with drilling,
completing and equipping a well, field operating expenses and certain type curve assumptions. Pacesetter well costs for a particular asset are a composite of the best drilling performance and best completions
performance wells in the current quarter in such asset and are presented for comparison purposes. Drilling and completions costs have been normalized as specified in this presentation based on certain lateral
lengths for a particular asset. For convenience, references in this presentation to “Ovintiv”, “OVV”, the “Company”, “we”, “us” and “our” may, where applicable, refer only to or include any relevant direct and indirect
subsidiary corporations and partnerships (“Subsidiaries”) of Ovintiv Inc., and the assets, activities and initiatives of such Subsidiaries.
13Advisory Regarding Oil & Gas Information
All reserves estimates in this presentation are effective as of December 31, 2019, prepared by qualified reserves evaluators in accordance with procedures and standards contained in the Canadian Oil and Gas
Evaluation ("COGE") Handbook, National Instrument 51-101 (NI 51-101) and SEC regulations, as applicable. Detailed Canadian and U.S. protocol disclosure will be contained in the Form 51-101F1 and Annual Report on Form 10-
K, respectively. Information on the forecast prices and costs used in preparing the Canadian protocol estimates are contained in the Form 51-101F1. For additional information relating to risks associated with the
estimates of reserves, see "Item 1A. Risk Factors" of the Annual Report on Form 10-K.
Reserves are the estimated remaining quantities of oil and natural gas and related substances anticipated to be recoverable from known accumulations, from a given date forward, based on: analysis of drilling,
geological, geophysical and engineering data, the use of established technology, and specified economic conditions, which are generally accepted as being reasonable. Proved reserves are those reserves which can
be estimated with a high degree of certainty to be recoverable. It is likely that the actual remaining quantities recovered will exceed the estimated proved reserves.
Ovintiv uses the terms play and resource play. Play encompasses resource plays, geological formations and conventional plays. Resource play describes an accumulation of hydrocarbons known to exist over a large
areal expanse and/or thick vertical section, which when compared to a conventional play, typically has a lower geological and/or commercial development risk and lower average decline rate. Ovintiv has provided
information with respect to its assets which are “analogous information” as defined in NI 51-101, including production type curves. This analogous information is presented on a basin, sub-basin or area basis utilizing data
derived from Ovintiv's internal sources, as well as from a variety of publicly available information sources which are predominantly independent in nature. Production type curves are based on a methodology of
analog, empirical and theoretical assessments and workflow with consideration of the specific asset, and as depicted in this presentation, is representative of Ovintiv’s current program, including relative to current
performance, but are not necessarily indicative of ultimate recovery. Some of this data may not have been prepared by qualified reserves evaluators, may have been prepared based on internal estimates, and the
preparation of any estimates may not be in strict accordance with COGEH. Estimates by engineering and geo-technical practitioners may vary and the differences may be significant. Ovintiv believes that the provision
of this analogous information is relevant to Ovintiv's oil and gas activities, given its acreage position and operations (either ongoing or planned) in the areas in question, and such information has been updated as of
the date hereof unless otherwise specified. Estimates of Ovintiv potential gross inventory locations, including premium return well inventory, include proved undeveloped reserves, probable undeveloped reserves, un-
risked 2C contingent resources and unbooked inventory locations. As of December 31, 2019, on a proforma basis, 2,184 proved undeveloped locations, 2,671 probable undeveloped locations and 4,292 un-risked 2C
contingent resource locations (in the development pending, development on-hold or development unclarified project maturity sub-classes) have been categorized as either reserves or contingent resources.
Unbooked locations have not been classified as either reserves or resources and are internal estimates that have been identified by management as an estimation of Ovintiv's multi-year potential drilling activities
based on evaluation of applicable geologic, seismic, engineering, production, resource and acreage information. There is no certainty that Ovintiv will drill all unbooked locations and if drilled there is no certainty that
such locations will result in additional oil and gas reserves, resources or production. The locations on which Ovintiv will actually drill wells, including the number and timing thereof is ultimately dependent upon the
availability of capital, regulatory and partner approvals, seasonal restrictions, equipment and personnel, oil and natural gas prices, costs, actual drilling results, additional reservoir information that is obtained,
production rate recovery, transportation constraints and other factors. While certain of the unbooked locations may have been de-risked by drilling existing wells in relative close proximity to such locations, many of
other unbooked locations are farther away from existing wells where management has less information about the characteristics of the reservoir and therefore there is more uncertainty whether wells will be drilled in
such locations and if drilled there is more uncertainty that such wells will result in additional proved or probable reserves, resources or production.
30-day IP and other short-term rates are not necessarily indicative of long-term performance or of ultimate recovery. The conversion of natural gas volumes to barrels of oil equivalent (“BOE”) is on the basis of six
thousand cubic feet to one barrel. BOE is based on a generic energy equivalency conversion method primarily applicable at the burner tip and does not represent economic value equivalency at the wellhead. Readers
are cautioned that BOE may be misleading, particularly if used in isolation.
14Non-GAAP Measures
Certain measures in this presentation do not have any standardized meaning as prescribed by U.S. GAAP and, therefore, are considered non-GAAP measures. These measures may not be comparable to similar
measures presented by other companies. These measures have been provided for meaningful comparisons between current results and other periods and should not be viewed as a substitute for measures reported
under U.S. GAAP. For additional information regarding non-GAAP measures, including reconciliations, see the Company’s website and Ovintiv’s most recent Annual Report as filed on SEDAR and EDGAR. This presentation
contains references to non-GAAP measures as follows:
• Non-GAAP Cash Flow and Non-GAAP Free Cash Flow – Non-GAAP Cash Flow (or Cash Flow) is defined • Total Costs is a non-GAAP measure which includes the summation of production, mineral and other
as cash from (used in) operating activities excluding net change in other assets and liabilities, net taxes, upstream transportation and processing expense, upstream operating expense and
change in non-cash working capital and current tax on sale of assets. Non-GAAP Free Cash Flow (or administrative expense, excluding the impact of long-term incentive costs, restructuring costs and
Free Cash Flow) is Non-GAAP Cash Flow in excess of capital expenditures, excluding net acquisitions and current expected credit losses. It is calculated as total operating expenses excluding non-upstream
divestitures. Management believes these measures are useful to the company and its investors as a operating costs and non-cash items which include operating expenses from the Market Optimization
measure of operating and financial performance across periods and against other companies in the and Corporate and Other segments, depreciation, depletion and amortization, impairments, accretion
industry, and are an indication of the company’s ability to generate cash to finance capital programs, of asset retirement obligation, long-term incentive costs, restructuring costs and current expected
to service debt and to meet other financial obligations. These measures may be used, along with other credit losses. When presented on a per BOE basis, Total Costs is divided by production volumes.
measures, in the calculation of certain performance targets for the company’s management and Management believes this measure is useful to the Company and its investors as a measure of
employees. operational efficiency across periods.
1516
Appendix
OVINTIV EDGE

OVV’s Culture Drives our Success
                                                 We are “ONE”
                   • Sense of team; we all win when the organization wins; OVV first
                   • Transparency and information sharing across the organization
                   • One performance “scorecard” for entire Company aligns compensation
                   • Support for healthy debate and a trust in team

                                                 We are “AGILE”
   A Company       • Innovative - biased to action toward improvements
  defined by its   • Purpose-built flexibility provides optionality
     Culture
                                               We are “DRIVEN”
                   • Relentless focus on operational excellence and efficiencies
                   • Disciplined approach to allocating capital and effectively managing risks
                   • Results-focused with accountability for our actions

                                                                                                 18
Hedge Summary
Quarterly Hedge Positions
Strong Hedge Position Oil and Condensate1 3Q20 4Q20 2021
Volume Mbbls/d 160 89 7
• 2020 cash flowŦ protected through strong hedges1 WTI Swaps
Price $/bbl $44.60 $52.95 $43.02
• Substantially hedged on near-term benchmark oil price risk Volume Mbbls/d 15 15 15
WTI Costless
Call Strike $/bbl $68.71 $68.71 $45.84
• Mitigated 72% of WTI Roll exposure for balance of year, Collars
Put Strike $/bbl $50.00 $50.00 $35.00
combination of physical sales and hedges at plus ~$0.26/bbl
Volume Mbbls/d 76 15
WTI 3-Way Call Strike $/bbl $61.46 $50.00
Select balance of 2020 Basis hedges: Options Put Strike $/bbl $53.36 $35.23
Put (Sold) Strike $/bbl $43.36 $24.64
• 3.5 Mbbls/d WTI / Midland swaps ($1.20)
• 238 MMcf/d AECO swaps ($0.88) Natural Gas1,2 3Q20 4Q20 2021
• 105 MMcf/d WAHA swaps ($0.91) NYMEX Volume MMcf/d 970 793 165
Swaps Price $/mcf $2.51 $2.65 $2.51
NYMEX Volume MMcf/d 55 55
Costless Call Strike $/mcf $2.88 $2.88
Collars Put Strike $/mcf $2.50 $2.50
Volume MMcf/d 330 330 170
NYMEX
Call Strike $/mcf $2.72 $2.72 $3.22
3-Way
Put Strike $/mcf $2.60 $2.60 $2.75
Options
Put (Sold) Strike $/mcf $2.25 $2.25 $2.50
Note 1, 2: Refer to Slide Notes 19
Ŧ Non-GAAP measures defined in advisories. For additional information regarding non-GAAP measures see the Company’s website and disclosure in the appendix of this documentPricing and Hedge Sensitivity Update
Hedge Sensitivities – Gain / (Loss) ($ MM)1
Extreme 2Q price volatility protected by hedges WTI Price $/bbl 3Q20 4Q20 Bal 20
$10 $565 $477 $1,042
• Realized price per BOE (including hedge): $21.21/BOE
$20 $404 $381 $785
• Realized price only down 15% from 1Q levels versus $30 $243 $285 $528
benchmark WTI down 40%, NYMEX natural gas down 12%
$40 $82 $190 $272
$50 ($79) $48 ($31)
Strong 1H20 Protection from volatility
• 1H20 oil and condensate realized hedges $387 MM, hedged NYMEX Natural
at average WTI price of $47.88/bbl Gas $/MMBtu 3Q20 4Q20 Bal 20
• 1H20 Natural Gas realized hedges of $112 MM with hedged at $1.00 $155 $141 $296
average NYMEX price $2.40/MMBtu
$1.25 $131 $121 $252
$1.50 $108 $102 $210
$1.75 $84 $82 $166
$2.00 $60 $63 $123
$2.25 $37 $43 $80
20
Note 1, Refer to Slide NotesIndustry Leading ESG Performance
6th Consecutive Safest Year Ever Proven Safety Results Environmental Performance
#1
TRIF Methane Intensity 2018 Water Use
0.44
0.43 ~45%
0.34
0.30 0.30 0.28
0.22
0.21 1
Fresh Alternative
2014 2015 2016 2017 2018 2019 vs. 23 AXPC peers in 2016 2018
Total Recordable Injury Frequency (TRIF): Number of the U.S. Tons CH4 / MBOE % of Total Water
Recordable Injuries x 200,000 divided by exposure hoursProactive ESG Approach
Task Force on Climate-Related Financial Disclosures ESG Impact Matrix
• Climate-related risks have the potential to impact our business
• Governance framework allows us to effectively manage these risks
• Applicable concerns are integrated into planning and risk management
• Established history of measuring, managing and reporting ESG
performance
Sustainability Reporting and Programs
• An annual Sustainability Report is published on the OVV website
Focus on Climate Change and Air Quality
• OVV has proactive programs in place for effective Emissions Management
• Electrifying production equipment and facilities Safety Environmental
• Top Tier LDAR program utilizing Optical Gas Imaging for >10-years Process Safety Climate Change
Water
Founding member of The Environmental Partnership Governance Social
• Committed to reducing VOC emissions through sustainable practices Stakeholder activism Community concerns
22Notes
Slide 6
1) Total liquidity includes $183 MM of available capacity on uncommitted demand lines
Slide 9
1) DC&E includes: drill, complete, facilities and on lease tie in costs. STACK and Permian well lengths normalized to 10,000 ft. Montney normalized to 7,500 ft. Montney costs displayed in USD. 0.72 FX rate
2) Montney D&C / 1,000 ft cost performance reflects only Pipestone turned-in-lines for 2Q20 . All other time frames reflect 50% Pipestone and 50% Dawson well split
Slide 10
1) Total well (ft) / day is calculated by: Total well measured depth / spud to rig release in days (Spud to rig release time excludes surface casing rig drill time for Permian and STACK)
2) Well lengths normalized to 10,000 ft
Slide 19
1) Hedges as of July 27, 2020 For more information on Ovintiv’s Financial Instruments and Risk Management please refer to Note 22 of the interim financial statements. 2021 Oil positions exclude WTI
swaptions of 10 Mbbls/d @$58.00
2) Excludes 230 BBtu/day of NYMEX call options sold
Slide 20
1) Based on July 27, 2020 positions. Sensitivities do not include gains or losses related to differential hedges. Additional Ethane, Butane and Propane hedges not included in sensitivities
Slide 21
1) Proforma 2019 including Newfield and Ovintiv results
2) Historical data represents standalone OVV unless otherwise noted. ISS Score is calculated by averaging each company’s individual ISS Quality Scores for environment, social and governance.
Third Party ESG Assessment peer group consists of APA, CLR, COG, CXO, DVN, EOG, MRO, MUR, NBL, PXD, QEP, WPX, XEC
23You can also read