ANGLO AMERICAN PLATINUM - 2016 INTERIM RESULTS PRESENTATION 25 JULY 2016

Page created by Sean Nichols
 
CONTINUE READING
ANGLO AMERICAN PLATINUM - 2016 INTERIM RESULTS PRESENTATION 25 JULY 2016
PLATINUM

ANGLO AMERICAN PLATINUM
2016 INTERIM RESULTS PRESENTATION
25 JULY 2016

                             Miss South Africa Platinum Crown 2013 - 2015
ANGLO AMERICAN PLATINUM - 2016 INTERIM RESULTS PRESENTATION 25 JULY 2016
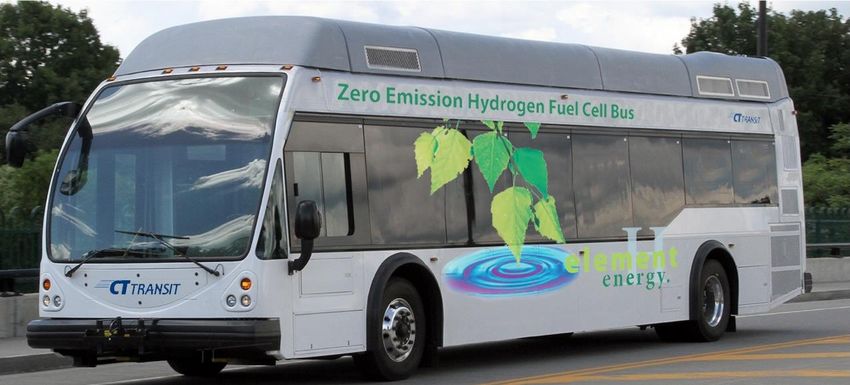
CAUTIONARY STATEMENT

Disclaimer: This presentation has been prepared for Anglo American Platinum Limited and the entities in the Anglo American Platinum group (“Anglo American Platinum”) and comprises the written
materials/slides for a presentation concerning Anglo American Platinum. By attending this presentation and/or reviewing the slides you agree to the following conditions, and accept that all
statements attributable to Anglo American Platinum or persons acting on their behalf are qualified in their entirety by the cautionary statements set out below:
• This presentation is for information purposes only. It does not constitute an offer to sell or the solicitation of an offer to buy shares in Anglo American Platinum. Further, it does not constitute a
    recommendation by Anglo American Platinum or any other party to sell or buy shares in Anglo American Platinum (or any other securities).
• Nothing in this presentation should be interpreted to mean that future earnings per share of Anglo American Platinum will necessarily match or exceed its historical published earnings per share.
• Certain statistical and other information about Anglo American Platinum included in this presentation is sourced from publicly available third party sources. As such it presents the views of those
    third parties, which does not necessarily correspond to the views held by Anglo American Platinum.

Forward-looking statements
• This presentation includes forward-looking statements. All statements other than statements of historical facts in this presentation are forward-looking statements, including those regarding Anglo
   American Platinum’s financial position, business and acquisition strategy, plans and objectives of management for future operations (including development plans and objectives relating to Anglo
   American Platinum’s products, production forecasts and reserve and resource positions). Known and unknown risks, uncertainties and other factors may cause the actual results, performance or
   achievements of Anglo American Platinum, or industry results, to be materially different from those expressed in or implied by such forward-looking statements. Such forward-looking statements
   are based on assumptions, including in relation to Anglo American Platinum’s present and future business strategies and the environment in which Anglo American Platinum will operate in the
   future.
• Factors that could cause Anglo American Platinum’s actual results, performance or achievements to differ materially from those in the forward-looking statements include, among others, levels of
   actual production during any period, levels of global demand and commodity market prices, mineral resource exploration and development capabilities, recovery rates and other operational
   capabilities, the availability of mining and processing equipment, the ability to produce and transport products profitably, the impact of foreign currency exchange rates on market prices and
   operating costs, the availability of sufficient credit, the effects of inflation, political uncertainty and operating conditions in relevant areas of the world, the actions of competitors, activities by
   governmental authorities such as changes in taxation or safety, health, environmental or other types of regulation in the countries where Anglo American Platinum operates, conflicts over land
   and resource ownership rights and such other risk factors identified in Anglo American Platinum’s most recent Integrated Report. Forward-looking statements should, therefore, be construed in
   light of such risk factors and undue reliance should not be placed on forward-looking statements.
• These forward-looking statements speak only as of the date of this presentation. Anglo American Platinum disclaims any obligation (except as required by applicable law, the Listings
   Requirements of the securities exchange of the JSE Limited in South Africa and other applicable regulations) to release publicly any updates or revisions to any forward-looking statement
   contained herein, notwithstanding any change in any of Anglo American Platinum’s expectations or in anything on which any such statement is based.

No investment advice
• This presentation has been prepared without reference to your particular investment objectives, financial situation, taxation position and particular needs. You should consult your stockbroker,
   bank manager, solicitor, accountant, taxation adviser or other independent financial adviser (where applicable, as authorised under the Financial Advisory and Intermediary Services Act 37 of
   2002 in South Africa) for financial or investment advice.

                                                                                                                                                                                                                2
ANGLO AMERICAN PLATINUM - 2016 INTERIM RESULTS PRESENTATION 25 JULY 2016
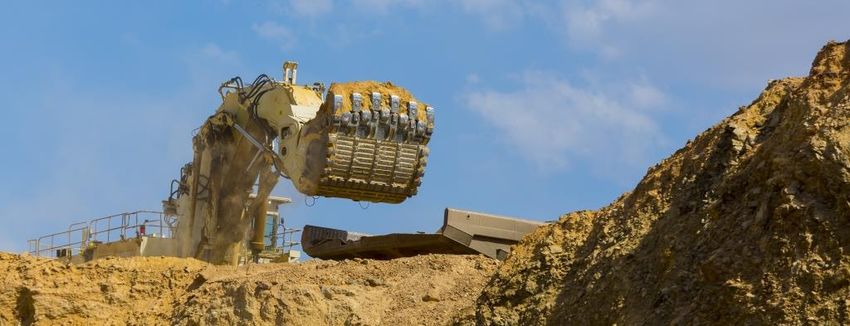
PLATINUM

AGENDA
• Overview of H1 2016
• Operations
• Financials
• Markets
• Strategy
• Outlook
ANGLO AMERICAN PLATINUM - 2016 INTERIM RESULTS PRESENTATION 25 JULY 2016
PLATINUM

OVERVIEW OF H1 2016
CHRIS GRIFFITH, CHIEF EXECUTIVE OFFICER

                                                Valcambi Suisse
                                              500g Platinum Bar
ANGLO AMERICAN PLATINUM - 2016 INTERIM RESULTS PRESENTATION 25 JULY 2016
OVERVIEW OF H1 2016
Managing the business…

                                                            Net debt profile (R billion)
• Zero harm remains the priority
                                                 14.6
                                                                       12.8
• PGM pricing remained weak                                                                   9.9

• Strong operational performance
• R3.2 billion of free cash flow generated
 from operations                              31 Dec 2014           31 Dec 2015            30 Jun 2016

• R400 million overhead savings achieved         Headline earnings per share (Rand / share)

• Net debt reduced to R9.9 billion                                                            3.99

                                                 3.01

• Progressing with the repositioning of the
 portfolio
                                                                       0.41
• Solid earnings per share of R3.99
                                                 2014                  2015                 H1 2016

                                                …for the low PGM price environment                       5
ANGLO AMERICAN PLATINUM - 2016 INTERIM RESULTS PRESENTATION 25 JULY 2016
PLATINUM

OPERATIONAL REVIEW
CHRIS GRIFFITH, CHIEF EXECUTIVE OFFICER
                                          Hydraulic shovel - Mogalakwena Mine, Limpopo
ANGLO AMERICAN PLATINUM - 2016 INTERIM RESULTS PRESENTATION 25 JULY 2016
SAFETY, HEALTH & ENVIRONMENT
Zero harm remains the priority…

SAFETY                                                                         Number of fatalities

• Tragically, 4 fatalities occurred during H1 2016
• Record fatality free period of 323 days ended
                                                           25
  31 March 2016
                                                                          6
                                                                                        3                       4
• LTIFR reduced by 28% to 0.75                                                                     2

                                                          2007          2013          2014        2015    H1 2016
• S54 stoppages continue to impact production                                          H1    H2

                                                                  Lost time injury frequency rate (LTIFR) (1)

HEALTH & ENVIRONMENT

• Effective disease management programmes resulted
  in significant reduction in HIV and TB related deaths    2.03

• No significant environmental incidents                                1.05          0.95        0.98      0.75

                                                          2007          2013          2014 (2)    2015    H1 2016

                                              …with a 28% reduction in LTIFR achieved in H1 2016                    7
ANGLO AMERICAN PLATINUM - 2016 INTERIM RESULTS PRESENTATION 25 JULY 2016
OPERATIONAL PERFORMANCE IN H1 2016
Loss-making ounces cut since 2013… efficiencies improving at operations…

                                                                      Total platinum production (‘000 ounces) (3)
• Total platinum production up 2% to 1,153 koz
                                                                2,355                                          2,337
• Retained own mine operations up 8% to 458 koz:                                        1,875
                                                                 1,160                                         1,212
  – Mogalakwena up 2% to 208 koz                                                        1,144
  – Amandelbult up 15% to 217 koz
  – Unki up 13% to 36 koz                                        1,195
                                                                                         731
                                                                                                               1,125               1,153

• Joint ventures total production up 8% to 388 koz
                                                                 2013                   2014                   2015              H1 2016
• Non-core operations down 5% to 294 koz                                                             H1   H2

  – Union up 15% to 75 koz                                   Pipeline & refined platinum inventory (‘000 ounces)
  – Rustenburg down 10% to 219 koz                                  Pipeline inventory                               Refined inventory
                                                                                               630
                                                                         580
                                                         Normalised                            60*
• Pipeline inventory build up due to Section 54 safety   Level: 440      130*

  stoppages and planned stock take at PMR in Q1 and
                                                                                               570             212               200
  additional stock count adjustments                         440         450      440                                   156
• Refined inventory levels dropped to 50 koz                                                                                                50

                                                           Dec-14     Jun-15    Dec-15     Jun-16          Dec-14      Jun-15   Dec-15     Jun-16
                                                            * Stock count adjustment

                  …enabling production performance to return to pre-strike production levels                                                     8
ANGLO AMERICAN PLATINUM - 2016 INTERIM RESULTS PRESENTATION 25 JULY 2016
MOGALAKWENA
Another record performance…

                                                                     Platinum production (‘000 ounces) (3) (4)
• Strong safety performance – 4 years fatality free                                      375
                                                                                                      392
                                                                           341
                                                             305
• Record production performance                                                          188
                                                                                                      188
                                                             142           174
  – Total tonnes milled increased 6%
  – Return to lower normalised grade in Q2                   163           167           188          204           208

                                                            2012          2013          2014          2015        H1 2016
                                                                                        H1     H2

                                                                          Cash operating margin (%) (5)
• Maintained cash operating margin of 49%                                                             50%
                                                      50%                               49%                         49%

• R2.1bn of operating free cash flow                                      46%
                                                                                                                                35
                                                      45%
                                                                                       35,625
                                                            39%                                      32,850        33,380       30
                                                      40%
                                                                         30,130
                                                      35%   27,385                                                              25

                                                      30%                                                                       20
                                                            2012          2013          2014         2015         H1 2016
                                                                      Cash Operating Margin         Rand Basket Price

                 ...through increased mining efficiencies, without the need for growth capital                              9
ANGLO AMERICAN PLATINUM - 2016 INTERIM RESULTS PRESENTATION 25 JULY 2016
AMANDELBULT
Focusing on making Amandelbult investable again…

• Tragically 2 fatalities in H1 2016                             Platinum production (‘000 ounces) (3)

• Strong production performance due to:                   373
                                                                                            437

  – Operational efficiencies in underground mining         192            218
                                                                                            248

  – New opencast area added 18 koz
                                                                          182                           217
                                                           181                              189
                                                                           36
• Unit cost per platinum ounce reduced by 3% due to       2013            2014              2015      H1 2016
  benefit of restructuring and strong mining                                      H1   H2
  performance
                                                                 Operating free cash flow (R million) (7)
                                                                                                         916

• R916 million in operating free cash flow                                                  616

• Chrome plant commissioning underway
  – Ramp up complete by H1 2017                           205

  – At steady state expected to contribute R350-400m                       23

    free cash flow per annum (6)                          2013            2014              2015      H1 2016

                                                 …with success visible in production performance                10
JOINT VENTURE OPERATIONS
Maintained strong performance…

SAFETY                                                       Lost time injury frequency rate (LTIFR) (1)
                                                      0.84
• LTIFR improved 10% to 0.56                                            0.69
                                                                                         0.62
                                                                                                     0.56

PRODUCTION
                                               (3)
• Strong mining performance up 8% to 388koz:
                                                      2013             2014              2015       H1 2016
  – Modikwa up 19% to 56 koz
                                                               Platinum production (‘000 ounces) (3)
  – BRPM up 16% to 92 koz
                                                      765               781              768
  – Mototolo up 11% to 62 koz
                                                      403               405              408
  – Kroondal up 6% to 137 koz
                                                      362               376                          388
  – Bokoni down 16% to 41 koz due to closure of                                          360

    unprofitable shafts, 2 fatalities and community
                                                      2013             2014              2015       H1 2016
    unrest
                                                                               H1   H2

                                                              …from the joint venture operations              11
NON-CORE OPERATIONS - RUSTENBURG & UNION
Focussed operational improvement…

RUSTENBURG (including WLTR)                              Production (‘000 ounces) (3)      Operating FCF (R million) (7)

                                                                                      H1           653
• Platinum production down 10% to 219koz impacted by     578
                                                                                      H2
  fatalities and difficult mining conditions                            485
                                                                                                                   439
                                                         244
• Tailings Retreatment increased 13% to 26koz                    283    241                318
                                                                                                           228
  – Ramp up of new tailings dams                         334     223
                                                                        244     219
• R439m operating free cash flow in H1 2016                      60
                                                         2013   2014    2015   H1 2016     2013    2014    2015   H1 2016

                                                         Production (‘000 ounces) (3)      Operating FCF (R million) (7)

UNION                                                    181                          H1                           212
                                                                                      H2
                                                                         141
• Strong platinum production up 15% to 75koz              83                                                33

                                                                 88      75
• R212m operating free cash flow in H1 2016 (8)
                                                          98     77
                                                                         66      75
                                                                                           (275)   (292)
                                                                  11

                                                         2013   2014    2015   H1 2016     2013    2014    2015   H1 2016

                                                  …leading to operating free cash flow generation                        12
REFINED PRODUCTION & SALES VOLUME IN H1 2016
Refined production impacted by the Section 54 stoppage and stock take at the PMR…
PMR                                                       Total refined platinum production (million ounces)

• Planned stock take and Section 54 stoppage impacted      2.32                            2.46
  the PMR for 12 days with a further 37 day impact                       1.89
                                                           1.36                            1.36
• Refined production heavily impacted in Q1 but largely                  1.03
  made up in Q2 - shortfall to be made up in H2 2016
                                                           1.02          0.86              1.10      1.01
PLATINUM
                                                           2013          2014              2015    H1 2016
• Platinum refined production down 9% to 1,008 koz                              H1    H2

                                                            Total platinum sales volume (million ounces)
• Platinum sales up 5% to 1,221 koz
                                                                                           2.47
                                                           2.32
  – Supplemented by drawdown in refined inventory and                    2.11

    market activities                                                                      1.31
                                                           1.25
                                                                         1.07
PALLADIUM & RHODIUM
                                                                                                     1.22
• Palladium refined production down 11%                    1.07          1.04              1.16

• Rhodium refined production down 2%                       2013          2014
                                                                                H1   H2
                                                                                           2015    H1 2016

                                 …drawdown in inventory helped supplement sales in H1 2016                     13
PLATINUM

FINANCIAL REVIEW
IAN BOTHA, FINANCE DIRECTOR

                              Vienna Philharmonic Orchestra Platinum Coin &
                                      American Eagle Platinum Bullion Coins
SUMMARY OF H1 2016 RESULTS
Lower stock gain impacting results…

   Headline earnings per share (Rand / share)                                                   Key financials
                                           0.41
                                                                          R billion                              H1 2015   H1 2016
                                  9.45

                                                                          Basket price (Rand / Pt ounce)          25,748    25,100
                                  5.99
                                                                          Sales revenue                             29.9      30.7
                                                              3.99
          3.01
                                                              1.62
                   2.41                                                   EBITDA                                     6.2       4.3
                                  4.22
 0.60                                                         3.29
                                                                          EBIT(9)                                    3.5       2.1
                                                   0.30
                                  (0.76)                      (0.92)
                                                   (2.48)
                                                                          Headline earnings                          2.5       1.0

                                                                          Project and SIB capex(10)                  1.6       1.4
                                                   (6.86)
                                                                          Net debt                                  12.9       9.9

                                                   (9.04)                 ROCE (%)                                  11%        8%
H1 2014          H2 2014         H1 2015          H2 2015   H1 2016
                                                                          Unit costs (Rand / Pt ounce)            19,095    19,436
  Stock Gain        Underlying       Restructuring Costs    Impairments

                                                                          …offset by strong operational performance             15
EBIT
  Earnings impacted by lower stock gain and weak US Dollar prices…

H1 2016 vs. H1 2015 (R billion)

            Once-off                              Uncontrollable                           Controllable                            Once-off

    3.5

               (2.2)
                                                                                                                                         2.1

                                                                                                                             0.6
                                                                                                                 1.5
                         1.3
                                                            (1.2)
                                                                                                 1.4
                                                   5.0                    0.5
                                  (4.6)
                                                                                 (0.4)

                                          (11)                     (12)                  (13)           (14)
  H1 2015      2015               Price          Currency    CPI                Basket          Costs          2016H1        2016      H1 2016
            Stock gain                                                           sales                          before    Stock gain
                                                                                volume                         once-off
                                                                                                                items

                               …offset by the weaker Rand and improved operational performance                                                   16
UNIT COST
 Management intervention keeping unit cost escalation below mining inflation…
 Unit cash cost escalation below mining inflation                                                   AAP’s mining inflation (%)
R/Pt oz                                                                        % of     12%              3%          48%                 26%
                                1.8%                                           cash
                                                                               cost
                                                                                        11.0%
                                (401)

                                                                                                        9.1%
              1,454                      (712)
                                                                                                                     8.1%     AAP mining inflation:
                                                 19,436     2016 guidance                                                    2016: 7.6% (2015: 6.9%)
                                                           R19,250 – R19,750
                                                                                                                             SA CPI = 6.3%
 19,095                                                                                                                       (2015: 4.6%) 6.3%

                                                                18,550

                         (15)
H1 2015     AAP mining          Costs   Volume   H1 2016      Retained
             inflation                                        assets in               Electricity      Diesel       Labour          Consumables
                                                              H1 2016

          …supported by operating cost and overhead savings, together with volume increases                                                            17
CAPITAL EXPENDITURE
Disciplined capital allocation continues…

                                                                         Capital expenditure (R billion) (10)
• Delivering value through reducing capital                2014
  intensity, without introducing risk                    Full year
                                                            5.8

• Increased SIB in own mine portfolio
                                                                                    2015
                                                                                  Full year
• Strong SIB governance                                                              3.7
                                                                                                                                 3.5 - 4.0

                                                                                                                                 0.8 - 1.0

Value accretive project capital advanced                    0.7
                                                                                                                 1.4
during 2016:                                                                         0.6                         0.3
                                                                                                                                 2.7 - 3.0
                                              2.2
                                                            1.5       1.6
• Amandelbult Chrome Plant                                                           1.0                         1.1

                                                          H1 2014                 H1 2015                  H1 2016                2016E
• Modikwa UG2
                                                                                              H1 Project         H1 SIB
• Bathopele Phase 5
                                                    R billion                              H1 2014     H1 2015         H1 2016   2016E

                                                    Capitalised waste stripping               0.4          0.5            0.6     1.2

            …aimed at maintaining asset integrity and adding value…not additional volume                                                     18
NET DEBT PROFILE
  Improved cash from operations and working capital reduction…

                      Net debt (R billion)                                       Net debt profile (R billion)

Opening net debt 1 January 2016                        12.8         14.6
                                                                                              12.8
Cash flow from operations                      (5.4)                                                                9.9

Working capital                                (1.3)

Capex and capitalised waste stripping           2.0

Cash tax paid                                   0.4              31 Dec 2014              31 Dec 2015           30 Jun 2016

Net interest paid                               0.7                            Liquidity headroom (R billion)
                                                                                                                   12.4
Other                                           0.4
                                                                                              9.6
Free cash flow                               (3.2)                  7.7                                             7.2

                                                                                              7.9
Total                                                   9.6         6.5
                                                                                                                    5.2
Restructuring costs                                     0.3         1.2                       1.7

                                                                31 Dec 2014              31 Dec 2015            30 Jun 2016
Closing net debt 30 June 2016                           9.9
                                                                 Committed facilities less gross debt     Cash

                                              …strengthening the balance sheet and increasing liquidity                       19
PLATINUM

MARKETS REVIEW
CHRIS GRIFFITH, CHIEF EXECUTIVE OFFICER
                                                  Honda Clarity

                                                  Toyota Mirai

                                                 Mercedes GLC

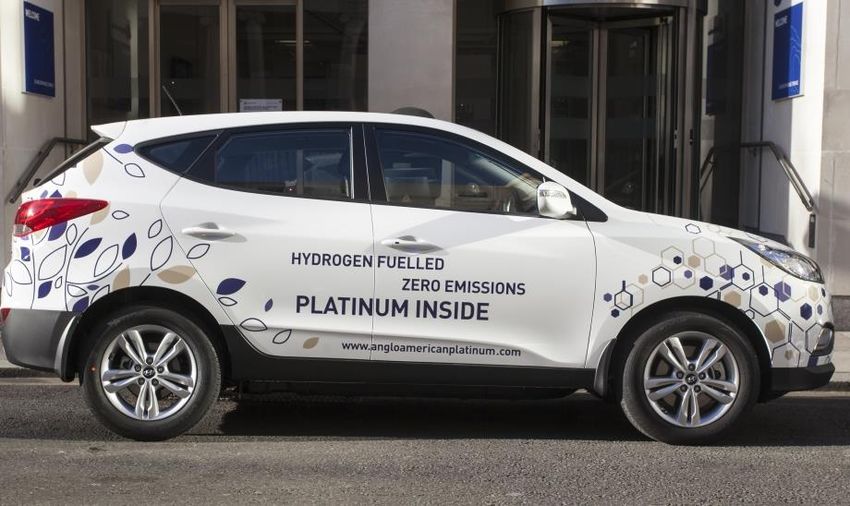
 Hyundai ix35 Fuel Cell Electric Vehicle
Hyundai ix35
MARKET PRICES
PGM prices were lower year-on-year in H1 2016…

                                                                                                    US Dollar platinum price (USD / oz)
US DOLLAR PLATINUM PRICE REMAINS BELOW
                                                                                        1,300
2015 LEVELS                                                                                                                   Y-o-y (17)%                      YTD +14%

                                                                  US Dollar per ounce
                                                                                        1,200

• The US Dollar platinum price regained some ground,                                    1,100
                                                                                                 H1 2015: $1,160/oz
                                                                                        1,000
  up 14% in H1 2016, however remained down 17%
                                                                                         900
  year-on-year                                                                           800                                                 H1 2016: $959/oz

• Platinum price benefited from the shift in US                                          700
                                                                                           Jan-15 Mar-15 May-15 Jul-15 Sep-15 Nov-15 Jan-16 Mar-16 May-16
  monetary policy and safe haven-buying on concerns                                              Platinum price                     Average platinum price H1 2016
                                                                                                 Average platinum price H1 2015
  around the global economy
                                                                                                               Realised basket prices
                                                                                 28,000
REALISED BASKET PRICE                                                                                                           Y-o-y (3)%                          2,150

                                                                                                                                                                            US Dollar per ounce
                                                                                                H1 2016: R25,100/oz

                                                       Rand per ounce
                                                                                 26,000
• H1 2016 realised basket prices                                                                                                                                    1,900
                                                                                 24,000
  ˗ US Dollar basket down 24% to $1,632/ oz
                                                                                                                                                                    1,650
                                                                                 22,000
  ˗ Rand basket down 3% to R25,100/ oz                                                                          H1 2016: $1,632/oz
                                                                                                                                                 Y-o-y (24)%
                                                                                 20,000                                                                             1,400
                                                                                      Jan-16          Feb-16     Mar-16     Apr-16      May-16       Jun-16
                                                                                        Rand basket price (LHS)                      2016 average Rand basket price
                                                                                        Dollar basket price (RHS)                    2016 average US Dollar basket price

                                             …despite recovering from a multi-year low in January                                                                         21
PLATINUM MARKET
2012, 2013, 2014 deficits dominated by once-off events…

DEMAND (+2%)                                                                  JM platinum market balance (‘000 ounces) (16)

• Global autocat demand forecast to grow slowly
                                                                         (185)
• Net jewellery demand expected to be steady. Growth
  expected in India with China set to stabilise
                                                                                                                   (659)
• Industrial demand continues to provide a solid foundation for                              (791)
                                                                                                                                      (861)
  platinum consumption with potential growth due to expansion                                          (991)
  in glass capacity                                                      2012                2013      2014            2015           2016E

• Physical demand for platinum continues to be positive                     JM platinum supply & demand 2016 vs 2015 (16)
SUPPLY (-1%)                                                       Thousand Ounces                   2015      2016           Y-o-Y           Δ%
                                                                   Demand
                                                                   • Autocat: Gross                  3,433     3,497             64         2%
• Primary production expected to be constrained due to limited     • Jewellery: Net                  2,253     2,263             10         0%
  capital spend in the industry as low prices weigh on producers   • Industrial                      1,749     1,919            170        10%
                                                                   • Investment                        451       332          (119)      (26)%
• Recycling expected to show growth from depressed 2015                                              7,886     8,011            125         2%
  levels
                                                                   Supply
                                                                   • Primary                         6,076     5,899          (177)       (3)%
BALANCE                                                            • Recycling: Auto & Industrial    1,151     1,251            100         9%
                                                                                                     7,227     7,150           (77)       (1)%
• Platinum market is forecast to be in deficit in 2016
                                                                   Market Balance                    (659)     (861)

           …however 2015 shows a normal market…deficits expected to continue into 2016                                                         22
PLATINUM MARKET - AUTOMOTIVE
Strong European sales momentum in the first half of the year…

• Autocat demand is expected to grow for the full year:   Global light duty vehicle sales (H1 2016 vs H1 2015)
                                                             9%
  – Sales in Western Europe up 9%                                                                8%
  – Slightly higher loadings due to Euro 6b legislation
  – Diesel share in line with expectation                                                                         4%

• Heavy Duty Diesel still a growth market                                             2%

  – Legislation emission introduced
                                                          W. Europe            N. America       China            Global
  – Production growth
                                                                       Fuel cell electric vehicle launches
• Fuel Cell Electric Vehicles (FCEVs) – technology
  developments proceeding well, challenges include:

  – Infrastructure: first mover challenges, OEM
                                                                                                 Launched 2015
    confidence & investment                                           Launched 2013

  – Awareness: increase visibility of FCEVs, and
    government, industry and consumer education to
    positively impact perception
                                                                                  Launch 2016    Launch 2017

                                              …with steady global demand growth in 2016 forecast                          23
PLATINUM MARKET – AUTOMOTIVE CONTINUED
Trend towards greater electrification of the drivetrain will continue…

                                                         Forecast annual light duty vehicle production (millions) (17)
AUTOMOTIVE MARKET EXPECTED TO GROW
                                                          120                                                   11m

• Internal combustion engine market expected to grow      100
                                                                3m
  despite lower market share in the future                 80
                                                                                                                85m
                                                           60                      Gasoline
• PGM demand forecast to be robust over this               40
                                                                70m

  timescale
                                                           20
                                                                                                                23m
                                                                18m                 Diesel
                                                            0
                                                             2015 2016 2017 2018 2019 2020 2021 2022 2023 2024 2025
                                                                          Diesel  Gasoline Electric Hybrids

ELECTRIFICATION WILL INCREASE                             Forecast electric vehicle penetration rates (millions) (17)
                                                           12
• Alternative powertrain penetration forecast to be        10
  10% by 2025                                               8

• Hybrid electric vehicles account for the majority of      6

  these vehicles                                            4                   Hybrid Electric
                                                            2
• Hybrid electric vehicles contain similar amounts of       0                       Electric
  platinum group metals to conventional vehicles             2015 2016 2017 2018 2019 2020 2021 2022 2023 2024 2025
                                                                                   Electric   Hybrids

                                                    ….but PGM autocatalyst market expected to grow                    24
PLATINUM MARKET - JEWELLERY
Focus on China’s ability to return to growth…

                                                            Platinum Guild International performance 2015 YoY
• Global jewellery demand expected to improve in 2016
• SGE volumes give insight into Chinese jewellery
  performance:
  – Suggests some recovery underway
                                                                            24% 25%
  – H1 2016 platinum volumes up 3.7% versus H1 2015
• India expected to continue trajectory as a fast growing
  market
                                                                                                                 12%
                                                                                                          10%
                                                                   8%
• Platinum Guild International (PGI)                                                             6%
                                                                                           3%
  – Focus on China – with PGI outperforming rest of
    market                                                  (4)%

  – Evara and Platinum Day of Love initiatives delivering
    results in India

                                                              China            India         Japan           USA

                                                            Platinum jewellery growth   PGI strategic partner growth

                                                            …with initial indications in 2016 positive                 25
PLATINUM MARKET – INVESTMENT
Exchange Traded Funds (ETF) liquidation slows and physical investment steady…

                                                                                     Platinum ETF holdings (million ounces)
• Overall investment flows healthy in 2015 and again in
                                                                           3.0
  H1 2016
                                                                           2.5
  – Improved sentiment in platinum market

                                                          Million Ounces
                                                                           2.0
  – Platinum ETF holdings stable in H1 after some
                                                                           1.5
    liquidation in H2 2015
                                                                           1.0
  – Physical investment in Japanese bars has
    continued in 2016 with c.320 koz in H1 2016                            0.5

    (vs. 630 koz in 2015)                                                  0.0
                                                                            Jan-10    Jan-11   Jan-12   Jan-13   Jan-14   Jan-15   Jan-16

                                                                                 Vienna Philharmonic Orchestra platinum coin
• World Platinum Investment Council (WPIC)
  – Promotional support to Japan’s Fruit of Platinum
    ETF backed by Mitsubishi
  – Austrian mint issues first platinum coin as part of
    the prestigious Vienna Philharmonic range
  – Partnership with Valcambi to boost physical
    demand of bars and coins and stimulate
    investment growth in the US

                                                                                       …as sentiment and price improve                      26
PLATINUM

STRATEGY REVIEW
CHRIS GRIFFITH, CHIEF EXECUTIVE OFFICER

                                             Johnson Matthey
                                             platinum-bearing
                                             autocatalyst filter
STRATEGY REVIEW
Three key areas of our strategy…

 Our value driven strategy is built around three key deliverables:

      1      Repositioning our assets into a value maximising portfolio
             ˗ Positioned in the first half of the cost curve
             ˗ At least 70% mechanised mining
             ˗ More highly skilled work force
             ˗ Safer operations
             ˗ Less complex organisation

      2      Extracting the full value from our operations – ensuring we optimise each of our
             assets to their potential

      3      Developing the market for PGMs and preparing for the future
             - Market development – focus on creating incremental demand for PGMs
             - Innovation – focus on unlocking value through modernisation in mining and processing
               technology
             - People and Communities – investing in building relationships to create a sustainable
               and productive environment in which we operate

                                                  …to generate long term value through the cycle      28
1       REPOSITIONING THE PORTFOLIO
 Restructuring largely complete…repositioning of the portfolio progressing…

Restructuring since 2013…                                  …now repositioning the               …and rightsizing the overhead
                                                                portfolio…
 1. RESHAPE RUSTENBURG
 •   Optimised and integrated 5 mines to 3 in 2013                                      5.4
 •   Further consolidation to 2 in 2015                        Non-core Assets
 •   Volume reductions ~210koz Pt                                                                              Full year
 •   Sale agreement signed in 2015 with Sibanye Gold                                              (0.6)        Run Rate
                                                                                                                R1bn
                                                                 Rustenburg                       (0.4)
 2. RESHAPE UNION
 •   Consolidated Union North and South Mines
                                                                                                Achieved in
 •   Closed the North and South declines
                                                                                                 H1 2016
 •   Volume reductions of ~80koz Pt                                 Union                                       (0.7)
 •   Prepare for exit through sale
 •   Section 189 completed on 30 June
                                                                   Pandora                                                   (0.3)   3.4
 3. SIMPLIFY JV PORTFOLIO AND
 MAXIMISE VALUE
 • Consider exit options for Bokoni and Pandora
 • Bokoni mine optimised. Restructuring and shaft
                                                                    Bokoni
   closures in 2015
 • 2016 decision to exit Kroondal for value
                                                                  Kroondal
 4. TWICKENHAM ON CARE AND
 MAINTENANCE

                                                                                                                Rustenburg
                                                                                         2014

                                                                                                   Reduction

                                                                                                                             Union

                                                                                                                                     2017E
                                                                                                   Overhead

                                                                                                                              Exit
 • Project was unprofitable so put on care and

                                                                                                                   Exit
   maintenance
 • Section 189 completed on 30 June

                                                       …and early benefits as a result of rightsizing the overhead                           29
1   REPOSITIONING THE PORTFOLIO
Focus remains on repositioning the portfolio…

             Anglo American Platinum retained portfolio

         Retained assets                Optionality - projects
                                  • For now – high value, capital
    • Mogalakwena                   light, short payback
    • Amandelbult                   + Amandelbult Chrome Plant            1   High quality assets
                                    + Mogalakwena
    • Unki                            debottlenecking & ore sorting       2   Low cost production
                                    + Unki smelter
    • BRPM (JV)                     + Dishaba UG2 reef
                                                                          3   High margin ounces
    • Mototolo (JV)               • Major projects
    • Modikwa (JV)                  ˗   Styldrift continues               4   Reduced safety risks
                                    ˗   Decisions delayed after 2017
                                    ˗   In-line with market demand
    • Processing                    ˗   Dependent on strength of
                                        balance sheet

                                                …to generate long term value through the cycle       30
2    OPERATIONAL EXCELLENCE
    A key focus ensuring all assets are optimised……

                        Mogalakwena                                                            Amandelbult
                                          Platinum production
•       95 koz additional production –        (’000 ounces)
                                                                     •    Extracting the full potential of      Platinum production
                                                                                                                    (‘000 ounces)
        no major capex                                                    the resource – chrome                                   450+
                                                                          recovery plant                                430
•       Studying alternate options to
        scale production – less capital                              •    Half level optimisation            350
                                                           400
        and higher return                   305                      •    Tumela Upper replacement,
                                                                          through pre-developed Dishaba
                                                                          UG2 – limited capital
                                            2012          2016E                                              2012     2015      2016E

                           Process                                                                   SIB
• Delivering optimal utilisation and      Base Metal production       •   Capital allocation to maximise value, by
                                              (‘000 tonnes)
  increased efficiency                                                      •   Specialised capital excellence team
                                                             42
    •     BMR ramp-up                              34                       •   SIB investment committee
    •     Improve copper recovery           25
                                                                            •   Revised project execution strategy
          (2014: 66% to 2015: 74%)
                                                                      •   Ensuring thoughtful, risk-based approach, allocation of
    •     Smelter rebuild times                                           capital to sustain operations
          dramatically reduced
                                          2013     2014     2015

                                                                   …improving cash flow generation and returns                      31
3       DEVELOP MARKET FOR PGMS & PREPARE FOR THE FUTURE
Focussed investment in key areas…

                       • Automotive – fuel cell market development, hydrogen
    a                      infrastructure development through PGM Investment
         Market            Fund
         Development   • Jewellery – PGI focus on China and India
                       • Investment – product availability through WPIC

                       • Testing – Centre at Twickenham to test mechanised
    b                     and cutting technology
         Mining
         Innovation    • Fuel cells – applications to support fuel cell usage –
                          fuel cell dozers and locos
                       • Process – ore sorting technology to improve recovery

                       • Modernisation – Investment in colleges and schools
    c                     to secure new skill sets required with mechanisation
         People &
                       • Cultural Transformation – engaging with employees
         Communities      and unions to create strong relationships
                       • Social Labour Plans – ensure communities live in
                          stable and serviced communities

                                                                  …to secure a successful future   32
PLATINUM

OUTLOOK
CHRIS GRIFFITH, CHIEF EXECUTIVE OFFICER

                                           Connecticut Transit
                                           Hydrogen Fuel Cell
                                                          Bus
2016 OUTLOOK
All previous guidance remains in place…

• Platinum production expected to be at the upper end of guidance of 2.3 - 2.4 Moz

• Unit cash cost guidance unchanged at between R19,250 – R19,750 / platinum ounce

• Direct overhead / indirect savings of R1.0 billion targeted to be achieved by Q4 2016

• Capital expenditure guidance reduced to between R3.5 billion – R4.0 billion
  (previously R3.7 – 4.2 billion)

• Net debt will reduce further in 2016 at current spot prices and FX rates

• Repositioning of the portfolio continues – anticipate completion of Rustenburg
  disposal in 2016

                                                           …delivering on our promises    34
PLATINUM

APPENDICES
NET DEBT AND CASH FLOW BY MINE
       Despite weaker Rand basket price…

                                          R5.0bn                                                                    (R1.8bn)

                                                    (1.7)
                                                                                       (0.3)
                                                                      (7.7)                                 (1.1)
                                   6.7                                                                                         (0.3)           (0.1)                              (0.3)
                                                                                                                                                                   (9.6)                            (9.9)

                  (12.8)                                                                                                                                  R3.2bn
                  Net Debt                                          Operating                              Current                                                Net Debt                         Net Debt
                 December       Cash from        SIB & Waste        Free cash         Project             Taxation &      Funding of                           before one-off Restructuring         June
  Operation        2015         Operations          capital           flow            capital              Interest       Associates           Other               items          Costs              2016
Mogalakwena                           3,201            (1,123)            2,078                     (7)                                                                                        3
Amandelbult                           1,001                  (85)             916               (21)                                                                                       (12)
Unki                                     111                 (39)              73               (64)                                                                                       -
Twickenham                               (167)                (2)             (168)             (10)                                                                                       (91)
NMT                                       (47)                (0)              (47)                 (3)                                                                                    -
Joint Ventures                        1,117                 (180)             936               (37)                                                                                       (12)
Associates                               318                 (11)             306               -                                      (267)                                               -
3rd Parties                               (29)                (1)              (30)             -                                                                                          -
Rustenburg                              608               (169)             439                (199)                                                                                        (95)
Union                                   232                (20)             212                  -                                                                                          (82)
Company(18)                             355                (38)             316                    6            (1,121)                                (118)                                (55)
                     (12,769)         6,699            (1,669)            5,030                (334)           (1,121)                 (267)           (118)          (9,579)             (344)        (9,923)

                                                                                                                                                                …mines cash positive                        36
COST BREAKDOWN

                   Labour &
                                 Consumables   Diesel   Electricity   Sundries & Water
                  Contractors

Conventional         67%            17%         1%         8%               7%

Mechanised           65%            19%         4%         3%               9%

Open Pit             23%            44%        10%         10%              13%

Company              48%            26%         3%         12%              11%

• Non ZAR – 10% of total costs
   ˗ 100% at Unki
   ˗ 25% at Mogalakwena

                                                                                         37
FOOTNOTES

(1)    Lost time injury frequency rate per 200,000 hours worked
(2)    2014 LTIFR normalised for the 5 month long strike
(3)    Platinum production: platinum in concentrate produced and purchased
(4)    Mogalakwena production includes ounces treated at Baobab concentrator
(5)    Calculated as (revenue less cash operating costs) / revenue
(6)    Chrome free cash flow of R350 – 400m assumed at spot prices of 30 June 2016
(7)    Operating free cash flow is defined as free cash flow for operating mines after full overhead allocation, SIB capex, capitalised
       waste stripping and minorities. It is presented before project capex and one-off restructuring costs
(8)    Union free cash flow is attributable to the Company
(9)    EBIT is earnings before interest and tax including profits and losses from associates
(10)   Project and SIB capital expenditure excludes capitalised waste stripping and interest capitalised
(11)   Price variance calculated as increase/(decrease) in US Dollar price multiplied by current period sales volume
(12)   Inflation variance calculated using CPI on prior period cash operating costs that have been impacted directly by inflation
(13)   Sales volume variance calculated as increase/(decrease) in sales volume multiplied by prior period cash margin
(14)   Costs include cash operating costs, inventory movements, depreciation and profit or loss from associates
(15)   AAP Mining inflation is CPI and inflation above CPI as experienced by AAP based on its basket of costs
(16)   Source: Johnson Matthey, May 2016 Report
(17)   Source: LMC Automotive
(18)   Company costs includes mainly marketing expenses and corporate SIB expenditure

                                                                                                                                          38
You can also read