SILVER SYMPOSIUM United States' Leading Silver Producer - RESPONSIBLE. SAFE. INNOVATIVE - Public now
←
→
Page content transcription
If your browser does not render page correctly, please read the page content below
SILVER
SYMPOSIUM

United States’ Leading
Silver Producer

September 27, 2021

                         RESPONSIBLE. SAFE. INNOVATIVE.

NYSE: HL
CAUTIONARY STATEMENTS

 Cautionary Statement Regarding Forward Looking Statements

 This presentation contains “forward-looking statements” within the meaning of Section 27A of the Securities Act of 1933, as amended, and Section 21E of the Securities Exchange Act of
 1934, as amended, which are intended to be covered by the safe harbor created by such sections and other applicable laws, including Canadian securities laws. When a forward-looking
 statement expresses or implies an expectation or belief as to future events or results, such expectation or belief is expressed in good faith and believed to have a reasonable basis.
 However, such statements are subject to risks, uncertainties and other factors, which could cause actual results to differ materially from future results expressed, projected or implied by
 the forward-looking statements. Forward-looking statements often address our expected future business and financial performance and financial condition and often contain words such as
 “anticipate,” “intend,” “plan,” “will,” “could,” “would,” “estimate,” “should,” “expect,” “believe,” “project,” “target,” “indicative,” “preliminary,” “potential” and similar expressions. Forward-looking
 statements in this presentation may include, without limitation: : (i) expected increase in Lucky Friday’s silver production to approximately 5 million ounces by 2023; (ii) new mining
 methods being tested at Lucky Friday to better manage seismicity and potentially increase productivity; (ii) Green Creek's estimated 2021 silver production of 9.5 - 10.2 million ounces is
 unchanged and gold production increased to 43 - 45 thousand ounces, estimate for 2021 cost of sales updated to $222 million, estimated cash cost and AISC, each per silver ounce
 updated to ($1.00)-$1.00 and $3.25-$4.00, respectively; (iii) Casa Berardi's estimated 2021 gold production is increased to 128 - 132 thousand ounces, estimate for 2021 cost of sales
 updated to $220 million, estimated cash cost and AISC, each per gold ounce updated to $1,000-$1,125 and $1,200-$1,325, respectively; (iv) Lucky Friday's estimated 2021 silver
 production of 3.4 - 3.8 million ounces is unchanged, estimate for 2021 cost of sales updated to $103 million, estimated cash cost and AISC, each per silver ounce updated to $7.60-$8.50
 and $14.25-$16.25, respectively; (v) business improvement activities at Casa Berardi are expected to reduce costs and increase cash flow over next two years; and (vi) Company-wide
 estimates of future production, sales, costs of sales, cash cost, after by-product credits, AISC, after by-product credits, as well as estimated spending on capital, exploration and pre-
 development for 2021.The material factors or assumptions used to develop such forward-looking statements or forward-looking information include that the prices assumed in the
 calculation of cash cost and AISC will occur and the Company’s plans for development and production will proceed as expected and will not require revision as a result of risks or
 uncertainties, whether known, unknown or unanticipated, to which the Company’s operations are subject.
 .
 Estimates or expectations of future events or results are based upon certain assumptions, which may prove to be incorrect, which could cause actual results to differ from forward-looking
 statements. Such assumptions, include, but are not limited to: (i) there being no significant change to current geotechnical, metallurgical, hydrological and other physical conditions; (ii)
 permitting, development, operations and expansion of the Company’s projects being consistent with current expectations and mine plans; (iii) political/regulatory developments in any
 jurisdiction in which the Company operates being consistent with its current expectations; (iv) the exchange rate for the USD/CAD and USD/MXN, being approximately consistent with
 current levels; (v) certain price assumptions for gold, silver, lead and zinc; (vi) prices for key supplies being approximately consistent with current levels; (vii) the accuracy of our current
 mineral reserve and mineral resource estimates; (viii) the Company’s plans for development and production will proceed as expected and will not require revision as a result of risks or
 uncertainties, whether known, unknown or unanticipated; (ix) counterparties performing their obligations under hedging instruments and put option contracts; (x) sufficient workforce is
 available and trained to perform assigned tasks; (xi) weather patterns and rain/snowfall within normal seasonal ranges so as not to impact operations; (xii) relations with interested parties,
 including Native Americans, remain productive; (xiii) economic terms can be reached with third-party mill operators who have capacity to process our ore; (xiv) maintaining availability of
 water rights; (xv) factors do not arise that reduce available cash balances; and (xvi) there being no material increases in our current requirements to post or maintain reclamation and
 performance bonds or collateral related thereto.

NYSE: HL                                                                                                                                                                   RESPONSIBLE. SAFE. INNOVATIVE. l 2
CAUTIONARY STATEMENTS (cont’d)
Cautionary Statement Regarding Forward Looking Statements (Cont’d)
In addition, material risks that could cause actual results to differ from forward-looking statements include, but are not limited to: (i) gold, silver and other metals price volatility; (ii) operating
risks; (iii) currency fluctuations; (iv) increased production costs and variances in ore grade or recovery rates from those assumed in mining plans; (v) community relations; (vi) conflict
resolution and outcome of projects or oppositions; (vii) litigation, political, regulatory, labor and environmental risks; (viii) exploration risks and results, including that mineral resources are not
mineral reserves, they do not have demonstrated economic viability and there is no certainty that they can be upgraded to mineral reserves through continued exploration; (ix) the failure of
counterparties to perform their obligations under hedging instruments; (x) we take a material impairment charge on our Nevada operations; (xi) we are unable to remain in compliance with
all terms of the credit agreement in order to maintain continued access to the revolver, and (xii) we are unable to refinance the maturing senior notes. For a more detailed discussion of such
risks and other factors, see the Company’s 2020 Form 10-K, filed on February 18, 2021, with the Securities and Exchange Commission (SEC), as well as the Company’s other SEC filings.
The Company does not undertake any obligation to release publicly revisions to any “forward-looking statement,” including, without limitation, outlook, to reflect events or circumstances after
the date of this news release or to reflect the occurrence of unanticipated events, except as may be required under applicable securities laws. Investors should not assume that any lack of
update to a previously issued “forward-looking statement” constitutes a reaffirmation of that statement. Continued reliance on “forward-looking statements” is at investors’ own risk.

Cautionary Note Regarding Estimates of Measured, Indicated and Inferred Resources
The disclosures herein regarding mineral reserves and resources are as of December 31, 2020. For disclosures prior to January 1, 2021, the SEC permits mining companies, in their filings with the
SEC, to disclose only those mineral deposits that a company can economically and legally extract or produce. We use certain terms in this presentation, such as “resource,” “measured resources,”
“indicated resources,” and “inferred resources” that are recognized by Canadian regulations, but that prior to January 1, 2021, SEC guidelines generally prohibited U.S. registered companies from
including in their filings with the SEC. U.S. investors are urged to consider closely the disclosure in our most recent Form 10-K and Form 10-Q. You can review and obtain copies of these filings from
the SEC’s website at www.sec.gov.

Qualified Person (QP) Pursuant to Canadian National Instrument 43-101
Kurt D. Allen, MSc., CPG, Vice President - Exploration of Hecla Mining Company and Keith Blair, MSc., CPG, Chief Geologist of Hecla Limited, who serve as a Qualified Person under National
Instrument 43-101("NI 43-101"), supervised the preparation of the scientific and technical information concerning Hecla’s mineral projects. Information regarding data verification, surveys and
investigations, quality assurance program and quality control measures and a summary of analytical or testing procedures for the Greens Creek Mine are contained in a technical report titled
“Technical Report for the Greens Creek Mine” effective date December 31, 2018, and for the Lucky Friday Mine are contained in a technical report titled “Technical Report for the Lucky Friday Mine
Shoshone County, Idaho, USA” effective date April 2, 2014, for Casa Berardi are contained in a technical report titled "Technical Report on the mineral resource and mineral reserve estimate for Casa
Berardi Mine, Northwestern Quebec, Canada" effective date December 31, 2018 (the "Casa Berardi Technical Report"), and for the San Sebastian Mine, Mexico, are contained in a technical report
prepared for Hecla titled “Technical Report for the San Sebastian Ag-Au Property, Durango, Mexico” effective date September 8, 2015 . Also included in these four technical reports is a description of
the key assumptions, parameters and methods used to estimate mineral reserves and resources and a general discussion of the extent to which the estimates may be affected by any known
environmental, permitting, legal, title, taxation, socio-political, marketing, or other relevant factors. Information regarding data verification, surveys and investigations, quality assurance program and
quality control measures and a summary of sample, analytical or testing procedures for the Fire Creek Mine are contained in a technical report prepared for Klondex Mines, dated March 31, 2018; the
Hollister Mine dated May 31, 2017, amended August 9, 2017; and the Midas Mine dated August 31, 2014, amended April 2, 2015. Copies of these technical reports are available under Hecla's and
Klondex's profiles on SEDAR at www.sedar.com. Mr. Allen and Mr. Blair reviewed and verified information regarding drill sampling, data verification of all digitally collected data, drill surveys and
specific gravity determinations relating to all the mines. The review encompassed quality assurance programs and quality control measures including analytical or testing practice, chain-of-custody
procedures, sample storage procedures and included independent sample collection and analysis. This review found the information and procedures meet industry standards and are adequate for
Mineral Resource and Mineral Reserve estimation and mine planning purposes.

Mr. Allen and Mr. Blair reviewed and verified information regarding drill sampling, data verification of all digitally-collected data, drill surveys and specific gravity determinations relating to the Casa
Berardi Mine. The review encompassed quality assurance programs and quality control measures including analytical or testing practice, chain-of-custody procedures, sample storage procedures and
included independent sample collection and analysis. This review found the information and procedures meet industry standards and are adequate for Mineral Resource and Mineral Reserve
estimation and mine planning purposes.

Cautionary Note Regarding Non-GAAP measures
Cash cost per ounce of silver and gold, net of by-product credits, EBITDA, adjusted EBITDA, AISC, after by-product credits, and free cash flow represent non-U.S. Generally Accepted Accounting
Principles (GAAP) measurements. A reconciliation of these non-GAAP measures to the most comparable GAAP measurements can be found in the Appendix.

NYSE: HL                                                                                                                                                                    RESPONSIBLE. SAFE. INNOVATIVE. l 3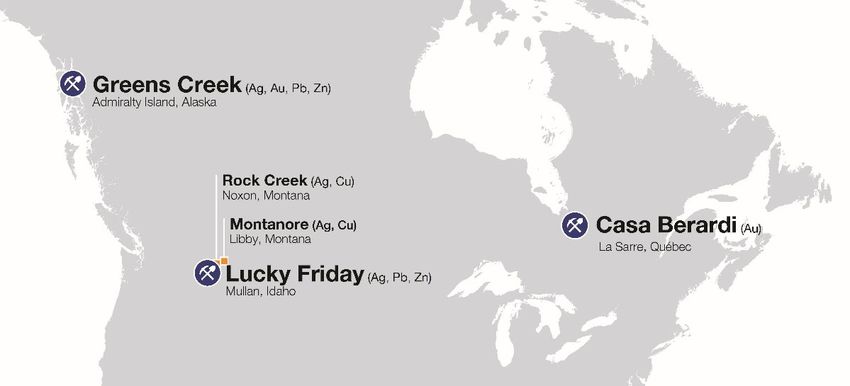
WHY INVEST IN HECLA?
Hecla is unique to other silver miners, ETFs and physical silver
Primarily U.S. based operations – the right jurisdiction for
risk and ESG
Highest-grade silver miner in the world with the third
largest resource base
Long-lived mines with decades ahead of us
Produce 40% of silver mined in the US
Generated near-record second quarter
Silver production is growing
Exploration success at silver and gold properties
Consistent dividend payments and only dividend linked to
silver price
Announced 3rd increase in dividend in the past 12
months
Brand value – 130 years old and over 50 years on NYSE
NYSE: HL RESPONSIBLE. SAFE. INNOVATIVE. l 4HECLA IS THE LEADER IN METAL PRODUCED PER TON OF GHG
Highest-grade silver mines generate more benefit with smaller footprint
Silver-equivalent ounces /Ton GHG Gold-equivalent ounces/Ton GHG
1.2 500
450
1.2 6
1
400
350 1 5
0.8
300
0.8 4
0.6 250
200 0.6 3
0.4
150 0.4 2
100
0.2
0.2 1
50
0 0 0 0
Hecla Coeur Pan American First Majestic Newmont Hecla Coeur Pan American First Majestic Newmont
NYSE: HL ESG RESPONSIBLE. SAFE. INNOVATIVE. l 5COMPARISON TO PEERS – RESERVES AND ORE GRADES
Hecla has highest reserve grade and third largest reserve base
Reserves & Reserve Grade
AgEq Reserves (mmoz) AgEq Reserve Grade (g/t)
1,297 587
1,138
441
430
376 369
354
516 511
147
130 291
158 158
133
36 103 104 83
Fresnillo Pan American Hecla Coeur Fortuna Silvercorp First Majestic Gatos Silver Hochschild Endeavour Silver
NYSE: HL Source: TD Securities HIGHEST-GRADE SILVER MINER RESPONSIBLE. SAFE. INNOVATIVE. l 6HECLA MINES >40% OF ALL SILVER PRODUCED IN THE USA
Half of the world’s production is from Mexico, Peru and China; U.S. production is scarce
2020 U.S. Silver Production Hecla’s Share of U.S. Production
(Moz)
13.5 43%
57%
Hecla Other
6.5 3 Countries. Produce ~50% of World Production
U.S. Produces 4%
3.2
2.2 22%
0.9 48%
13%
Hecla Teck Coeur Rio Tinto Americas Gold &
Silver 13%
4%
Mexico Peru China USA ROW
Source: Silver Institute; Company Reports HIGHEST-GRADE SILVER MINER
NYSE: HL RESPONSIBLE. SAFE. INNOVATIVE. l 7NEAR-RECORD SECOND QUARTER: 2nd BEST ON MULTIPLE METRICS
Strong prices, production and cost management led to performance; guidance improved
Near-Record • Second highest Sales of $218.0 million, Gross Profit of $59.3 million,
Adjusted EBITDA(1) of $84.0 million, Cash Flow from Operations of $86.3
Quarter million (highest in 5 years)
Silver Revenue & • Record Realized Silver Margin(2) of $19.60 per ounce with silver contributing
Margin Expansion 40% of quarterly revenues.
Guidance • Lowering consolidated silver cash cost(3) and all-in sustaining silver
Improvement cash cost(4) guidance to a midpoint of $1.50 and $10 per ounce, respectively
• Strong balance sheet, $181 million in cash, > $400 million in liquidity; $54.4
Financial Strength million of quarterly free cash flow(5)
• 16% of YTD 2021 free cash flow(5) returned to stockholders as dividends.
Leading Dividend • 40 consecutive quarters of dividend payments (Paid $72 million in common
Policy dividends since 2011, 6% of our cash flow from operations)
• Greens Creek recognized as Large Business of the Year in Alaska,
Efficient and safe COVID-19 management with company-wide vaccination
ESG Commitment rates higher than the U.S. average, Published our 2020 sustainability report
“Small Footprint, Large Benefit”
HIGHEST-GRADE SILVER MINER
NYSE: HL RESPONSIBLE. SAFE. INNOVATIVE. l 8GREENS CREEK: CONSISTENT, STRONG PERFORMANCE
Cash flow from operations of $276 million and Free Cash Flow $255 million in the last 5 quarters
• Fourth highest quarterly free cash flow of $63.5 million since
2008
• Despite lower grades, lowered guidance for Cash Cost and
AISC again due to higher by-product credits, lower
production costs and favorable changes in smelter terms
• Cost of sales $222 million
• Cash Cost* at ($1.00) - $1.00
• AISC* at $3.25 - $4.00
• Workforce is nearly 90% vaccinated
Silver AISC per ounce and Margins per ounce Free Cash Flow(5)
Cost of $57.7 $51.1 $59.2 $53.2 $55.5 Cash Flow
from $37.8 $67.1 $58.3 $44.3 $68.5
Sales(7):
Operations:
($ millions)
($ millions)
61.9 63.5
51.1
$13.11 42.7
$17.62
$26.46 36.4
$11.33 $24.07
$12.05
$7.11 $7.70 $1.59 $0.68
2Q 2020 3Q 2020 4Q 2020 1Q 2021 2Q 2021
Q2 2020 Q3 2020 Q4 2020 Q1 2021 Q2 2021
(4) (2)
AISC* Realized Price Margin
NYSE: HL * Cash Cost and All-in sustaining cost (AISC) is a non-GAAP measure, HIGHEST-GRADE SILVER MINER RESPONSIBLE. SAFE. INNOVATIVE. l 9
reconciliation to GAAP is shown in appendix.HECLA IS INCREASING SILVER PRODUCTION
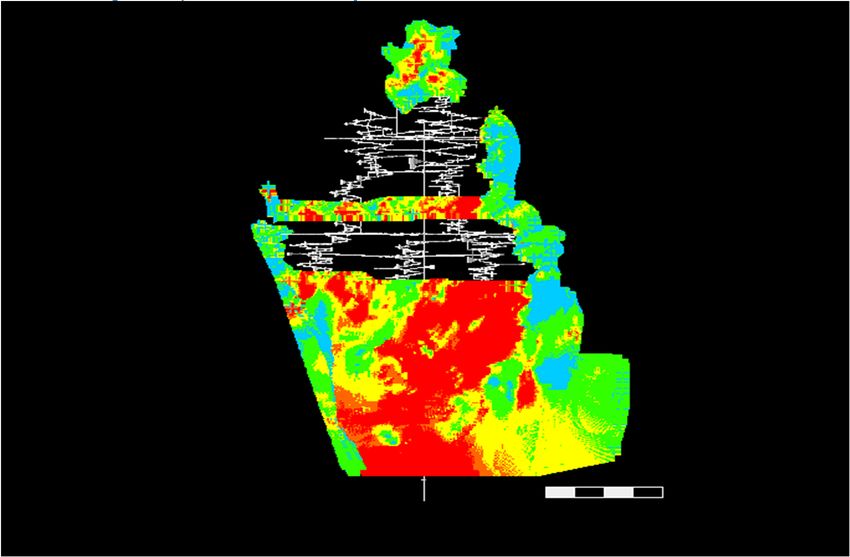
Lucky Friday production tripled over last year, expected to be 75% more in 2021 and 5 million
ounces by 2023, 2.5 times 2020 production
30 Vein - *AgEq Grade (opt)
20 Years
Past Mining
< 10
10 - 20
Almost 20 - 30
6500 Level 30 - 35
1000 feet
> 35
@ +35
Oct. 12, 2020
AgEq
*Ag Equivalent Values Based on
7500 Level metal prices of $16.50/oz
Ag, $0.85/lb Pb, and $1.00/lb Zn
** Cutoff grade 11 AgEq
*** 2020 average grade 25 AgEq
#4 Shaft 1000 Feet
Looking North
NYSE: HL GROWTH RESPONSIBLE. SAFE. INNOVATIVE. l 10HECLA’S 2021 EXPLORATION
20 Drill rigs company wide focused on expanding and discovery of resources
Nevada
• Drilling the new discovery at Midas
• Defining targets at Aurora
• Development to Hatter Graben for exploration
drilling
Greens Creek
• Expanding and upgrading resources in the Upper
Plate, 9A, and Northwest West ore zones
• Surface drill testing the Lil’Sore and 5250 targets
Casa Berardi
• Expanding resources in the West, Principal, and
East Mines
San Sebastian
• Drill testing deeper levels of the El Bronco and El
Tigre vein systems
Heva Hosco
• Exploring high-grade extensions at depth
Kinskuch
• Drill testing northern extension of the Illiance target
NYSE: HL GROWTH RESPONSIBLE. SAFE. INNOVATIVE. l 11A VERY SHORT HISTORY ON SILVER DEMAND
Despite declining photography demand, silver industrial and investment demand has been in a
secular bull market since 2000 and is stronger in 2021 and the future
Five distinct periods of silver demand, three that are strengthening
• Monetary by governments (2000 BC to 1800 AD)
• Photographic (1900 to 1999)
• Industrial (1940 - )
• Investment (2000 - )
• Energy (2010 - )
20 YEAR CHANGE IN DEMAND
Million Ounces
1999 2019 % Increase
If the decrease in
Industrial 343 511 49% photographic demand is
removed, silver demand
Photography 246 34 -86% increases 441 million
Jewelery/Silverware 260 260 0% ounces or 61%
Investment 26 268 931%
Total 875 1073 23%
Source – World Silver Survey 2020
NYSE: HL RESPONSIBLE. SAFE. INNOVATIVE. l 12RENEWABLE ENERGY GAINS MOMENTUM – SOLAR PROJECTED
FOR THE LARGEST GROWTH
Global policies are favoring renewable energy
• In the U.S., renewable energy projected to double from 21% in 2020 to 42% by 2050
• Solar energy generation as a percentage of renewable energy forecast to increase 3x by 2050 from 16% to
47%
U.S. Electricity Generation* U.S. Renewable Electricity Generation*
Annual Economic Outlook 2021, Reference Case Annual Economic Outlook 2021, Reference Case
NYSE: HL * Source – U.S. Energy Information Administration (EIA), Annual Energy Outlook 2021 narrative, February 2021. RESPONSIBLE. SAFE. INNOVATIVE. l 13SILVER – WIDENING GAP BETWEEN SUPPLY & DEMAND
Gap expected to increase with continued trend of industrial demand growth of 2.0%
• 2019 saw a total supply of 1,023 Moz and total demand of 1,074 Moz
• Silver’s total demand in 2030 is expected to reach ~1,147 Moz if demand stays on the last
decade trend and no increase in silver’s investment demand
• Supply needs to grow by ~70 Moz per year to meet the on trend additional demand
expected in 2030
Silver Supply & Demand: 2019 and 2030E 1,147
Million Ounces
Supply shortfall of 50 Moz in
2019 was filled by above 1,074
ground stocks
1,023
Total Supply Total Demand Demand Expected, Based on 10 Year Growth
2019 2019 Rate
2030F*
* Demand assumptions: CAGR for industrial demand over the past 10 years has been 2.0%. Assume no increase or decrease in investment, jewelry or silverware demand.
NYSE: HL RESPONSIBLE. SAFE. INNOVATIVE. l 14WHY INVEST IN HECLA?
Hecla is unique silver miner
We mine:
The Right metals
Silver is the right metal for a renewable energy future
Produce 40% of silver mined in the US
In the Right jurisdictions
Mines located in the right geographical addresses
with low risk
For investment attractiveness, Hecla operates in 3 of
the top 10 regions globally: Alaska 5, Quebec 6,
Idaho 9*
With the Right mines
Long-lived mines with decades ahead of us
Mines have the highest reserve grades, long mine
lives and are low cost
* Source: Fraser Institute Survey 2020
NYSE: HL RESPONSIBLE. SAFE. INNOVATIVE. l 15Appendix NYSE: HL RESPONSIBLE. SAFE. INNOVATIVE. l 16
ENDNOTES
 1. Adjusted EBITDA is a non-GAAP measurement, a reconciliation of which to net income, the most comparable GAAP measure, can be found in the Appendix. Adjusted EBITDA is a
    measure used by management to evaluate the Company's operating performance but should not be considered an alternative to net income, or cash provided by operating activities as
    those terms are defined by GAAP and does not necessarily indicate whether cash flows will be sufficient to fund cash needs. In addition, the Company may use it when formulating
    performance goals and targets under its incentive program.
 2. Realized price margin is a non-GAAP measure and is calculated as realized market price of silver less AISC.
 3. Cash cost, after by-product credits, per silver and gold ounce represents a non-GAAP measurement, a reconciliation of which to cost of sales and other direct production costs and
    depreciation, depletion and amortization (sometimes referred to as "cost of sales" in this release), can be found in the Appendix. It is an important operating statistic that management
    utilizes to measure each mine's operating performance. It also allows the benchmarking of performance of each mine versus those of our competitors. As a primary U.S. silver mining
    company, management also uses the statistic on an aggregate basis - aggregating the Greens Creek, Lucky Friday and San Sebastian mines - to compare performance with that of
    other primary silver mining companies. With regard to Casa Berardi and Nevada Operations, management uses cash cost, after by- product credits, per gold ounce to compare its
    performance with other gold mines. Similarly, the statistic is useful in identifying acquisition and investment opportunities as it provides a common tool for measuring the financial
    performance of other mines with varying geologic, metallurgical and operating characteristics. In addition, the Company may use it when formulating performance goals and targets
    under its incentive program.
 4. All-in sustaining cost (AISC), after by-product credits, is a non-GAAP measurement, a reconciliation of which to cost of sales and other direct production costs and depreciation,
    depletion and amortization, the closest GAAP measurement, can be found in the appendix. AISC, after by-product credits, includes cost of sales and other direct production costs,
    expenses for reclamation and exploration, and sustaining capital costs at the mine sites. AISC, after by-product credits, for our consolidated silver properties also includes corporate
    costs for all general and administrative expenses, exploration and sustaining capital which support the operating properties. AISC, after by-product credits, is calculated net of
    depreciation, depletion, and amortization and by-product credits. Current GAAP measures used in the mining industry, such as cost of goods sold, do not capture all the expenditures
    incurred to discover, develop and sustain silver and gold production. Management believes that all in sustaining costs is a non-GAAP measure that provides additional information to
    management, investors and analysts to help in the understanding of the economics of our operations and performance compared to other producers and in the investor's visibility by
    better defining the total costs associated with production. Similarly, the statistic is useful in identifying acquisition and investment opportunities as it provides a common tool for
    measuring the financial performance of other mines with varying geologic, metallurgical and operating characteristics. In addition, the Company may use it when formulating
    performance goals and targets under its incentive program.
 5. Free cash flow is a non-GAAP measure and is calculated as as cash flow from operations less additions to property, plant and equipment. Reconciliation to GAAP is shown in the
    appendix.
 6. Net debt to adjusted EBITDA is a non-GAAP measurement, a reconciliation of adjusted EBITDA and net debt to the closest GAAP measurements of net income (loss) and debt can be
    found in the appendix. It is an important measure for management to measure relative indebtedness and the ability to service the debt relative to its peers. It is calculated as total debt
    outstanding less total cash on hand divided by adjusted EBITDA.
 7. Cost of sales and other direct production costs and depreciation, depletion and amortization.
 8. Silver and gold equivalent (include zinc and lead production) is calculated using the average market prices for the time period noted.
 9. 2021E refers to Hecla’s estimates for 2021. Expectations for 2021 include silver, gold, lead and zinc production from Greens Creek, Lucky Friday, San Sebastian, Casa Berardi and
    Nevada Operations converted using $1,525 gold, $17 silver, $0.85 lead, and $1.00 zinc; these haven’t changed from the first quarter.

NYSE: HL                                                                                                                                                        RESPONSIBLE. SAFE. INNOVATIVE. l 17
FREE CASH FLOW (NON-GAAP) RECONCILIATON
Reconciliation of Cash provided by operating activities (GAAP) to Free Cash Flow (non-GAAP)
Three Months Ended
Q2 2021 Q1 2021 Q4 2020 Q3 2020 Q2 2020
Cash Flow from Operations $ 86,304 $ 37,936 $ 64,901 $ 73,439 $ 37,526
Less: Additions to properties, plants, equipment and mineral
interests (31,898) (21,413) (36,634) (23,693) (10,819)
Free Cash Flow $ 54,406 $ 16,523 $ 28,267 $ 49,746 $ 26,707
NYSE: HL RESPONSIBLE. SAFE. INNOVATIVE. l 18FREE CASH FLOW (NON-GAAP) RECONCILIATON
Reconciliation of Cash provided by operating activities (GAAP) to Free Cash Flow (non-GAAP)
Three Months Ended
Dollars are in thousands Q2 2021 Q1 2021 Q4 2020 Q3 2020 Q2 2020
Greens Creek
Cash provided (used) by operating activities 68,521 44,345 58,288 67,147 37,789
Add: Exploration 1,300 123 (20) 370 -
Less: Additions to properties, plants
equipment and mineral reserves (6,339) (4,892) (10,521) (8,265) (4,501)
Add: non-cash PP&E activity - 3,120 3,366 2,648 3,099
Free Cash Flow 63,482 42,696 51,113 61,900 36,387
Lucky Friday
Cash provided (used) by operating activities 19,681 10,943 7,217 1,112 (7,575)
Add: Exploration - - - - -
Less: Additions to properties, plants
equipment and mineral reserves (5,731) (5,912) (8,199) (5,546) (4,786)
Add: non-cash PP&E activity - - 1,535 - -
Free Cash Flow 13,950 5,031 553 (4,434) (12,361)
Casa Berardi
Cash provided (used) by operating activities 15,756 30,948 24,772 25,016 27,202
Add: Exploration 1,739 1,281 924 563 561
Less: Additions to properties, plants
equipment and mineral reserves (14,745) (13,641) (23,150) (11,629) (4,278)
Add: non-cash PP&E activity - - 6,723 - -
Free Cash Flow 2,750 18,588 9,269 13,950 23,485
NYSE: HL RESPONSIBLE. SAFE. INNOVATIVE. l 19ADJUSTED EBITDA RECONCILIATION TO GAAP
Reconciliation of Net Income (Loss) (GAAP) and Debt (GAAP) to Adjusted EBITDA (non-GAAP)
Dollars in thousands (USD) Twelve Months Ended
Q2 2020 Q3 2020 Q4 2020 Q1 2021 Q2 2021
Net (loss) income $ (58,705) $ (25,561) $ (16,790) $ 19,366 $ 34,179
Plus: Interest expense 54,587 53,589 49,569 44,002 42,444
Plus/(Less): Income taxes (6,142) (2,895) 135 5,831 363
Plus/(Less): Depreciation, depletion and amortization 190,343 179,807 157,130 166,795 175,775
Plus/(Less): Foreign exchange loss (gain) (2,709) 260 4,605 13,305 12,007
Plus: Ramp-up and suspension costs 29,575 27,394 24,911 16,233 12,447
Plus: Losses on dispostion of properties, plants, equipment and mineral interests 574 236 572 685 151
Plus: Acquisition costs 246 65 20 20 9
Plus: Stock-based compensation 4,544 6,139 6,458 5,739 7,332
Plus/(Less): Losses (gains) on derivative contracts 19,203 4,272 5,578 5,053 (3,494)
Plus/(Less): Provisional price (gain) loss (10,894) (5,943) (8,008) (5,950) (2,040)
Plus: Provision for closed operations and environmental matters 6,798 6,254 6,189 9,170 9,279
Plus/(Less): Unrealized (gain) loss on investments (4,075) (8,180) (10,268) (7,740) (581)
Gain on exchange of investments - - - - (1,158)
Write-down to stockpile inventory - - - - 6,431
Foundation grant 1,970 1,970 1,970 - -
Other 1,367 2,608 2,256 2,806 1,367
Adjusted EBITDA $ 227,686 $ 204,315 $ 224,327 $ 275,315 $ 294,511
Total debt $ 531,054 $ 509,909 $ 523,007 $ 525,002 $ 523,739
Less: Cash, cash equivalents (75,923) (98,669) 129,830 (139,750) (181,494)
Net debt $ 455,131 $ 411,240 $ 393,177 $ 385,252 $ 342,245
Net debt/LTM adjusted EBITDA (non-GAAP) 2.0x 2.0x 1.8x 1.4x 1.2x
NYSE: HL RESPONSIBLE. SAFE. INNOVATIVE. l 20CASH COST AND AISC RECONCILIATION TO GAAP
Silver
Reconciliation of Cost of Sales and Other Direct Production Costs and Depreciation, Depletion and Amortization (GAAP) to Cash Cost, Before By-product
Credits and Cash Cost, After By-product Credits (non-GAAP) and All-In Sustaining Costs, Before By-product Credits, per Ounce and All-In Sustaining Costs,
After By-product Credits, per Ounce (non-GAAP)
In thousands (except per ounce amounts)
Q2 2020 Q3 2020 Q4 2020 Q1 2021 Q2 2021
Cost of sales and other direct production costs and depreciation,
depletion and amortization (GAAP) $ 73,137 $ 78,517 $ 85,967 $ 76,069 $ 83,390
Depreciation, depletion and amortization (15,777) (15,472) (19,230) (21,157) (21,894)
Treatment costs 23,095 26,794 23,250 15,519 13,610
Change in product inventory (4,536) 3,736 (6,398) 308 (2,031)
Reclamation and other costs (203) (1,283) (1,552) (588) (998)
Exclusion of Lucky Friday costs (12,475) (22,593) - - -
Cash Cost, Before By-product Credits (1) 63,241 69,699 82,007 70,151 72,077
Reclamation and other costs 903 902 1,087 1,112 1,111
Exploration 314 799 406 558 1,750
Sustaining capital 4,500 8,547 17,675 10,346 11,583
General and administrative 6,979 10,345 7,496 8,007 11,104
AISC, Before By-product Credits (1,2) 75,937 90,292 108,671 90,174 97,625
Total By-product credits (48,760) (56,833) (57,330) (65,311) (71,445)
Cash Cost, After By-product Credits, per Silver Ounce $ 14,481 $ 12,866 $ 24,677 $ 4,840 $ 632
AISC, After By-product Credits $ 27,177 $ 33,459 $ 51,341 $ 24,863 $ 26,180
Divided by ounces produced 2,912 2,901 3,344 3,440 3,471
Cash Cost, Before By-product Credits, per Silver Ounce $ 21.71 $ 24.02 $ 24.52 $ 20.34 $ 20.76
By-product credits per Silver Ounce (16.74) (19.59) (17.14) (18.94) (20.58)
Cash Cost, After By-product Credits, per Silver Ounce $ 4.97 $ 4.43 $ 7.38 $ 1.40 $ 0.18
AISC, Before By-product Credits, per Silver Ounce $ 26.07 $ 31.12 $ 32.49 $ 26.15 $ 28.12
By-products credit per Silver Ounce (16.74) (19.59) (17.14) (18.94) (20.58)
AISC, After By-product Credits, per Silver Ounce $ 9.33 $ 11.53 $ 15.35 $ 7.21 $ 7.54
Realized Silver Price $ 18.44 $ 25.32 $ 25.16 $ 25.66 $ 27.14
Silver Margin (Realized Silver Price - AISC) $ 9.11 $ 13.79 $ 9.81 $ 18.45 $ 19.60
(1) Includes all direct and indirect operating costs related to the physical activities of producing metals, including mining, processing and other plant costs, third-party refining and marketing
expense, on-site general and administrative costs, royalties and mining production taxes, before by-product revenues earned from all metals other than the primary metal produced at
each unit. AISC, Before By-product Credits also includes on-site exploration, reclamation, and sustaining capital costs.
NYSE: HL RESPONSIBLE. SAFE. INNOVATIVE. l 21CASH COST AND AISC RECONCILIATION TO GAAP
Total Silver and Gold
Reconciliation of Cost of Sales and Other Direct Production Costs and Depreciation, Depletion and Amortization (GAAP) to Cash Cost, Before By-product
Credits and Cash Cost, After By-product Credits (non-GAAP) and All-In Sustaining Costs, Before By-product Credits, per Ounce and All-In Sustaining Costs,
After By-product Credits, per Ounce (non-GAAP)
In thousands (except per ounce amounts) Three months ended June 30, 2021
Total Silver Total Gold Total
Cost of sales and other direct production costs and depreciation, depletion and amortization $ 83,391 $ 75,333 $ 158,724
Depreciation, depletion and amortization (21,895) (26,509) (48,404)
Treatment costs 13,610 2,254 15,864
Change in product inventory (2,031) 13,598 11,567
Reclamation and other costs (998) (5,347) (6,345)
Cash Cost, Before By-product Credits (1) 72,077 59,329 131,406
Reclamation and other costs 1,111 433 1,544
Sustaining exploration 1,750 1,103 2,853
Sustaining capital 11,583 6,108 17,691
General and administrative 11,104 — 11,104
AISC, Before By-product Credits (1) 97,625 66,973 164,598
By-product credits:
Zinc (31,603) — (31,603)
Gold (20,438) — (20,438)
Lead (19,404) — (19,404)
Silver — (1,312) (1,312)
Total By-product credits (71,445) (1,312) (72,757)
Cash Cost, After By-product Credits $ 632 $ 58,017 $ 58,649
AISC, After By-product Credits $ 26,180 $ 65,661 $ 91,841
Divided by ounces produced 3,471 46
Cash Cost, Before By-product Credits, per Ounce $ 20.76 $ 1,282
By-product credits per ounce (20.58) (28)
Cash Cost, After By-product Credits, per Ounce $ 0.18 $ 1,254
AISC, Before By-product Credits, per Ounce $ 28.12 $ 1,447
By-product credits per ounce (20.58) (28)
AISC, After By-product Credits, per Ounce $ 7.54 $ 1,419
(1) Includes all direct and indirect operating costs related to the physical activities of producing metals, including mining, processing and other plant costs, third-party refining and marketing
expense, on-site general and administrative costs, royalties and mining production taxes, before by-product revenues earned from all metals other than the primary metal produced at
each unit. AISC, Before By-product Credits also includes on-site exploration, reclamation, and sustaining capital costs.
NYSE: HL RESPONSIBLE. SAFE. INNOVATIVE. l 22CASH COST AND AISC RECONCILIATION TO GAAP
Greens Creek
Reconciliation of Cost of Sales and Other Direct Production Costs and Depreciation, Depletion and Amortization (GAAP) to
Cash Cost, Before By-product Credits and Cash Cost, After By-product Credits (non-GAAP) and All-In Sustaining Costs,
Before By-product Credits, per Ounce and All-In Sustaining Costs, After By-product Credits, per Ounce (non-GAAP)
In thousands (except per ounce amounts)
Q2 2020 Q3 2020 Q4/2020 Q1/2021 Q2/2021 2021E
Cost of sales and other direct production costs and depreciation, depletion and
$ 57,672 $ 51,057 $ 59,215 $ 53,181 $ 55,488 $ 222,000
amortization (GAAP)
Depreciation, depletion and amortization (12,988) (11,735) (12,540) (14,821) (14,492) (59,200)
Treatment costs 20,016 22,675 18,605 10,541 8,924 37,500
Change in product inventory (4,020) 2,899 (4,893) 401 (436) (3,700)
Reclamation and other costs 93 (891) (1,130) (261) (672) 1,500
(1)
Cash Cost, Before By-product Credits 60,733 64,005 59,257 49,041 48,813 198,100
Reclamation and other costs 789 788 789 848 847 3,400
Exploration - 370 (20) 123 1,300 4,300
Sustaining capital 4,501 8,265 10,521 4,892 6,339 35,000
(1) 66,063 73,428 70,547 54,904 57,299 240,800
AISC, Before By-product Credits
Total By-product credits (46,473) (53,147) (42,452) (50,783) (55,553) 204,100
Cash Cost, After By-product Credits $ 14,300 $ 10,858 $ 16,805 $ (1,742) $ (6,740) $ 6,000
AISC, After By-product Credits $ 19,590 $ 20,281 $ 28,095 $ 4,121 $ 1,746 $ 36,700
Divided by ounces produced 2,754 2,634 2,331 2,585 2,558 9,850
Cash Cost, Before By-product Credits, per Silver Ounce $ 22.06 $ 24.30 $ 25.43 $ 18.98 $ 19.08 $ 20.11
By-products credits per Silver Ounce (16.87) (20.18) (18.22) (19.65) (21.72) 20.72
Cash Cost, After By-product Credits, per Silver Ounce $ 5.19 $ 4.12 $ 7.21 $ (0.67) $ (2.64) $ (0.61)
AISC, Before By-product Credits, per Silver Ounce $ 23.98 $ 27.88 $ 30.27 $ 21.24 $ 22.40 $ 24.45
By-product credits per Silver Ounce (16.87) (20.18) (18.22) (19.65) (21.72) 20.72
AISC, After By-product Credits, per Silver Ounce $ 7.11 $ 7.70 $ 12.05 $ 1.59 $ 0.68 $ 3.73
Realized Silver Price $ 18.44 $ 25.32 $ 25.16 $ 25.66 $ 27.14
Silver Margin (Realized Silver Price - AISC) $ 11.33 $ 17.62 $ 13.11 $ 24.07 $ 26.46
1. Includes all direct and indirect operating costs related to the physical activities of producing metals, including mining, processing and other plant costs, third-party refining and marketing expense, non-discretionary on-site general and administrative costs, royalties and mining production taxes,
before by-product revenues earned from all metals other than the primary metal produced at each unit. AISC, Before By-product Credits also includes on-site exploration, reclamation, and sustaining capital costs.
NYSE: HL RESPONSIBLE. SAFE. INNOVATIVE. l 23SILVER
SYMPOSIUM
United States’ Leading
Silver Producer
September 2021
RESPONSIBLE. SAFE. INNOVATIVE.
NYSE: HLYou can also read