Cost effectiveness of percutaneous coronary intervention versus medical therapy in patients with acute myocardial infarction: real world and ...
←
→
Page content transcription
If your browser does not render page correctly, please read the page content below
www.nature.com/scientificreports
OPEN Cost‑effectiveness of percutaneous
coronary intervention
versus medical therapy in patients
with acute myocardial infarction:
real‑world and lifetime‑horizon
data from Taiwan
Chia‑Te Liao1,2,3, Tung‑Han Hsieh4, Chia‑Yin Shih2, Ping‑Yen Liu4 & Jung‑Der Wang2,5*
Although some studies have assessed the cost-effectiveness of percutaneous coronary intervention
(PCI) in acute myocardial infarction (AMI), there has been a lack of nationwide real-world studies
estimating life expectancy (LE), loss-of-LE, life-years saved, and lifetime medical costs. We evaluated
the cost-effectiveness of PCI versus non-PCI therapy by integrating a survival function and mean-
cost function over a lifelong horizon to obtain the estimations for AMI patients without major
comorbidities. We constructed a longitudinal AMI cohort based on the claim database of Taiwan’s
National Health Insurance during 1999–2015. Taiwan’s National Mortality Registry Database was
linked to derive a survival function to estimate LE, loss-of-LE, life-years saved, and lifetime medical
costs in both therapies. This study enrolled a total of 38,441 AMI patients; AMI patients receiving PCI
showed a fewer loss-of-LE (3.6 versus 5.2 years), and more lifetime medical costs (US$ 49,112 versus
US$ 43,532). The incremental cost-effectiveness ratio (ICER) was US$ 3488 per life-year saved. After
stratification by age, the AMI patients aged 50–59 years receiving PCI was shown to be cost-saving.
From the perspective of Taiwan’s National Health Insurance, PCI is cost-effective in AMI patients
without major comorbidities. Notably, for patients aged 50–59 years, PCI is cost-saving.
Acute myocardial infarction (AMI), including ST-segment elevation myocardial infarction (STEMI) and non-ST-
segment elevation myocardial infarction (NSTEMI), is one of the major leading causes of mortality in developed
countries1. Reperfusion therapy, consisting of percutaneous coronary intervention (PCI) and non-PCI therapy,
has been widely used for AMI. Patients with STEMI, nowadays, are suggested to receive reperfusion therapy as
soon as possible, either thrombolytic therapy or primary PCI which is defined as coronary intervention per-
formed in the occluded artery without any previous thrombolysis2–5. Among these therapies, a meta-analysis
including 23 randomized trials further showed that patients with STEMI receive more clinical benefits from
primary PCI than thrombolytic therapy alone in terms of overall mortality, cardiovascular death, repeated myo-
cardial infarction, and s troke6. Although PCI is not recommended for all NSTEMI patients, these patients seem
to show better outcomes after early PCI, if they belong to high-risk groups with more unstable c onditions7–10.
With the development of advanced PCI and guideline-directed medicine, several studies have shown that
the incidence and mortality of AMI in Western countries is decreasing11–13. However, in Taiwan, the incidence
of AMI continues to increase from 49.8 per 100,000 persons in 2009 to 50.7 per 100,000 persons in 2015, and
the in-hospital mortality of NSTEMI has not mitigated significantly14. Among the findings, especially younger
1
Division of Cardiology, Department of Internal Medicine, Chi-Mei Medical Center, Tainan, Taiwan. 2Department
of Public Health, College of Medicine, National Cheng Kung University, No. 1, University Road, Tainan 701,
Taiwan. 3Department of Electrical Engineer, Southern Taiwan University of Science and Technology, Tainan,
Taiwan. 4Division of Cardiology, Department of Internal Medicine, National Cheng Kung University Hospital,
Tainan, Taiwan. 5Department of Internal Medicine and Occupational and Environmental Medicine, National Cheng
Kung University Hospital Tainan, No. 1, University Road, Tainan 701, Taiwan. *email: jdwang121@gmail.com
Scientific Reports | (2021) 11:5608 | https://doi.org/10.1038/s41598-021-84853-y 1
Vol.:(0123456789)www.nature.com/scientificreports/
populations (aged < 55 years), seemed to show a significantly increased proportion of NSTEMI, i.e., 30.3% for
males and 29.4% for females14.
In general, most previous studies merely estimated annual medical costs, instead of a comprehensive projec-
tion of lifetime medical e xpenditure15–17. With an increasing burden of AMI, rising medical costs, and limited
healthcare resources, there is a need to assess the impacts and cost-effectiveness of PCI versus non-PCI therapy
on life expectancy (LE), loss-of-LE, life-years saved and lifetime medical costs, to improve the sustainability of
the universal coverage system. Therefore, this study aimed to use a population-based cohort followed for 18 years
to evaluate the impact of PCI versus non-PCI therapy on cost-effectiveness among patients with AMI.
Methods
Data and sample. Taiwan has a single-payer and universal-coverage national healthcare system18. The
National Health Insurance (NHI) was launched in 1995, and it covers over 99% of the 23 million residents. This
system also deals with the financing of healthcare and reimbursement of all medical claims19. This study was
commenced after approval by the Institutional Review Committee of National Cheng Kung University Hospital
(NCKUH, B-ER-105-386), involving the interlinkage of databases of the NHI and National Mortality Registry
from 1999 to 2016.
To establish the AMI cohort, we identified subjects from the NHI research database by the following criteria:
first, we defined AMI patients as those admitted to hospital due to AMI [International Classification of Diseases,
Ninth Revision, Clinical Modification (ICD-9-CM) 410.xx] in any year during 1998–2015; and aged between 20
and 99 years (n = 200,491). Second, to clarify first-time in-patient AMI, we excluded those who had a diagnosis
of AMI in 1998, those who had the ICD-9 code of 412 in the same admission, and those who had missing data
on age, gender, or prior outpatient or emergency department records before their admission (n = 53,859). Third,
to control for potential confounding, we also excluded patients who had major comorbidities before AMI hospi-
talization, including ischemic stroke (ICD-9-CM code: 433, 434, 435, 437, 438), hemorrhagic stroke (ICD-9-CM
code: 430, 431, 432), chronic kidney diseases (CKD, ICD-9-CM code: 016.0, 095.4, 189.0, 189.9, 223.0, 236.91,
250.4, 271.4, 274.1, 283.11, 403.X1, 404.X2, 404.X3, 440.1, 442.1, 447.3, 572.4, 580-588, 591, 642.1, 646.2, 753.12-
753.17, 753.19, 753.2, 794.4), liver cirrhosis (ICD-9-CM code: 571.2, 571.5, 571.6), chronic obstructive pulmo-
nary diseases (COPD, 491, 492, 493.2, 496), and any documented malignancy (ICD-9-CM code: 140-208)20.
To classify whether an AMI patient received PCI or not, we identified the intervention. The therapeutic pro-
cedures were defined according to the procedure codes in the NHI database: diagnostic coronary angiography
(CAG; ICD-9-CM code: 88.55, 88.56, 88.57), percutaneous transluminal coronary angioplasty (PTCA; ICD-
9-CM code: 36.01, 36.02, 36.05, 36.09), coronary artery stenting (ICD-9-CM code: 36.06, 36.07), and coronary
artery bypass graft (CABG; ICD-9-CM code: 36.10, 36.11, 36.12, 36.13, 36.14, 36.15, 36.16). Patients receiving
PCI therapy were defined as those who received PTCA or PTCA plus coronary artery stenting during hospitaliza-
tion. For those with non-PCI therapy, we excluded the patients with myocardial infarction with non-obstructive
coronary artery (MINOCA) to reduce the heterogeneity between PCI and non-PCI group. MINOCA included
coronary spasm (ICD-9-CM code: 413.1), coronary bridge (ICD-9-CM code: 414.8), myocarditis/pericarditis/
endocarditis (ICD-9-CM code: 420, 421, 422, 423, 424, 429), cardiomyopathy (ICD-9-CM code: 425), sepsis/
shock/non-cardiogenic shock (ICD-9-CM code: 995), and trauma (ICD-9-CM code: 959). We also excluded
those who did not take dual anti-platelet agents within 3 months after the AMI diagnosis. Thus, the total number
of identified subjects with AMI enrolled in this current study was 38,441.
Statistical analysis. Estimation of life expectancy, loss of life expectancy, and life‑year saved. By interlink-
ing the Taiwan National Mortality Registry and the reimbursement database of NHI, we obtained 38,441 sub-
jects with a new-AMI admission from 1999 to 2015. Among them, 26,193 patients received PCI, while 12,248
received non-PCI therapy.
We applied the Kaplan–Meier method to estimate the survival function in the follow-up period of 18 years
(namely, 1999–2016) and extrapolated to lifetime by a semiparametric m ethod21. Then, we applied Monte–Carlo
methods to obtain the lifetime survival function from age-, gender- and calendar year-matched referents simu-
lated from the National Vital Statistics database. With premature mortality caused by AMI, the relative survival
between the index cohort and the reference population ranged between 0 and 1. Next, we performed logit trans-
formations of the relative survivals obtained from the above methods, and the curve often decreased quickly
right after the occurrence of disease and gradually approached a straight line if the assumption of a constant
excess hazard was satisfied22. Then, with the linearity property of the logit transformed curve, a restricted cubic
splines model was fitted, which was linear beyond the last knot, to the observed curve. We used the fitted model
to extrapolate the first month beyond follow-up, which was generally accurate and was treated as a new “observed
value”. Month-by-month, we repeatedly updated the data of the logit transformed function by dropping the first
value and adding the new “observed value”, and re-fitted the restricted cubic splines model to obtain updated
data for predicting values in the following months. When the rolling extrapolation of the logit transformed
function was completed, the survival function of the index cohort beyond the maximum follow-up period was
then obtained from the back-transformed relative survival function and survival function of the referents (Sup-
plementary Figure S1).
Thereby, we estimated the lifetime survival, and the area under the survival curve which was the LE of the
patients with AMI. We subtracted the LE of the AMI patients from the corresponding age-, gender- and calendar
year-matched reference population to obtain the loss-of-LE. Also, we generated the standard errors (SE) of life-
years saved and loss-of-LE with a bootstrap method, which used 100 times of repeated sampling from real-world
datasets to implement the extrapolation process.
Scientific Reports | (2021) 11:5608 | https://doi.org/10.1038/s41598-021-84853-y 2
Vol:.(1234567890)www.nature.com/scientificreports/
Estimation of lifetime medical costs. The lifetime medical costs for patients with AMI in this study was defined
as direct medical costs since the date of AMI diagnosis to the date of death, but did not include direct non-
medical costs, indirect costs, nor long-term care costs. The direct medical costs recorded in the NHI database
included inpatient hospitalization, emergent department visits, outpatient clinic visits, medicine prescriptions,
surgeries, and invasive therapies. To further analyze the direct medical costs, we divided the lifetime medical
costs into the costs for the first AMI hospitalization, and outpatient and inpatient lifetime medical costs after
the first AMI.
Based on the global budget policy launched by Taiwan’s NHI, we obtained cost estimations from the NHI
database by using quarterly point value tables. Taking into account the increased medical spending near the
end-of-life, we applied the rolling extrapolation survival-adjusted cost estimator to obtain more accurate medical
costs over lifetime. Besides, a previous study demonstrated that a weighted average of the mean costs of deceased
patients and the expected costs of surviving patients in a time interval can represent the mean aggregated medi-
cal costs23. Hence, we drew a time series plot of the mean spending of patients in the 24 months prior to their
death and the mean monthly costs for patients who stayed alive in the 36 months prior to the end of follow-up.
The reason is that healthcare spending for AMI was typically found to increase substantially in the 24 months
before death. After setting these parameters, lifetime medical costs were estimated by two methods, the values
of survival function from the rolling extrapolation algorithm, and the values of the monthly mean cost function
from the survival-adjusted cost estimator21.
With estimates of LE, loss-of-LE, life-years saved, and lifetime medical costs for the AMI patients with PCI
and non-PCI therapy, we calculated the differences in LE, loss-of-LE and lifetime medical costs in both therapies.
Subsequently, we derived the ICERs of PCI versus non-PCI among the patients with AMI. All lifetime medical
costs were discounted at a rate of 3% and 0% to take into account the factor of time according to the recom-
mended guidelines of methodological standards for pharmacoeconomic evaluations24. Moreover, we noted that
the medical costs are significantly higher than the average costs several months before death, and the values of
month varied according to the different age stratification. Therefore, we performed a further sensitivity analysis
with different K values for the uncertain period before death in the different age stratification (Supplementary
Tables S4, S5). The current study converted all costs to US dollars (Exchange rate 1 US dollar = 31.92 New Taiwan
dollars in 2015).
To estimate the number of life-years saved by intervention and ICER, we would usually apply the following
formula for data collected from randomized trials:
ICER = Lifetime medical costs(PCI) − Lifetime medical costs(non−PCI) / LE(PCI) − LE(non−PCI)
However, in the real world, the two compared cohorts might come from different age and sex distributions.
People who are older, female, and/or co-morbid with other major diseases would be less likely to receive PCI,
which is also a health disparity. Hence, we adjusted for different distributions of sex, age, and calendar-year of
diagnosis to obtain a more accurate estimation of life-years saved by intervention. Namely, we decided to use
the difference in loss-of-LE instead of LE, modified as follows:
Formula : Lifetime medical costs(PCI) − Lifetime medical costs(non−PCI)
/ Loss − of − LE(non−PCI) − Loss − of − LE(PCI)
In addition, we used this longitudinal cohort data to determine the incidence of adverse cardiovascular
events, including repeated myocardial infarction, stroke, and heart failure, within different follow-up periods,
i.e., 6 months, 1 year, 3 years and lifetime or to the end of the 18th year.
We performed descriptive analyses where the continuous variables are presented as means and standard devia-
tions, and dichotomized variables are presented as percentages. The differences between each group was tested
by t test for continuous variables and chi-square test for categorical variables. Descriptive statistical analyses
and survival analyses were performed using the SAS software V9.4 (SAS Institute Inc.). Besides, we conducted
the analyses for the rolling extrapolation to estimate LE, loss-of-LE, and lifetime medical costs by using the
iSQoL2 software.
Results
Figure 1 presents the flow diagram of the enrollment process of AMI patients in the Taiwan NHI database, and
the estimations of lifetime survival function, LE, loss-of-LE, life-years saved, and lifetime medical costs. The total
number of patients with AMI during 1999 and 2015 was 38,441 subjects without comorbidities, including 26,193
in PCI group and 12,248 in non-PCI one. In Table 1, the group without comorbidities, about two-thirds received
PCI, while in the group with comorbidities, slightly less than half received PCI. Male patients made up a higher
percentage in the PCI group than the non-PCI group regardless of comorbidities. The proportion of STEMI in
PCI group is smaller than that in non-PCI group (16.4% versus 23.4%), while NSTEMI in PCI group is higher
than non-PCI group (83.6% versus 76.6%). In the group without major comorbidities, the mean age of those
receiving PCI was 4.0 years younger than those receiving non-PCI therapy, while those with comorbidities were
about 8–10 years older than those without comorbidities. The direct medical cost for the first hospitalization
in PCI group (US$ 5486) was higher than non-PCI group (US$ 4728). Likewise, the follow-up outpatient and
inpatient lifetime medical costs in PCI group was more than those in non-PCI, i.e., US$ 23,975 versus US$18,860
and US$36,286 versus US$29,823 (details in Supplementary Table S1).
Table 1 also shows a consistent trend in AMI patients without comorbidities receiving PCI who developed
lower incidence rates of adverse cardiovascular events, i.e., AMI, heart failure, and stroke, within different follow-
up periods. Additionally, those receiving PCI in the group with major comorbidities developed lower incidences
Scientific Reports | (2021) 11:5608 | https://doi.org/10.1038/s41598-021-84853-y 3
Vol.:(0123456789)www.nature.com/scientificreports/
Figure 1. Flow diagram of cohort selection and estimation for lifetime medical costs. AMI acute myocardial
infarction, ICD-9-CM International Classification of Diseases, Ninth Revision, Clinical Modification, PCI
percutaneous coronary intervention, LE life expectancy, Loss-of-LE loss of life expectancy.
of acute MI and heart failure compared to those receiving non-PCI therapy regardless of the length of follow-up
periods, but the occurrences of stroke did not show the same trend. Furthermore, the total AMI population
with/without comorbidities stratified by age in 10-years age groups are presented in Supplementary Table S2.
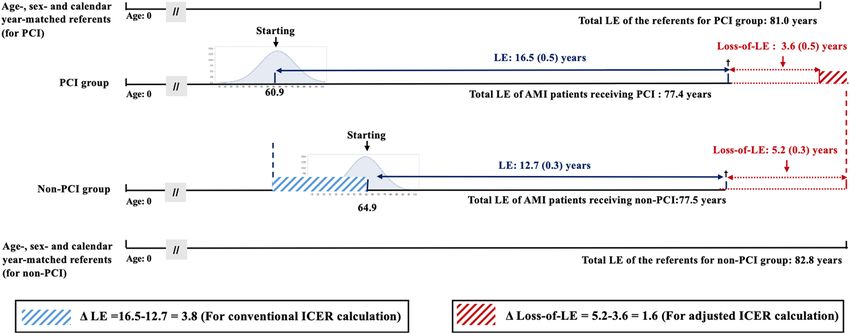
Figure 2 illustrates the LE, loss-of-LE, and life-years saved for AMI patients without major comorbidities. LE
after an AMI episode in the PCI and non-PCI group were 16.5 and 12.7 years, respectively, while those of the age-,
gender- and calendar year-matched population in the PCI and non-PCI group were 81.0 and 82.8 years. Hence,
the loss-of-LE in the PCI and non-PCI groups were 3.6 [= 81.0 − (60.9 + 16.5)] and 5.2 [= 82.8 − (64.9 + 12.7)]
years, respectively, and the difference-in-differences of loss-of-LE of both therapies would be 1.6 years. In other
words, Fig. 2 shows how different distributions of age, sex, and calendar year between the two different cohorts of
PCI and non-PCI could be adjusted by comparing the loss-of-LE instead of LE. As the calendar year of diagnosis
was matched, it accounts for different stages of medical technology in different periods.
Table 2 summarizes the results of LE, loss-of-LE, lifetime medical costs, and ICERs for PCI stratified by age
groups, which were adjusted to the year 2015 with a discount rate of 3%. The overall ICER of PCI versus non-
PCI therapy calculated by the difference in LE and loss-of-LE were US$1468 and US$3488 per life-year saved,
respectively. As the mean age of the PCI cohort was younger than that of the non-PCI cohort, the conventional
ICER values by LE (US$ 1468 per life-year saved) could have been over-estimated. We calculated the difference-
in-differences by comparing the loss-of-LE, which resulted in an adjusted ICER (US$ 3488 per life-year saved).
Among them, the groups aged 50–59 years were shown to be cost-saving when considered from a lifetime
horizon.
Scientific Reports | (2021) 11:5608 | https://doi.org/10.1038/s41598-021-84853-y 4
Vol:.(1234567890)www.nature.com/scientificreports/
Without major comorbidities With major comorbidities
Receiving PCI Yes No Yes No
Total 26,193 12,248 4369 4573
No. of male (%) 21,675 (82.8%) 9202 (75.1%) 3238 (74.1%) 3109 (68.0%)
Age (mean ± SD) 60.9 ± 13.4 64.9 ± 13.7 70.3 ± 11.9 72.8 ± 12.1
No. of STEMI (%) 4306 (16.4%) 2863 (23.4%) N/A N/A
No. of NSTEMI (%) 21,887 (83.6%) 9385 (76.6%) N/A N/A
No. of deceased (%) 5802 (22.2%) 5397 (44.1%) 2382 (54.5%) 3504 (76.6%)
Direct medical costs for the first hospitalization (US$) 5486 4728 N/A N/A
Follow-up outpatient LMC (US$) 23,975 18,860 N/A N/A
Follow-up inpatient LMC (US$) 36,286 29,823 N/A N/A
ACE (No. events/population)
Within 1 year
Acute myocardial infarction 1317 (5.0%) 1529 (12.5%) 322 (7.4%) 597 (13.1%)
Heart Failure 753 (2.9%) 499 (4.1%) 300 (6.9%) 363 (7.9%)
Stroke 465 (1.8%) 271 (2.2%) 171 (3.9%) 163 (3.6%)
Within 3 years
Acute myocardial infarction 1739 (6.7%) 1751 (14.3%) 403 (9.2%) 688 (15.0%)
Heart Failure 1096 (3.5%) 688 (5.6%) 400 (9.2%) 493 (10.8%)
Stroke 831 (2.6%) 510 (4.2%) 279 (6.4%) 245 (5.4%)
Within 18 years
Acute myocardial infarction 2749 (10.5%) 2247 (18.3%) 517 (11.8%) 783 (17.1%)
Heart Failure 1732 (6.6%) 1117 (9.1%) 510 (11.7%) 602 (13.2%)
Stroke 1652 (6.3%) 983 (8.0%) 404 (9.2%) 323 (7.1%)
Table 1. Demographic characteristics of patients with acute myocardial infarction who later developed
adverse cardiovascular events (ACE) and direct medical costs for the first hospitalization, life-time medical
costs (LMC) for in- and out-patient stratified by major comorbidities and receiving percutaneous coronary
intervention (PCI). Major comorbidities include ischemic stroke, hemorrhagic stroke, chronic kidney diseases,
liver cirrhosis, chronic obstructive pulmonary diseases, and documental malignancy. SD standard deviation,
STEMI ST-segment elevation myocardial infarction, NSTEMI non ST-segment elevation myocardial infarction.
Figure 2. Illustration of the estimation of life expectancy (LE), total LE, loss of life expectancy (Loss-of-LE),
and life-year saved for patients with acute myocardial infarction (AMI) receiving percutaneous coronary
intervention (PCI) and non-PCI, and their corresponding referents matched with same age-, sex-, and calendar
year of diagnosis. It indicates that comparison of loss-of-LE to obtain difference-in-differences as the lifetime
health benefits for PCI would adjust for different distributions of age, sex, and different medical technology
offered in different calendar years between the two cohorts.
Scientific Reports | (2021) 11:5608 | https://doi.org/10.1038/s41598-021-84853-y 5
Vol.:(0123456789)www.nature.com/scientificreports/
PCI Non-PCI PCI versus non-PCI
Conventional ICER (US$/ Adjusted ICER (US$/life-
Age (years) LE Loss-of-LE LMC (US$) LE Loss-of-LE LMC (US$) ∆LE ∆Loss-of-LE life-year saved) year saved)
Discount rate = 3%
30–99 16.5 (0.5) 3.6 (0.5) 49,112 12.7 (0.3) 5.2 (0.3) 43,532 3.8 1.6 1468 3488
30–39 27.1 (2.7) 6.8 (2.7) 55,206 21.0 (3.0) 12.4 (3.0) 40,523 6.1 5.6 2407 2622
40–49 22.8 (1.7) 6.4 (1.7) 54,538 20.6 (1.3) 8.2 (1.3) 51,329 2.2 1.8 1459 1783
50–59 20.5 (1.0) 3.7 (1.0) 56,847 19.0 (0.6) 4.9 (0.6) 60,613 1.5 1.2 -2511 -3138
60–69 15.0 (0.4) 3.3 (0.4) 51,723 12.5 (0.3) 5.6 (0.3) 46,311 2.5 2.3 2165 2353
70–79 10.2 (0.2) 1.9 (0.2) 40,924 7.2 (0.2) 4.7 (0.2) 35,146 3.0 2.8 1926 2064
80–99 5.7 (0.2) 1.2 (0.2) 25,038 3.3 (0.1) 3.2 (0.1) 21,543 2.4 2.0 1456 1748
Table 2. Life expectancy (LE), loss of life expectancy (Loss-of-LE), life-year saved, lifetime medical cost
(LMC, adjusted to year 2015 with a discount rate of 3%) and incremental cost-effectiveness ratio (ICER) of
patients with acute myocardial infarction stratified by receiving percutaneous coronary intervention (PCI). ∆
LE was derived from (LE in PCI–LE in non-PCI). ∆ Loss-of-LE was derived from (Loss-of-LE in non-PCI–
Loss-of-LE in PCI).
Discussions
This study is the first to utilize long-term survival data to quantify LE, loss-of-LE, life-years saved, lifetime medi-
cal costs, and ICER of PCI versus non-PCI therapy in AMI patients without major comorbidities. Although
a previous study projected the cost-effectiveness of PCI through modeling25, the current study provided an
alternative way to corroborate or validate the prediction by using a real-world database. Since this study is not
a randomized clinical trial, our results of the health benefits from PCI cannot be directly considered as causal.
However, we have the following arguments to corroborate the above hypothesis: first, since we excluded all
AMI patients with major comorbidities from the beginning, the health benefits cannot be attributed to poten-
tial confounding by the presence of other diseases, i.e., malignancy, stroke, COPD, CKD, and liver cirrhosis.
Moreover, we also excluded all cases of MINOCA from the non-PCI cohort, which would make the comparison
more valid. Second, the ICER calculated by life-years saved was the difference in loss-of-LE (Fig. 2), which was
adjusted for different distributions of age, sex, and calendar-year of diagnosis. All the above factors, including
the advancement of medical technology in different calendar years, cannot be used to explain the more desirable
results of the PCI cohort. Third, as the validation of our extrapolation algorithm (month-by-month, rolling-over
from the end of the 9th year to the 18th year) is accurate (as shown in Supplementary Figure S1), we anticipate
that the same method using 18 years of real data (with a censored rate of 33%) extrapolated to lifetime would be
reasonably accurate21,22. Fourth, in addition by adjusting medical expenditures to the different CPI (consumer
price index) of each calendar year, we accounted for the annual discount rate and increased spending near the
end of life when extrapolating after follow-up21. Finally, the patients receiving PCI consistently showed a lower
incidence rate of adverse cardiovascular events during the 18 years of follow-up (Table 1), indicating a success-
ful rescue of nearby ischemic myocardium and corroborating the pathophysiologic plausibility of PCI. We thus
tentatively conclude that the health benefits of AMI patients receiving PCI could not be attributed to any other
alternative explanations.
By inter-linking the NHI database and National Mortality Registry plus borrowing data from National
Vital Statistics, this study demonstrated that AMI patients receiving PCI required higher lifetime medical costs
(US$49,112 versus US$43,532 of non-PCI). However, AMI patients receiving PCI simultaneously had a longer
LE (16.5 versus 12.7 years) and smaller loss-of-LE (3.6 versus 5.2 years). The overall ICER of PCI versus non-
PCI in all age groups was a mere US$1468 per life-year saved, which turned out to be US$3488 after adjustment
of different age, sex, and calendar-year of diagnosis. Given that the GDP per capita in Taiwan was around US$
24,000–25,792 during 2013 and 2 01826, it seems that PCI therapy in AMI patients would be cost-effective,
regardless of their age, if we adopt the threshold for cost-effectiveness proposed by the WHO which is one to
three times the GDP per capita27,28. On the other hand, as there was substantial increase in the proportion of
NSTEMI in younger populations (age < 55 years)14, the financial benefit may encourage physicians to perform
PCI in younger patients when considered from the national payer’s perspective.
We found that the AMI patients aged 50–59 years without major comorbidities consumed the highest lifetime
medical costs irrespective of PCI treatment in Taiwan setting. Unlike the other ages, PCI group in this stratum
produced fewer lifetime medical costs than non-PCI group, which contributed to a cost-saving result. This would
be that PCI may have a direct symptom relief and fewer later complications, which may improve motivation of
medical adherence, lifestyle modification and secondary prevention of cardiovascular d iseases29.
In the sensitivity analyses which accounted for the factor of time, PCI in AMI patients remained very cost-
effective, and even cost-saving for those aged 50–59 years, given the discount rate of zero (Supplementary
Table S3). Besides, the different period of months (K value) before death according to patients’ age stratification
was used to estimate the discrepancy of life-time medical costs (Supplementary Tables S4, S5). The result did
not change the economic benefit of PCI versus non-PCI, which may strengthen the robustness of the cost-
effectiveness of PCI therapy for AMI patients. Furthermore, Table 1 shows that younger populations and those
without major comorbidities seem to prefer PCI more, which is compatible with a previous study30. However,
Scientific Reports | (2021) 11:5608 | https://doi.org/10.1038/s41598-021-84853-y 6
Vol:.(1234567890)www.nature.com/scientificreports/
in older groups without major comorbidities, we found that PCI still produces a longer LE, smaller loss-of-LE,
and better cost-effectiveness (US$2064 and US$1748 per life-year saved in those aged 70–79 and 80–99 years,
respectively). These findings may support the performance of PCI in AMI patients throughout all age groups
without major comorbidities.
In the past two decades, there has been growing momentum for a paradigm shift from pay-for-volume to
pay-for-value31,32. Also, the value should be assessed from the perspectives of patients and the society. This issue
is particularly challenging when tackled from the aspect of cost-effectiveness from a lifetime horizon. Although
PCI may save lives, there is still a potential risk of morbidity and even mortality, especially among older people.
Furthermore, for patients, the concern of co-payment and/or out-of-pocket expense resulting from PCI and
relevant novel treatments has almost always existed as new technology evolves, which might lead to health
disparity, even for those living in a country with universal coverage. With nation-wide data and innovative
methods to estimate lifetime survival functions and costs, our study provides a viable solution and evidence on
the cost-effectiveness of PCI for AMI patients, including the elderly (Table 2).
This study has the following limitations. First, only STEMI and high-risk NSTEMI patients are suggested
to receive P CI7–9. The ICER values in high- and low-risk NSTEMI patients may differ. With a lack of actual
laboratory data, like ECG patterns, and magnitudes of the rise in biomarkers of myocardial infarction, we were
unable to assess the risks in NSTEMI patients accurately. Future studies in different settings are warranted to
assess the different risks and comorbidities of AMI patients. Second, Taiwan’s NHI does not comprehensively
cover novel treatments and medications associated with PCI, like drug-eluting stents, which are partially paid by
the patients themselves. Also, the indirect medical costs, e.g., co-payment and out-of-pocket expense, were not
recorded in the reimbursement database. The lifetime medical costs extracted from the NHI database may lead
to an underestimation of PCI treatment. However, since most hospitalization costs, including those of intensive
care units, were covered, the discrepancy would mainly result from the costs of different types of stents. Future
studies are warranted to account for and minimize this potential disparity in cost. Last, using the incremental
cost per life-year saved instead of cost per quality-adjusted life-year gained may impact the financial benefits.
However, Table 1 shows that AMI patients receiving PCI had a lower incidence of adverse cardiovascular events
in the 18-years of follow-up. Namely, those receiving PCI therapy would less likely suffer from later cardiovascular
events and have a better quality of life, which was compatible with previous studies33–35. Therefore, in considera-
tion of quality-adjusted life-years, PCI therapy would still have more economic incentives for AMI patients.
Conclusions
This study is the first to utilize real-world, nation-wide, long-term survival data to extrapolate LE, loss-of-LE,
and lifetime medical costs for AMI patients without major comorbidities. Our analyses demonstrate the cost-
effectiveness of PCI in contrast to non-PCI therapy for AMI patients without major comorbidities, with an ICER
of US$3488 per life-year saved; notably, PCI was shown to be cost-effective across different ages and even cost-
saving in those aged 50–59 years in Taiwan. More comprehensive studies are needed to consider the values from
a societal perspective, which would include productivity loss, social services, quality of life, etc., and stratification
by different risks and/or comorbidities.
Received: 3 October 2020; Accepted: 15 February 2021
References
1. Finegold, J. A., Asaria, P. & Francis, D. P. Mortality from ischaemic heart disease by country, region, and age: Statistics from World
Health Organisation and United Nations. Int. J. Cardiol. 168(2), 934–945 (2013).
2. Bassand, J.-P. et al. Implementation of reperfusion therapy in acute myocardial infarction. A policy statement from the European
Society of Cardiology. Eur. Heart J. 26(24), 2733–2741 (2005).
3. Li, Y.-H. et al. 2012 guidelines of the Taiwan Society of Cardiology (TSOC) for the management of ST-segment elevation myocardial
infarction. Acta Cardiol. Sin. 28(1), 63–89 (2012).
4. Members, A. T. F. et al. ESC Guidelines for the management of acute myocardial infarction in patients presenting with ST-segment
elevation: The Task Force on the management of ST-segment elevation acute myocardial infarction of the European Society of
Cardiology (ESC). Eur. Heart J. 33(20), 2569–2619 (2012).
5. Levine, G. N. et al. 2015 ACC/AHA/SCAI focused update on primary percutaneous coronary intervention for patients with ST-
elevation myocardial infarction: An update of the 2011 ACCF/AHA/SCAI guideline for percutaneous coronary intervention and
the 2013 ACCF/AHA guideline for the management of ST-elevation myocardial infarction. J. Am. Coll. Cardiol. 67(10), 1235–1250
(2016).
6. Keeley, E. C., Boura, J. A. & Grines, C. L. Primary angioplasty versus intravenous thrombolytic therapy for acute myocardial
infarction: A quantitative review of 23 randomised trials. Lancet 361(9351), 13–20 (2003).
7. Li, Y. H. et al. 2018 Guidelines of the Taiwan Society of Cardiology, Taiwan Society of Emergency Medicine and Taiwan Society of
Cardiovascular Interventions for the management of non ST-segment elevation acute coronary syndrome. J. Formos. Med. Assoc.
117(9), 766–790 (2018).
8. Navarese, E. P. et al. optimal timing of coronary invasive strategy in non-st-segment elevation acute coronary syndromes: A
systematic review and meta-analysis. Ann. Intern. Med. 158(4), 261–270 (2013).
9. Mehta, S. R. et al. Early versus delayed invasive intervention in acute coronary syndromes. N. Engl. J. Med. 360(21), 2165–2175
(2009).
10. Gray, H. H. et al. Early management of unstable angina and non-ST-segment elevation myocardial infarction: Summary of NICE
guidance. Heart 96(20), 1662–1668 (2010).
11. Degano, I. R. et al. Twenty-five-year trends in myocardial infarction attack and mortality rates, and case-fatality, in six European
populations. Heart 101(17), 1413–1421 (2015).
Scientific Reports | (2021) 11:5608 | https://doi.org/10.1038/s41598-021-84853-y 7
Vol.:(0123456789)www.nature.com/scientificreports/
12. Yeh, R. W. et al. Population trends in the incidence and outcomes of acute myocardial infarction. N. Engl. J. Med. 362(23),
2155–2165 (2010).
13. Freisinger, E. et al. German nationwide data on current trends and management of acute myocardial infarction: Discrepancies
between trials and real-life. Eur. Heart J. 35(15), 979–988 (2014).
14. Lee, C.-H. et al. Patterns of acute myocardial infarction in Taiwan from 2009 to 2015. J. Am. Coll. Cardiol. 122(12), 1996–2004
(2018).
15. Bagai, A. et al. Clinical outcomes and cost implications of routine early PCI after fibrinolysis: One-year follow-up of the Trial of
Routine Angioplasty and Stenting after Fibrinolysis to Enhance Reperfusion in Acute Myocardial Infarction (TRANSFER-AMI)
study. Am. Heart J. 165(4), 630–637 (2013).
16. McCollam, P. & Etemad, L. Cost of care for new-onset acute coronary syndrome patients who undergo coronary revascularization.
J. Invas. Cardiol. 17(6), 307–311 (2005).
17. Soekhlal, R., Burgers, L., Redekop, W. & Tan, S. S. Treatment costs of acute myocardial infarction in the Netherlands. Neth. Heart
J. 21(5), 230–235 (2013).
18. Wu, T.-Y., Majeed, A. & Kuo, K. N. An overview of the healthcare system in Taiwan. Lond. J. Prim. Care. 3(2), 115–119 (2010).
19. Hsing, A. W. & Ioannidis, J. P. Nationwide population science: Lessons from the Taiwan national health insurance research database.
JAMA Intern. Med. 175(9), 1527–1529 (2015).
20. Hsieh, T.-H., Wang, J.-D. & Tsai, L.-M. Improving in-hospital mortality in elderly patients after acute coronary syndrome—a
nationwide analysis of 97,220 patients in Taiwan during 2004–2008. Int. J. Cardiol. 155(1), 149–154 (2012).
21. Hwang, J. S., Hu, T. H., Lee, L. J. H. & Wang, J. D. Estimating lifetime medical costs from censored claims data. Health Econ. 26(12),
e332–e344 (2017).
22. Fang, C. T. et al. Life expectancy of patients with newly-diagnosed HIV infection in the era of highly active antiretroviral therapy.
QJM 100(2), 97–105 (2007).
23. Basu, A. & Manning, W. G. Estimating lifetime or episode-of-illness costs under censoring. Health Econ. 19(9), 1010–1028 (2010).
24. Taiwan Society for Pharmacoeconomic Outcomes Research. Guidelines of methodological standards for pharmacoeconomic
evaluations. 2006. https://tools.ispor.org/PEguidelines/source/2006_PEG_EN_2009.pdf. Accessed 28 Feb 2020.
25. Selmer, R., Halvorsen, S., Myhre, K. I., Wisløff, T. F. & Kristiansen, I. S. Cost-effectiveness of primary percutaneous coronary
intervention versus thrombolytic therapy for acute myocardial infarction. Scand. Cardiovasc. J. 39(5), 276–285 (2005).
26. Directorate-General of Budget AaS. Executive Yuan. In: ROC (Taiwan); 2019.
27. Bertram, M. Y. et al. Cost–effectiveness thresholds: Pros and cons. Bull. World Health Organ. 94(12), 925 (2016).
28. Marseille, E., Larson, B., Kazi, D. S., Kahn, J. G. & Rosen, S. Thresholds for the cost-effectiveness of interventions: Alternative
approaches. Bull World Health Organ. 93, 118–124 (2014).
29. Kähkönen, O. et al. Motivation is a crucial factor for adherence to a healthy lifestyle among people with coronary heart disease
after percutaneous coronary intervention. J. Adv. Nurs. 71(10), 2364–2373 (2015).
30. Chen, L., Han, L. & Luo, J. Selection of percutaneous coronary intervention in elderly patients with acute myocardial infarction
in tertiary hospital. Medicine 98, 29 (2019).
31. Dzau, V. J. et al. Vital directions for health and health care: Priorities from a National Academy of Medicine initiative. JAMA
317(14), 1461–1470 (2017).
32. Porter, M. E. & Lee, T. H. From volume to value in health care: The work begins. JAMA 316(10), 1047–1048 (2016).
33. Rinfret, S. et al. Quality of life after balloon angioplasty or stenting for acute myocardial infarction: One-year results from the
Stent-PAMI trial. J. Am. Coll. Cardiol. 38(6), 1614–1621 (2001).
34. Mortensen, O. S. et al. Health related quality of life after conservative or invasive treatment of inducible postinfarction ischaemia.
Heart 84(5), 535–540 (2000).
35. Kim, J. et al. Health-related quality of life after interventional or conservative strategy in patients with unstable angina or non-
ST-segment elevation myocardial infarction: One-year results of the third Randomized Intervention Trial of unstable Angina
(RITA-3). J. Am. Coll. Cardiol. 45(2), 221–228 (2005).
Acknowledgements
We are grateful to the Health Data Science Center, National Cheng Kung University Hospital for providing
administrative and technical support. This work was supported in part by the National Health Research Institute,
Taiwan [NHRI-108A1-EMCO-02191910, NHRI-109A1-EMCO-02202210], and the Ministry of Science and
Technology, Taiwan [MOST 108-2627-M-006-001, MOST 107-2627-M-006-007].
Author contributions
C.T.L., T.H.H., and J.D.W. contributed to the conception or design of the work. C.T.L., C.Y.S., and P.Y.L. contrib-
uted to the acquisition, analysis, or interpretation of data for the work. C.T.L. and T.H.S. drafted the manuscript.
J.D.W. critically revised the manuscript. All authors gave final approval and agree to be accountable for all aspects
of work ensuring integrity and accuracy.
Competing interests
The authors declare no competing interests.
Additional information
Supplementary Information The online version contains supplementary material available at https://doi.
org/10.1038/s41598-021-84853-y.
Correspondence and requests for materials should be addressed to J.-D.W.
Reprints and permissions information is available at www.nature.com/reprints.
Publisher’s note Springer Nature remains neutral with regard to jurisdictional claims in published maps and
institutional affiliations.
Scientific Reports | (2021) 11:5608 | https://doi.org/10.1038/s41598-021-84853-y 8
Vol:.(1234567890)www.nature.com/scientificreports/
Open Access This article is licensed under a Creative Commons Attribution 4.0 International
License, which permits use, sharing, adaptation, distribution and reproduction in any medium or
format, as long as you give appropriate credit to the original author(s) and the source, provide a link to the
Creative Commons licence, and indicate if changes were made. The images or other third party material in this
article are included in the article’s Creative Commons licence, unless indicated otherwise in a credit line to the
material. If material is not included in the article’s Creative Commons licence and your intended use is not
permitted by statutory regulation or exceeds the permitted use, you will need to obtain permission directly from
the copyright holder. To view a copy of this licence, visit http://creativecommons.org/licenses/by/4.0/.
© The Author(s) 2021
Scientific Reports | (2021) 11:5608 | https://doi.org/10.1038/s41598-021-84853-y 9
Vol.:(0123456789)You can also read