Developmental features and predicting airway failure risk in critically ill children with mandibular hypoplasia using 3D computational tomographic ...
←
→
Page content transcription
If your browser does not render page correctly, please read the page content below
www.nature.com/scientificreports
OPEN Developmental features
and predicting airway failure
risk in critically ill children
with mandibular hypoplasia using
3D computational tomographic
analysis
Doo‑Hwan Kim1,5, Eunseo Gwon2,5, Junheok Ock2, Jong‑Woo Choi3, Jee Ho Lee4,
Sung‑Hoon Kim1* & Namkug Kim2*
In children with mandibular hypoplasia, airway management is challenging. However, detailed
cephalometric assessment data for this population are sparse. The aim of this study was to find risk
factors for predicting difficult airways in children with mandibular hypoplasia, and compare upper
airway anatomical differences using three-dimensional computed tomography (3D CT) between
children with mandibular hypoplasia and demographically matched healthy controls. There were
significant discrepancies in relative tongue position (P < 0.01) and anterior distance of the hyoid bone
(P < 0.01) between patients with mandibular hypoplasia and healthy controls. All mandibular measures
were significantly different between the two groups, except for the height of the ramus of the
mandible. After adjusting for age and sex, the anterior distance of hyoid bone and inferior pogonial
angle were significantly associated with a difficult airway (P = 0.01 and P = 0.02). Quantitative analysis
of upper airway structures revealed significant discrepancies, including relative tongue position, hyoid
distance, and mandible measures between patients with mandibular hypoplasia and healthy controls.
The anterior distance of the hyoid bone and inferior pogonial angle may be risk factors for a difficult
airway in patients with mandibular hypoplasia.
In patients with craniofacial developmental deformity such as mandibular hypoplasia, airway management is
critical for patient safety but remains c hallenging1. These patients are generally encountered in the intensive care
unit or operating room due to various co-morbidities2. Failure to predict a difficult airway during anesthesia or
critical care practice can cause severe morbidity and mortality3. Thus, reliable tools for precise diagnosis and
prediction of difficult airways before practice are important. However, detailed configurational assessment data
for these populations is sparse, and actionable airway securing strategies remain anecdotal.
Adequate preoperative airway planning, including patient-specific techniques and equipment, can decrease
the risk associated with difficult airway management4. There is considerable demand for a valid tool to evaluate
airway patency and predict difficult intubation in patients undergoing surgery or receiving optimal care. Multi-
factorial assessments using individual airway tests and difficult airway risk factors may help preoperative airway
planning and difficult airway prediction5,6. However, recently, a large database study using multivariable assess-
ments could not improve difficult airway prediction7. Although radiologic assessments, such as cephalometry, can
provide valuable skeletal information on upper airway p atency8, it provides only two-dimensional representations
of three-dimensional (3D) structures, which cannot provide volumetric data or evaluate soft tissue structures. A
1
Department of Anesthesiology and Pain Medicine, Asan Medical Center, University of Ulsan College of Medicine,
Olympic‑ro 43‑gil, Songpa‑gu, Seoul 138‑736, Korea. 2Department of Convergence Medicine, Asan Medical
Center, University of Ulsan College of Medicine, Seoul, Korea. 3Department of Plastic Surgery, Asan Medical
Center, University of Ulsan College of Medicine, Seoul, Korea. 4Department of Oral and Maxillofacial Surgery,
Asan Medical Center, University of Ulsan College of Medicine, Seoul, Korea. 5These authors contributed equally:
Doo-Hwan Kim and Eunseo Gwon. *email: shkimans@amc.seoul.kr; namkugkim@gmail.com
Scientific Reports | (2021) 11:9881 | https://doi.org/10.1038/s41598-021-89302-4 1
Vol.:(0123456789)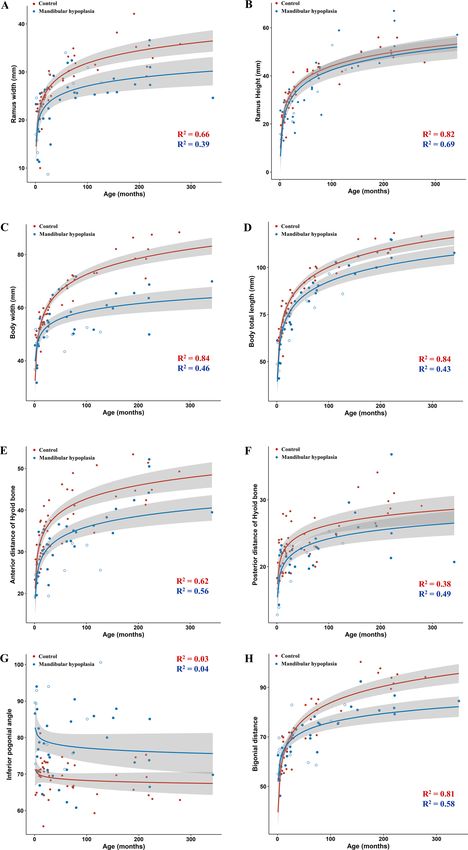
www.nature.com/scientificreports/
3D digitalized quantitative measurement of anatomical structures can overcome these limitations of traditional
cephalometric analysis and provide useful information for airway m anagement9,10.
This study aims to quantitatively analyze structural variations of the mandible, tongue, and airway, as well
as their growth retardation patterns in children with mandibular hypoplasia compared to normal controls. The
objective was to better understand the early natural history of mandibular hypoplasia and to find clinically useful
risk factors for predicting difficult airways.
Methods
Patient selection. This study protocol was approved by our Institutional Review Board of the Asan Medical
Center (Approval Number 2018-0967). From January 1990 to June 2018, patients diagnosed with mandibular
hypoplasia, including Pierre-Robin sequence (PRS), Treacher-Collins syndrome (TCS), Goldenhar’s syndrome
(GS), and hemifacial microsomia (HM)2, were included in this study if they had an available facial bone or head
computed tomographic (CT) scan. We excluded patients with incomplete documentation of clinical and demo-
graphic data. To ensure we meet all image quality criteria, we excluded patients with the following conditions;
(1) accurate parameters could not be obtained because of artifacts on the CT scan, (2) landmarks to reconstruct
3D multi-planar reformatting and to measure the upper airway were not included in the CT scans.
Healthy controls were identified from existing CT data in our institution’s picture archiving and communica-
tion system. Healthy control participants were age, sex, height, and weight-matched to those with mandibular
hypoplasia. The morphological growth pattern of the mandible is strongly related to the dentition development
stages11; hence, subgroup analyses were conducted according to the stage of dentition (≤ 5 and > 5 year-old
group)12.
Measurements and data collection. To analyze the computed tomography scan images, Mimics and
3-matic (Materialise, Leuven, Belgium) software were used. First, each scan was re-sliced to align the head posi-
tion and clarify the skull alignment. The upper airways of patients with mandibular hypoplasia were analyzed
according to the 3D multi-planar reformatting (MPR) plane. The average Frankfort horizontal plane (AFH_p)
was defined using four points: Orbitale left, Orbitale right, Porion left, and Porion right. To form an average
plane using the four points, the following process was required; (1) take the four landmarks required to define
the AFH_p; (2) exclude each of the four points one-by-one and generate a total of the four planes using three
points; (3) at (2) to generate an AFH_p using the average of existing planes algorithm of the 3-matic from the
four planes. 3D MPRs were reconstructed using the midsagittal plane that passed through two points (Nasion,
Opisthion) perpendicular to the average FH plane, and the coronal vormer plane that passing through the pos-
terior aspect of the vomer in the coronal direction—reoriented at the average FH plane and midsagittal plane—
and AFH_p. The hard and soft tissue landmarks needed to measure are defined in the reconstructed 3D MPR
view in Supplementary Table S1 online. A total of 30 defined landmarks were included in the cephalometric
analysis to measure upper airways. Two experts independently measured 30 landmarks of 84 CT scan datasets
for upper airway analysis. The surface area, volume, distance and angle between particular landmarks were
measured in children with mandibular hypoplasia and healthy controls (Fig. 1), according to the definition
stipulated in Supplementary Tables S1 and S2 online.
Collected demographics included age, weight, height at the time of CT scan, sex, and patients’ diagnoses.
Perioperative variables such as history of surgery, tracheostomy, difficult airway, and type of airway maintenance
device were retrieved from the electronic medical record. Based on the practice guideline13, the ‘Difficult airway’
was defined as a clinical situation in which experienced attending staff anesthesiologists (> 10 years) encountered
difficulty with facemask ventilation or difficulty with tracheal intubation. Difficult mask ventilation refers to mask
ventilation that is inadequate, unstable, or requires two providers with or without a muscle r elaxant14. Difficult
tracheal intubation means that tracheal intubation requires multiple attempts, in the presence or absence of
tracheal pathology13.
Statistical analysis. Statistical analysis was performed using the R software version 3.5. Data are presented
as mean ± standard difference (SD) or median [interquartile range (IQR)]. Student’s t-test or the Mann–Whit-
ney U test was used to compare the groups, as appropriate. The inter-rater reliability of the two observers was
analyzed using MedCalc Software (Mariakerke, Belgium). To determine the association between upper airway
measurements and age, we performed a linear regression with logarithmic transformations on each patient with
mandibular hypoplasia and each healthy control. Then, we calculated the logistic regression equation of each
parameter between the two groups. Based on the obtained logistic regression equation of the healthy controls,
differences (∆) between estimated values according to the regression equation and measurement value of each
parameter were then determined. To investigate the risk factors for a difficult airway, the area under the receiver-
operating characteristic (ROC) curve of ∆ parameter was generated. As age and sex could play an important role
in mandibular d evelopment11, logistic regression, adjusted for age and sex, was used to assess the association
between upper airway measurements and difficult airway status. A P < 0.05 was considered statistically signifi-
cant.
To determine inter-observer variability, 18 of the 30 landmarks in 40 CT scan data were measured. Using a
total of 720 landmarks, inter-rater reliability was calculated using the Bland–Altman analysis on the distance
between each landmark and the origin and mean and SD of the distance between the same landmarks by observer
1 and 2.
Scientific Reports | (2021) 11:9881 | https://doi.org/10.1038/s41598-021-89302-4 2
Vol:.(1234567890)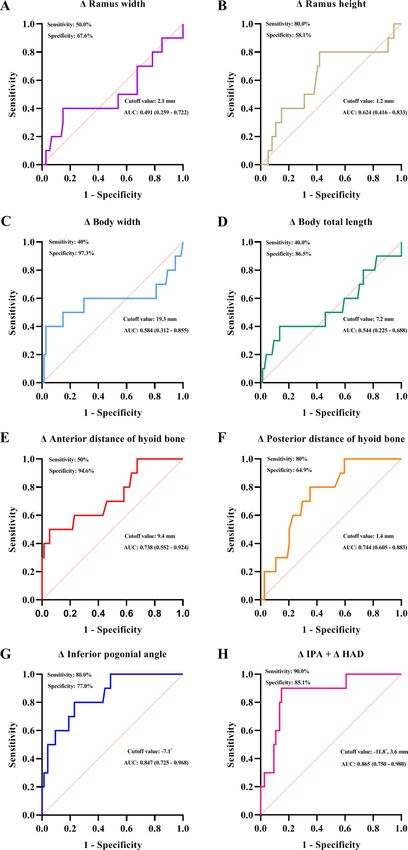
www.nature.com/scientificreports/
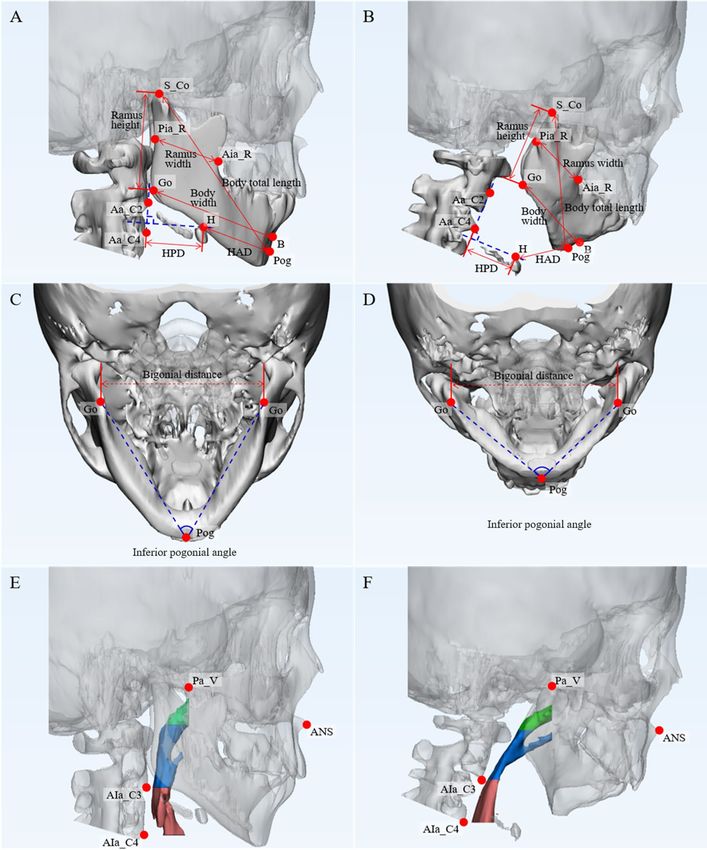
Figure 1. (A) Main variables of mandible measurement in the ramus, mandibular body, and position of the
hyoid bone in healthy controls (A) and patients with mandibular hypoplasia (B). S_Co Superior condylion, Pia
Posterior inner aspect of the ramus, Aia Anterior inner aspect of the ramus, Go Gonion, Pog Pogonion, Aa_C2
Anterior aspect of C2, Aa_C3 Anterior aspect of C3, HAD Hyoid anterior distance, HPD Hyoid posterior
distance. Bigonial distance and inferior pogonial angle in healthy controls (C) and patients with mandibular
hypoplasia (D). Upper airway volumes in healthy controls (E) and patients with mandibular hypoplasia (F).
Green, blue, and red highlights indicate the nasopharynx, oropharynx, and hypopharynx, respectively. Pa_V
Posterior aspect of vomer, ANS Anterior nasal spine, AIa_C2 Anterior inferior aspect of C2, AIa_C4 Anterior
inferior aspect of C4.
Ethics approval. This study was performed according to the Declaration of Helsinki. The current study pro-
tocol was approved by the institutional review board of Asan Medical Center, Seoul, Korea (Approval Number:
2018-0967). Due to the retrospective nature of the study, informed consent was waived.
Scientific Reports | (2021) 11:9881 | https://doi.org/10.1038/s41598-021-89302-4 3
Vol.:(0123456789)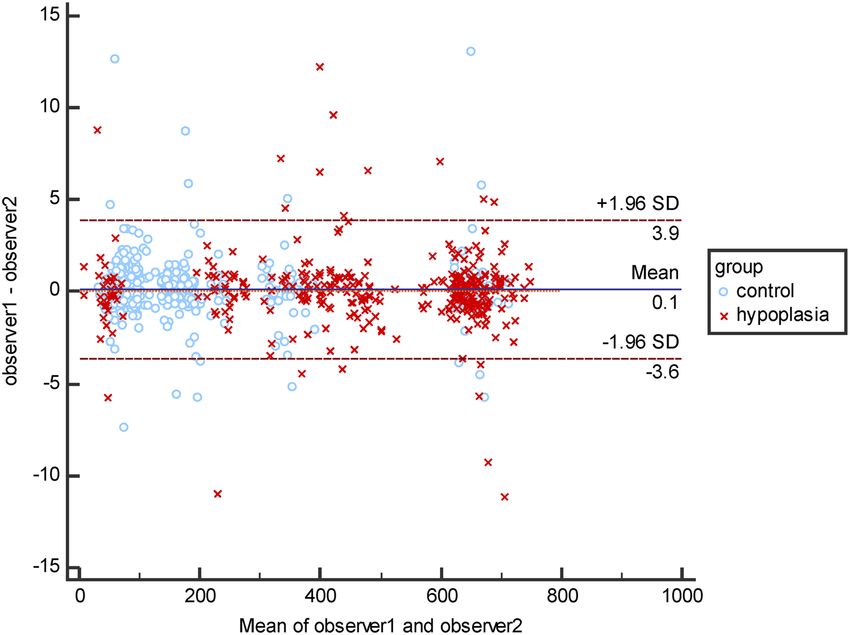
www.nature.com/scientificreports/
Results
In total, 70 patients with mandibular hypoplasia were included. Twenty-one patients with incomplete documen-
tation of clinical data and seven patients without an adequate quantitative CT scan were excluded. Forty-two
patients with congenital mandibular hypoplasia were finally included in the final analyses. In the healthy control
cohorts with available facial bone or head CT scans (n = 518), 42 cases were included after demographically
matching the controls to 42 patients with mandibular hypoplasia. The standardized difference of age, sex, height,
and weight were 0.0067, − 0.0905, − 0.01291, and 0.1425, respectively.
Among the patients with mandibular hypoplasia, the diagnosis was PRS (n = 5, 11.9%), TCS (10, 23.8%), HM
(15, 35.7%), and GS (12, 28.6%). In the total study cohort, ten patients with difficult airway were revealed after the
review of electronic medical records. These individuals consisted of four patients with PRS, two with TCS, two
with HM, and two with GS. Seven patients were ≤ 5 years old, and three patients were > 5 years old. One patient
presented difficult mask ventilation (2.4%), and eight presented difficult laryngoscopy or intubation (19.0%); one
patient had both (2.4%). Thirty-nine patients underwent 41 surgery under general anesthesia. For airway main-
tenance during the induction, direct laryngoscopy was used in 35 (85.4%) cases, a supraglottic airway was used
in two (4.9%), a videoscope was used in two (4.9%), a bronchoscope was used in one (2.4%), and tracheostomy
was used in one (2.4%). Eight patients (19.0%) received tracheostomy during the perioperative period. In these
patients, 4 patients received planned elective tracheostomy in the operating room under general anesthesia, and
they had difficult airway; one patient with difficult mask ventilation and failed intubation, and three patients with
difficult intubation. Four patients received tracheostomy under local anesthesia with sedation in the intensive care
unit before surgery. Two patients underwent planned elective tracheostomy for prolonged mechanical ventilation
after birth in the intensive care unit, but they did not have a difficult airway. Two patients underwent emergent
tracheostomy after failed intubation in the intensive care unit because of life-threatening airway compromise.
Consequently, six patients with receiving tracheostomy were included in a difficult airway group.
There were significant discrepancies in tongue position relative to the anterior nasal spine and palate between
patients with mandibular hypoplasia and healthy controls (10.8 ± 4.2 mm vs. 8.3 ± 4.1 mm, P = 0.007 and 3.1
(1.4–6.1) mm vs. 5.2 (3.5–7.3) mm, P = 0.017; Table 1). Anterior distance and posterior distance of the hyoid bone
(HAD and HPD) were shorter in patients with mandibular hypoplasia than in healthy controls [31.6 (25.1–35.4)
mm vs. 37.4 (31.3–43.3) mm, P < 0.001 and 21.8 ± 4.2 mm vs. 24.2 ± 3.9 mm, P = 0.009]. On 3D CT measurements,
body total length, body width, and ramus width were significantly lesser in patients with mandibular hypoplasia,
and gonial and inferior pogonial angles (IPA) were greater. The other parameters did not differ between the two
groups. Ramus width and height, body width, the total length HAD and HPD, and bigonial distance in both
groups were significantly related to age in the linear regression with logarithmic transformations (Fig. 2).
The area and volume of the oropharynx, ramus height of mandible, and HPD were significantly lesser in
patients with mandibular hypoplasia in the ≤ 5 year-old group only (Table 2). Tongue position relative to the
anterior nasal spine, HAD, ramus and body width, body total length, gonial angle, and inferior pogonial angle
were significantly different between the groups, regardless of age.
HAD, HPD, body total length, body width, and IPA of mandible were significantly different in patients with
difficult airway (n = 10) compared to those with non-difficult airway (n = 74). After regression analysis using
these parameters, HAD, HPD, and IPA were associated with a difficult airway [HAD: odds ratio, 0.83, 95%
confidence interval (CI), (0.71–0.96), P = 0.01; HPD: 0.78 (0.62–0.98), P = 0.04; IPA: 1.11 (1.01–1.22), P = 0.02;
Table 3]. After adjustment for age and sex, HAD and IPA remained significant [0.79 (0.64–0.97), P = 0.03 and 1.10
(1.01–1.21), P = 0.04]. From the ROC curve analysis (Fig. 3), the area under the curve (AUC) of ∆IPA (0.847, 95%
CI: 0.725–0.968) was the greatest among the single parameters and the cutoff point of ∆IPA was − 7.1° (sensitivity
80.0%, specificity 77.0%; Fig. 3G). The addition of ∆HAD to ∆IPA improved the AUC, sensitivity, and specificity.
(AUC: 0.865, 95% CI: 0.751–0.980, sensitivity: 90.0%, specificity: 85.1%, Fig. 3H).
Inter-rater reliability was measured by landmarks on 40 CT scans and was evaluated using the Bland–Altman
plot on the Euclid distance between landmarks and origins (Fig. 4). The mean ± SD of landmark errors in the
hypoplasia and the controls by observer 1 and observer 2 were 2.19 ± 2.50 mm and 1.81 ± 1.18 mm, respectively.
Discussion
This study produced three main findings. First, patients with mandibular hypoplasia showed different growth pat-
terns in upper airway anatomical structures when compared to healthy controls. We found significant between-
group differences in the relative tongue position, hyoid distance, and mandible measurements, but not in the
tongue size or airway volume. Second, we related cephalometric parameters associated with anatomic develop-
ment retardation and their outcomes, which implicated an airway management strategy for children with man-
dibular hypoplasia. Third, we suggested IPA and HAD as clinically meaningful risk factors for airway failure in
children with mandibular hypoplasia. Clinically, these measures may be useful predictors of difficult intubation
because HAD can be easily estimated by measuring the thyromental distance.
To our knowledge, this is the first and largest cohort study to provide digitalized quantitative measurement of
30 anatomical landmarks of 84 3D CT scan datasets for current disease entities. Our results showed significant
between-group and age-related differences in most measurement, but some features were not. The tongue posi-
tion was relatively away from the anterior nasal spine and relatively closer to the palate in patients with mandibu-
lar hypoplasia. This suggests that taller tongue height and more posterior tongue position in these individuals,
consistent with a diagnosis of glossoptosis15. Glossoptosis is one of the clinical triad in patients with PRS and has
been associated with oropharyngeal o bstruction16. Although there were relatively few patients with PRS in the
cohort of patients with mandibular hypoplasia (11.9%), glossoptosis was one of the prominent morphological
features of mandibular hypoplasia. It is possible that the tongue is consequently be shifted posteriorly as a smaller
mandible has less-anterior p rojection17. HAD and HPD describe the external (mandible) and internal (hyoid)
Scientific Reports | (2021) 11:9881 | https://doi.org/10.1038/s41598-021-89302-4 4
Vol:.(1234567890)www.nature.com/scientificreports/
Mandibular hypoplasia (N = 42) Control (N = 42) P value
Age at CTa scan (months) 32.0 (8.0–101.0) 27.5 (15.0–77.0) 0.758
Sex (male, %) 17 (40.5) 20 (47.6) 0.660
Height (cm) 94.1 (72.0–117.5) 84.7 (77.0–120.1) 0.681
Weight (kg) 13.2 (9.3–23.1) 13.2 (10.6–23.4) 0.558
Airway volume (cm3)
Nasopharynx 0.32 (0.06–0.75) 0.25 (0.75–0.49) 0.875
Oropharynx 1.74 (1.05–3.15) 2.59 (1.32–4.24) 0.078
Hypopharynx 1.31 (0.45–2.27) 1.37 (0.70–2.55) 0.462
Oral cavity 2.35 (0.66–4.59) 2.94 (1.86–5.99) 0.294
Airway area (cm2)
Nasopharynx 3.78 (1.26–7.01) 3.04 (1.49–6.26) 0.988
Oropharynx 11.66 (8.17–18.47) 15.04 (9.50–21.23) 0.053
Hypopharynx 9.46 (6.14–15.35) 11.34 (7.27–15.22) 0.361
Oral cavity 20.01 (6.08–22.81) 20.23 (12.81–27.29) 0.487
Tongue
Length (mm) 74.1 (62.7–86.3) 67.3 (58.5–83.8) 0.413
Height (mm) 39.1 (32.1–45.0) 38.2 (32.0–42.6) 0.642
Area (cm2) 11.68 (7.93–15.01) 10.30 (8.10–15.80) 0.778
Relative position to ANSb (mm) 10.8 ± 4.2 8.3 ± 4.1 0.007
Relative position to Palate (mm) 3.1 (1.4–6.1) 5.2 (3.5–7.3) 0.017
Hyoid (mm)
Hyoid anterior distance 31.6 (25.1–35.4) 37.4 (31.3–43.3) < 0.001
Hyoid posterior distance 21.8 ± 4.2 24.2 ± 3.9 0.009
Craniocaudal length 33.5 (28.6–41.0) 32.8 (29.2–37.9) 0.950
Mandibular plane distance 5.6 ± 4.3 5.3 ± 5.5 0.825
Mandible
Ramus height (mm) 32.7 ± 14.7 36.2 ± 10.2 0.211
Ramus width (mm) 23.9 ± 6.3 27.8 ± 5.8 0.004
Body total length (mm) 78.2 ± 19.7 86.6 ± 17.0 < 0.001
Body width (mm) 53.6 ± 9.4 63.3 ± 11.8 0.038
Gonial angle (°) 136.2 ± 6.4 129.1 ± 5.4 < 0.001
Inferior pogonial angle (°) 78.6 ± 9.6 69.0 ± 4.8 < 0.001
Bigonial distance (mm) 69.4 ± 10.7 73.6 ± 13.3 0.114
Table 1. Clinical characteristics and three-dimensional computed tomographic measures of the upper airway
between the mandibular hypoplasia and control groups. Values are mean ± (standard deviation) or median
(interquartile range). a CT Computed tomography. b ANS Anterior nasal spine.
bony relationships that influence oral and pharyngeal soft tissue shape15. In this study, they were significantly
shorter in patients with mandibular hypoplasia. This suggested a compressed hyoid position, which could easily
narrow the compliant a irway15. A relatively long distance between the mandibular plane and the hyoid bone
caused by a short mandibular ramus is traditionally considered a risk factor for a difficult airway2,18,19. However,
we did not find significant between-group differences for this factor in our study. This inconsistency may be
explained, at least partially, by no differences in the mandibular rami in older children.
Most 3D CT measurements of the mandible (ramus width, total body length, body width) in the mandibular
hypoplasia group were significantly shorter than the same measures in healthy controls. This indicated micro-
gnathia, the characteristic of shorter mandibles. Currently, the diagnosis of micrognathia is largely subjective,
and the objective parameters are not present20. Reference guides for normal mandibular dimensions within
various age, sex, and racial groups are also needed for clinical application. This study provides objective param-
eters of micrognathia and normal mandibular dimensions according to age in Asian children, contributing to
determine diagnostic criteria for micrognathia. Micrognathia induces posterior regression of the tongue and a
small hyoid-mental space, potentially resulting in hypopharyngeal collapse2,16. It can also cause narrowing of the
submandibular space, which can obstruct glottic visualization and produce a difficult airway during laryngoscopy
because of an inability to accommodate the displaced t ongue21. In patients with mandibular hypoplasia, airway
obstruction develops at various levels—from oropharyngeal obstruction due to glossoptosis and compressed
hyoid position to hypopharyngeal obstruction due to micrognathia. Additionally, perioperative difficult airway
is also common in this c ohort16.
In pediatric airway management, measurements of surface landmarks are guidelines for determining the
proper size of the nasopharyngeal or oropharyngeal airway according to age and sex22,23. These nomograms
Scientific Reports | (2021) 11:9881 | https://doi.org/10.1038/s41598-021-89302-4 5
Vol.:(0123456789)www.nature.com/scientificreports/
Figure 2. Developmental differences in ramus width and height (A, B), body width and the total length of the
mandible (C, D), anterior and posterior distance of hyoid bone (E, F), inferior pogonial angle, and bigonial
distance (G, H) according to age between the mandibular hypoplasia and the control groups. The red line
indicates the developmental curve of the healthy controls. The blue line indicates the developmental curve of
the patients with mandibular hypoplasia. The grey zone indicates a 95% confidence interval. The open circle
represents patients with a difficult airway among those with mandibular hypoplasia.
Scientific Reports | (2021) 11:9881 | https://doi.org/10.1038/s41598-021-89302-4 6
Vol:.(1234567890)www.nature.com/scientificreports/
≤ 5 years old group > 5 years old group
Mandibular Mandibular
hypoplasia (n = 24) Control (n = 26) P value hypoplasia (n = 18) Control (n = 16) P value
Age at CTa scan
9.5 (4.5–26.0) 17.5 (11.0–26.0) 0.203 120.5 (75.0–192.0) 138.5 (74.5–214.5) 0.717
(months)
Sex (male, %) 9 (50.0) 8 (50.0) 1.000 8 (33.3) 12 (46.2) 0.525
Height (cm) 73.5 ± 16.0 78.6 ± 13.1 0.252 130.1 ± 22.9 140.0 ± 28.8 0.304
Weight (kg) 10.0 (5.7–12.1) 10.6 (9.1–11.7) 0.221 25.4 (19.2–44.2) 39.0 (23.1–58.1) 0.138
Airway volume (cm3)
Nasopharynx 1.00 (0.02–0.29) 0.16 (0.06–0.42) 0.291 0.91 (0.52–1.78) 0.52 (0.24–1.57) 0.518
Oropharynx 1.18 (0.30–1.56) 1.43 (1.03–2.57) 0.022 3.05 (2.57–4.46) 4.65 (3.29–6.72) 0.075
Hypopharynx 0.53 (0.26–0.95) 0.85 (0.41–1.30) 0.097 2.61 (1.82–5.35) 4.08 (2.17–5.89) 0.443
Oral cavity 2.08 (0.55–4.79) 2.96 (1.99–4.63) 0.448 2.35 (1.37–4.59) 2.91 (1.86–7.34) 0.481
Airway area (cm2)
Nasopharynx 1.74 (0.65–3.78) 2.45 (1.36–4.01) 0.289 7.66 (5.26–1.02) 7.17 (3.54–11.18) 0.799
Oropharynx 8.42 (4.02–10.80) 10.90 (8.57–13.88) 0.012 19.43 (12.92–21.64) 21.66 (18.21–27.74) 0.064
Hypopharynx 6.21 (3.32–8.14) 8.12 (5.17–11.27) 0.075 16.15 (12.08–26.60) 22.50 (14.43–29.22) 0.330
Oral cavity 17.31 (4.57–25.47) 29.63 (19.85–46.33) 0.579 22.65 (11.78–31.35) 31.42 (11.35–44.60) 0.541
Tongue
Length (mm) 67.0 ± 11.4 61.6 ± 9.3 0.075 86.5 ± 15.0 61.6 ± 9.3 0.199
Height (mm) 36.4 ± 7.2 32.9 ± 6.0 0.064 44.5 ± 9.7 32.9 ± 6.0 0.080
Area (cm2) 8.94 ± 2.53 8.70 ± 2.09 0.714 17.37 ± 5.08 19.10 ± 5.87 0.364
Relative position to
11.4 ± 4.4 9.0 ± 3.7 0.045 10.0 ± 3.8 7.1 ± 4.4 0.047
ANSb (mm)
Relative position to
4.3 ± 3.8 5.6 ± 3.3 0.197 3.9 ± 3.9 5.3 ± 2.8 0.259
Palate (mm)
Hyoid bone (mm)
Hyoid anterior
26.9 ± 5.1 33.6 ± 5.0 < 0.001 37.2 ± 6.8 44.6 ± 5.2 0.001
distance
Hyoid posterior
19.8 ± 3.1 22.7 ± 2.9 0.001 24.5 ± 4.1 26.6 ± 4.1 0.140
distance
Craniocaudal length 29.7 ± 7.8 29.7 ± 4.6 0.977 41.1 ± 8.7 45.3 ± 11.5 0.230
Mandibular plane
5.1 (2.5–6.9) 3.4 (1.4–6.1) 0.125 4.5 (2.4–8.8) 6.5 (0.9–11.8) 0.918
distance
Mandible
Ramus height (mm) 22.6 ± 6.7 30.0 ± 6.7 < 0.001 46.2 ± 11.1 46.3 ± 5.6 0.966
Ramus width (mm) 20.8 ± 6.3 24.4 ± 3.9 0.023 28.1 ± 3.3 33.4 ± 3.5 < 0.001
Body total length
64.4 ± 12.0 75.4 ± 9.4 0.001 96.6 ± 10.7 104.9 ± 8.5 0.019
(mm)
Body width (mm) 49.4 ± 8.4 55.5 ± 5.2 0.004 59.2 ± 7.8 76.0 ± 7.6 < 0.001
Gonial angle (°) 135.3 ± 6.9 131.3 ± 4.8 0.021 137.4 ± 5.6 125.4 ± 4.2 < 0.001
Inferior pogonial
78.7 ± 9.2 69.8 ± 4.8 < 0.001 78.6 ± 10.5 67.5 ± 4.5 < 0.001
angle (°)
Bigonial distance
63.3 ± 8.0 65.1 ± 6.9 0.396 77.5 ± 8.1 87.3 ± 8.8 0.002
(mm)
Table 2. Clinical characteristics and three-dimensional computed tomographic measures of upper
airway between the mandibular hypoplasia and control groups, stratified by stage of dentition. Values are
mean ± (standard deviation) or median (interquartile range). a CT Computed tomography. b ANS Anterior nasal
spine.
are important for understanding normal development patterns and the relative structural relationships of the
pediatric airway. As a series study of those, current study determined growth patterns of upper airway structures
between children with mandibular hypoplasia and healthy controls. Measurements of upper airway structures
were well correlated with age between the groups. Intriguingly, we observed increased between-group measures
of per child growth, the differences of ramus width, body width, and the gonial angle, but not ramus height.
One explanation could be a unique growth pattern for ramus height. Increases in ramus height are especially
accelerated after the first three years of life, peaking at age five or six24. This accelerating growth pattern seemed
to be especially present in children (> 5 years) with mandibular hypoplasia. Consequently, among older children,
ramus height was similar, although there were significant between-group differences in all other mandibular
measurements.
Among patients with mandibular hypoplasia, eight (19.0%) underwent tracheostomy during the periopera-
tive period. This is consistent with previous studies which reported that 18–23% in patients with PRS and TCS
Scientific Reports | (2021) 11:9881 | https://doi.org/10.1038/s41598-021-89302-4 7
Vol.:(0123456789)www.nature.com/scientificreports/
Crude Age and sex-adjusted
Variables OR (95% CI)a P value OR (95% CI) P value
Hyoid anterior distance 0.83 (0.71–0.96) 0.01 0.79 (0.64–0.97) 0.03
Hyoid posterior distance 0.78 (0.62–0.98) 0.04 0.78 (0.60–1.02) 0.07
Ramus height 0.96 (0.91–1.02) 0.17 0.97 (0.86–1.10) 0.65
Ramus width 0.97 (0.87–1.09) 0.64 1.02 (0.88–1.18) 0.79
Body total length 0.97 (0.93–1.01) 0.11 0.97 (0.89–1.05) 0.45
Body width 0.90 (0.82–1.00) 0.05 0.93 (0.82–1.05) 0.22
Inferior pogonial angle 1.11 (1.01–1.22) 0.02 1.10 (1.01–1.21) 0.04
Bigonial distance 0.97 (0.91–1.04) 0.46 1.03 (0.92–1.14) 0.61
Table 3. Crude, and age and sex-adjusted logistic regression for the prediction of difficult airway. a Odds ratios
(OR) and 95% confidence intervals (CI).
received tracheostomy25,26. To maintain airway patency, four patients (10.3%) received tracheostomy intraop-
eratively out of the ten patients (25.6%) with difficult airways. In the prior reports27,28, a difficult airway was
present in 5.8–6.0% of cases and was mostly managed effectively in healthy patients undergoing elective surgery.
The incidence of difficult mask ventilation combined with difficult tracheal intubation was 0.4%29. Therefore,
our results indicated that mandibular hypoplasia was significantly associated with a difficult airway, and airway
management in these patients was challenging compared to that in healthy controls.
IPA and HAD were significantly associated with a difficult airway after adjusting for age and sex. IPA was
defined as the angle formed by the gonion to the pogonion to the gonion, and corresponded to the triangular
area of the horizontal plane of the mandible. This angle was significantly wider in patients with a difficult airway
compared to those with a non-difficult airway. However, the bigonial distance—which represented the length
of the base of this triangular area—did not differ between the groups, suggesting that the mandible horizontal
dimension was significantly less in patients with difficult airways. This might lead to a narrowed submandibular
space. As mentioned above, a short HAD could result in a narrowed compliant airway. Therefore, a wide IPA and
short HAD in patients with mandibular hypoplasia could induce significant narrowing of the submandibular
space, resulting in a difficult airway. Interestingly, these parameters were also associated with tracheostomy in
patients with PRS, which is consistent with our r esults15. We also calculated the differences between the estimated
normal value according to the age and measurement value of each parameter. After ROC curve analysis using
the differences, ∆IPA and ∆HAD could screen the difficult airway in patients with mandibular hypoplasia. Given
our results, we believe that IPA and HAD may be risk factors for a difficult airway in patients with mandibular
hypoplasia. Especially, assessment of HAD seemed to be similar to that of hyoid-mental distance, which is an
important surrogate for predicting a difficult a irway30. Hence, the preoperative hyoid-mental distance may aid
in screening patients with difficult airways in those with mandibular hypoplasia if the digitalized quantitative
measurements are not available in individual clinical settings.
Radiologic assessment using CT, magnetic resonance imaging, X-ray, and ultrasound display the anatomical
features of the upper airways well and are recommended for evaluation of difficult airway31,32. The 3D CT images
can provide detailed imaging of upper airway structures, including bony and soft tissues, and quantify the tongue
position and mandibular configuration, thereby identifying patients with mandibular hypoplasia. Many of these
patients have considered surgical treatment, and facial CT images are almost needed. Therefore, it may be feasible
to use the 3D analysis to evaluate the airway and make an airway management plan.
Our study had certain limitations related to the methodology. First, we did not include additional informa-
tion related to airway assessment—such as the Cormack–Lehane classification which are clinical difficult airway
predictors—because of the retrospective nature of our data collection process. Second, the small sample size
limited the power of our study and the robustness of our conclusions. Relative to the published literature, how-
ever, our study included the largest group of patients with mandibular hypoplasia supported by objective airway
morphology data. Additionally, this was the first study to compare the airways and facial skeletal morphologies
in children with those in a healthy control group. Although prospective validation is needed, we believe this
study represents the first step toward the development of an objective parameters-based decision tool for airway
management in patients with mandibular hypoplasia. In previous our study, we developed the patient-specific
and hyper-realistic phantom for difficult intubation simulation using 3D printing33. To enrich our understand-
ing the association between specific parameters and difficult airway in children with mandibular hypoplasia, we
plan to examine the validity of the association via a manikin airway simulation model.
Conclusion
This study attempted to understand the growth dynamics of the tongue, airway, and mandible in children with
mandibular hypoplasia. Digitalized quantitative measurements of upper airway structures revealed significant
age-related differences in relative tongue position, hyoid distance, and mandible measures between children with
mandibular hypoplasia and healthy controls. Mandibular hypoplasia was significantly associated with a difficult
airway and these patients required attentive airway management. IPA and HAD may be clinically meaningful
risk factors for predicting a difficult airway in patients with mandibular hypoplasia. This information can assist
our understanding of the airways in children with mandibular hypoplasia and allow us to establish proper airway
management protocols in clinical practice.
Scientific Reports | (2021) 11:9881 | https://doi.org/10.1038/s41598-021-89302-4 8
Vol:.(1234567890)www.nature.com/scientificreports/
Figure 3. ROC curves for prediction of a difficult airway using ∆ramus width and height (A, B), ∆body width
and the total length of the mandible (C, D), ∆anterior and posterior distance of hyoid bone (E, F), ∆ inferior
pogonial angle (IPA), and ∆IPA plus ∆anterior distance of hyoid bone (HAD) (G, H). ∆ indicates the differences
between estimated value according to the regression equation and measurement value of each parameter.
Scientific Reports | (2021) 11:9881 | https://doi.org/10.1038/s41598-021-89302-4 9
Vol.:(0123456789)www.nature.com/scientificreports/
Figure 4. Bland–Altman plot for evaluating inter-rater reliability.
Data availability
The datasets generated during and/or analysed during the current study are available from the corresponding
author on reasonable request.
Received: 10 November 2020; Accepted: 23 April 2021
References
1. Marschall, K. Stoelting’s Anesthesia and Co-Existing Disease 7th edn. (Elsevier, 2018).
2. Hagberg, C. A. Benum of and Hagberg’s Airway Management 3rd edn. (Sallnders Elsevier, 2013).
3. Steadman, J., Catalani, B., Sharp, C. & Cooper, L. Life-threatening perioperative anesthetic complications: major issues surrounding
perioperative morbidity and mortality. Trauma Surg Acute Care Open 2(1), e000113 (2017).
4. Law, J. A. et al. The difficult airway with recommendations for management—part 2—the anticipated difficult airway. Can. J.
Anaesth. 60(11), 1119–1138 (2013).
5. Iohom, G., Ronayne, M. & Cunningham, A. J. Prediction of difficult tracheal intubation. Eur. J. Anaesthesiol. 20(1), 31–36 (2003).
6. Langeron, O. et al. Prediction of difficult tracheal intubation: time for a paradigm change. Anesthesiology 117(6), 1223–1233 (2012).
7. Norskov, A. K. et al. Effects of using the simplified airway risk index vs usual airway assessment on unanticipated difficult tracheal
intubation—a cluster randomized trial with 64,273 participants. Brit. J. Anaesth. 116(5), 680–689 (2016).
8. Lee, H. C., Kim, M. K., Kim, Y. H. & Park, H. P. Radiographic predictors of difficult laryngoscopy in acromegaly patients. J. Neu-
rosurg. Anesth. 31(1), 50–56 (2019).
9. Abramson, Z., Susarla, S., Troulis, M. & Kaban, L. Age-related changes of the upper airway assessed by 3-dimensional computed
tomography. J. Craniofac. Surg. 20, 657–663 (2009).
10. Wani, T. M., Rafiq, M., Talpur, S., Soualmi, L. & Tobias, J. D. Pediatric upper airway dimensions using three-dimensional computed
tomography imaging. Pediatr. Anesth. 27(6), 604–608 (2017).
11. Remy, F. et al. Morphometric characterization of the very young child mandibular growth pattern: What happen before and after
the deciduous dentition development?. Am. J. Phys. Anthropol. 170(4), 496–506 (2019).
12. Abramson, Z., Susarla, S., Troulis, M. & Kaban, L. Age-related changes of the upper airway assessed by 3-dimensional computed
tomography. J. Craniofac. Surg. 20(Suppl 1), 657–663 (2009).
13. Apfelbaum, J. L. et al. Practice guidelines for management of the difficult airway: an updated report by the American Society of
Anesthesiologists Task Force on Management of the Difficult Airway. Anesthesiology 118(2), 251–270 (2013).
14. Han, R., Tremper, K. K., Kheterpal, S. & O’Reilly, M. Grading scale for mask ventilation. Anesthesiology 101(1), 267 (2004).
15. Lee, V. S., Evans, K. N., Perez, F. A., Oron, A. P. & Perkins, J. A. Upper airway computed tomography measures and receipt of
tracheotomy in infants with Robin sequence. JAMA Otolaryngol. Head Neck Surg. 142(8), 750–757 (2016).
16. Cladis, F. et al. Pierre Robin sequence: a perioperative review. Anesth. Analg. 119(2), 400–412 (2014).
17. Gangopadhyay, N., Mendonca, D. A. & Woo, A. S. Pierre robin sequence. Semin. Plast. Surg. 26(2), 76–82 (2012).
18. Kumari, P. et al. Changes in posterior airway space and mandibular plane hyoid distance following mandibular advancement DO.
Ann. Maxillofac. Surg. 6(2), 182–189 (2016).
19. Chou, H. C. & Wu, T. L. Mandibulohyoid distance in difficult laryngoscopy. Br. J. Anaesth. 71(3), 335–339 (1993).
20. Breugem, C. C. et al. Best practices for the diagnosis and evaluation of infants with Robin sequence: a clinical consensus report.
JAMA Pediatr. 170(9), 894–902 (2016).
Scientific Reports | (2021) 11:9881 | https://doi.org/10.1038/s41598-021-89302-4 10
Vol:.(1234567890)www.nature.com/scientificreports/
21. Huang, A. S., Hajduk, J., Rim, C., Coffield, S. & Jagannathan, N. Focused review on management of the difficult paediatric airway.
Indian J. Anaesth. 63(6), 428–436 (2019).
22. Kim, S. H. et al. Estimation of the nares-to-epiglottis distance and the nares-to-vocal cords distance in young children. Br. J.
Anaesth. 109(5), 816–820 (2012).
23. Kim, S. H., Kim, D. H., Kang, H., Suk, E. H. & Park, P. H. Estimation of teeth-to-vallecula distance for prediction of optimal
oropharyngeal airway length in young children. Br. J. Anaesth. 107(5), 769–773 (2011).
24. Smartt, J. M. Jr., Low, D. W. & Bartlett, S. P. The pediatric mandible: I. A primer on growth and development. Plast. Reconstr. Surg.
116(1), 14e–23e (2005).
25. Li, W. Y. et al. Airway management in Pierre Robin sequence: the Vancouver classification. Plast. Surg. 25(1), 14–20 (2017).
26. Hosking, J., Zoanetti, D., Carlyle, A., Anderson, P. & Costi, D. Anesthesia for Treacher Collins syndrome: a review of airway
management in 240 pediatric cases. Paediatr. Anaesth. 22(8), 752–758 (2012).
27. Koh, W., Kim, H., Kim, K., Ro, Y. J. & Yang, H. S. Encountering unexpected difficult airway: relationship with the intubation dif-
ficulty scale. Korean J. Anesthesiol. 69(3), 244–249 (2016).
28. Cafaggi, C., Sorbello, M., Petrini, F. & Pezza, M. Incidence of unpredicted difficult intubation: retrospective study on 2500 patients:
A-1017. Eur. J. Anaesth. 23, 261 (2006).
29. Kheterpal, S. et al. Incidence, predictors, and outcome of difficult mask ventilation combined with difficult laryngoscopy: a report
from the multicenter perioperative outcomes group. Anesthesiology 119(6), 1360–1369 (2013).
30. Gupta, S., Sharma, R. & Jain, D. Airway assessment: predictors of difficult airway. Indian J. Anaesth. 49(4), 257–262 (2005).
31. Kristensen, M. S., Teoh, W. H., Graumann, O. & Laursen, C. B. Ultrasonography for clinical decision-making and intervention in
airway management: from the mouth to the lungs and pleurae. Insights Imaging 5(2), 253–279 (2014).
32. Greenland, K. et al. Changes in airway configuration with different head and neck positions using magnetic resonance imaging
of normal airways: a new concept with possible clinical applications. Br. J. Anaesth. 105(5), 683–690 (2010).
33. Ock, J., Gwon, E., Kim, D. H., Kim, S. H. & Kim, N. Patient-specific and hyper-realistic phantom for an intubation simulator with
a replaceable difficult airway of a toddler using 3D printing. Sci. Rep. 10(1), 10631 (2020).
Acknowledgements
We would like to thank Dr. Hye-Mee Kwon (Department of Anesthesiology and Pain Medicine, Asan Medical
Center) for helping with plotting and fitting curves for Fig. 2.
Author contributions
S.-H.K. and N.K. take responsibility for the content of the manuscript, including the data and analysis. D.-H.K.,
J.O., and E.G. contributed to the acquisition, analysis, and interpretation of the data. D.-H.K. and E.G. drafted
the initial manuscript and are primary co-first authors of the manuscript. J.-W.C. and J.H.L. interpreted the
data and revised the manuscript. S.-H.K. and N.K. conceived and designed the study, acquired data, analyzed
and interpreted data, and drafted and revised the manuscript. S.-H.K. and N.K. equally contributed to this work
correspondence.
Funding
This research was supported by a Grant of the Korea Health Technology R&D Project through the Korea Health
Industry Development Institute (KHIDI), funded by the Ministry of Health & Welfare, Republic of Korea
(HI18C1638, HI18C2383).
Competing interests
The authors declare no competing interests.
Additional information
Supplementary Information The online version contains supplementary material available at https://doi.org/
10.1038/s41598-021-89302-4.
Correspondence and requests for materials should be addressed to S.-H.K. or N.K.
Reprints and permissions information is available at www.nature.com/reprints.
Publisher’s note Springer Nature remains neutral with regard to jurisdictional claims in published maps and
institutional affiliations.
Open Access This article is licensed under a Creative Commons Attribution 4.0 International
License, which permits use, sharing, adaptation, distribution and reproduction in any medium or
format, as long as you give appropriate credit to the original author(s) and the source, provide a link to the
Creative Commons licence, and indicate if changes were made. The images or other third party material in this
article are included in the article’s Creative Commons licence, unless indicated otherwise in a credit line to the
material. If material is not included in the article’s Creative Commons licence and your intended use is not
permitted by statutory regulation or exceeds the permitted use, you will need to obtain permission directly from
the copyright holder. To view a copy of this licence, visit http://creativecommons.org/licenses/by/4.0/.
© The Author(s) 2021
Scientific Reports | (2021) 11:9881 | https://doi.org/10.1038/s41598-021-89302-4 11
Vol.:(0123456789)You can also read