Usefulness of Measuring Thiopurine Metabolites in Children with Inflammatory Bowel Disease and Autoimmunological Hepatitis, Treated with ...
←
→
Page content transcription
If your browser does not render page correctly, please read the page content below
Hindawi
Gastroenterology Research and Practice
Volume 2021, Article ID 9970019, 10 pages
https://doi.org/10.1155/2021/9970019

Research Article
Usefulness of Measuring Thiopurine Metabolites in Children with
Inflammatory Bowel Disease and Autoimmunological Hepatitis,
Treated with Azathioprine

          Katarzyna Bąk-Drabik ,1 Piotr Adamczyk ,2 Justyna Duda-Wrońska ,3
          Dominika Dąbrowska-Piechota ,3 Anna Jarzumbek ,1 and Jarosław Kwiecień                                                 1

          1
            Department of Pediatrics, Faculty of Medical Sciences in Zabrze, Medical University of Silesia, Katowice, Poland
          2
            Department of Pediatrics, Faculty of Medical Sciences in Katowice, Medical University of Silesia, Katowice, Poland
          3
            Faculty of Medical Sciences in Zabrze, Students Association, Medical University of Silesia, Katowice, Poland

          Correspondence should be addressed to Katarzyna Bąk-Drabik; bak-drabik@wp.pl

          Received 7 March 2021; Revised 30 April 2021; Accepted 31 May 2021; Published 18 June 2021

          Academic Editor: Muhammad Naeem

          Copyright © 2021 Katarzyna Bąk-Drabik et al. This is an open access article distributed under the Creative Commons Attribution
          License, which permits unrestricted use, distribution, and reproduction in any medium, provided the original work is
          properly cited.

          Introduction. Thiopurines, such as azathioprine (AZA) and 6-mercaptopurine (6-MP), are immunomodulatory agents, used for the
          maintenance of remission in children with inflammatory bowel disease (IBD)—Crohn’s disease (CD) and ulcerative colitis (UC), as
          well as with autoimmunological hepatitis (AIH). Measurements of thiopurine metabolites may allow identifying patients at risk for
          toxicity and nonadherence. It can also provide an explanation for the ineffectiveness of the treatment, observed in some patients.
          Patients and Methods. A retrospective analysis was carried out of sixty-eight patients (thirty-six patients with CD, eighteen with
          UC, and fourteen with AIH), treated with AZA. Thiopurine metabolites, 6-thioguanine nucleotide (6-TGN) and 6-
          methylmercaptopurine (6-MMP), were assayed by high-performance liquid chromatography (HPLC), and the AZA dose was
          adjusted when 6-TGN concentration was known. Result. Only twenty-five (41%) children had therapeutic 6-TGN
          concentrations, ten (16%) subjects had suboptimal 6-TGN concentrations, and twenty-six subjects (43%) had 6-TGN
          concentrations above the recommended therapeutic range. 6-MMP was not above the therapeutic range in any case. Seven
          subjects revealed undetectable 6-TGN and 6-MMP levels, indicating nonadherence. The mean AZA dose after the 6-TGN
          concentration-related adjustment did not differ, in comparison to the initial dose, either in IBD or AIH groups. The mean AZA
          dose was lower in AIH than in IBD. The subjects with an optimal 6-TGN level presented with a higher ratio of remission (88%)
          than the under- or overdosed patients (60% and 69%), respectively (Chi − square test = 3:87, p < 0:05). Conclusion. Timely
          measurements of thiopurine metabolites can be a useful tool to identify nonadherent patients before a decision is taken to
          switch to another drug. We may also spot the patients who receive either too low or too high doses, compensating dose
          deviations in an appropriate way. The patients with optimal 6-TGN levels presented a higher percentage of remission than the
          under- or overdosed patients. In most patients, both initial and adjusted AZA doses, lower than suggested in guidelines,
          appeared to be sufficient to maintain remission.

1. Introduction                                                          (AZA) has been proven to be a suitable medication with
                                                                         regard to its efficacy and side-effect profile.
Immunosuppressants are crucial drugs for the treatment of                    AZA was synthesized in 1957 as a derivative of 6-
autoimmune disorders, including autoimmune hepatitis                     mercaptopurine (6-MP) but earlier, in 1951, George Her-
(AIH) and inflammatory bowel diseases (IBD). Azathioprine                 bert Hitchings and Gertrude Elion discovered 6-MP and
2 Gastroenterology Research and Practice
thioguanine (TG) as a result of searching for antimetabo- 6-MMP 6-MTIMP
lites of nucleic acid bases that could arrest cell proliferation TMPT TMPT
[1]. Thiopurines are prodrugs, metabolised by, at least, four
different pathways until the final molecules, called thiogua- HPRT IMPDH GMPS
nine nucleotides (TGN), are obtained [1]. AZA 6-MP 6-TIMP 6-TXMP 6-TGNs
The metabolism of 6-MP involves three competing
pathways: the first one being a degradation to thiouric acid
(TUA), which is then excreted, the second one leads XO ITP ase
through methylation by thiopurine S-methyltransferase 6-TU 6-TITP
(TPMT) into 6-methylmercaptopurine (6-MMP), and the
third one involves the breakdown of 6-MP into thioinosine Figure 1: Azathioprine metabolism. AZA: azathioprine; HPRT:
monophosphate (TIMP), catalysed by hypoxanthine phos- hypoxanthine phosphoribosyltransferase; IMPDH: inosine
phoribosyltransferase (HPRT). TIMP is then further metabo- monophosphate dehydrogenase; GMPS: guanosine monophosphate
lised via inosine monophosphate dehydrogenase (IMPDH) synthase; ITPase: inosine triphosphatase; XO: xanthine oxidase;
into thioguanine triphosphate (TGMP). Kinases convert this TPMT: thiopurine S-methyltransferase; 6-MP: 6-mercaptopurine;
into the TGNs [2]. TGNs are the active metabolites which 6-MMP: 6-methylmercaptopurine; 6-MTIMP: 6-methylthioinosine
exert immunomodulatory effects, whereas 6-MMP and 6- monophosphate; 6-TXMP: 6-thioxanthylic acid; 6-TGNs: 6
thioguanine nucleotides; 6-TIMP: 6-thioinosine monophosphate; 6-
MMPR are the inactive and potentially toxic metabolites.
TITP: 6-thioinosine triphosphate; 6-TU: 6-thiouric acid.
These processes are presented in Figure 1.
AZA and 6-MP are immunosuppressants with short
half-lives (3 and 1.5 hours, respectively) and, therefore, mea- to the ECCO (European Crohn’s and Colitis Organization)
suring their metabolites is a more appropriate method, both guidelines [8, 9], and the AIH children were treated accord-
for adherence assessment and therapeutic drug monitoring. ing to ESPGHAN Hepatology Committee [10]. Seven
An intracellular accumulation of AZA/6-MP metabolites patients with undetectable 6-TGN and 6-MMP levels were
occurs over a period of 2–3 weeks [3]. Various studies have excluded from a detailed analysis concerning the assess-
examined the relationship between 6-TGN levels in red ment of the mean values of the AZA dose, initial and after
blood cells and a clinical response to thiopurine therapy. correction, 6-TGN, 6-MMP, and a statistical analysis of
There is an evidence that 6-TGN levels above 230 those variables.
pmol/8 × 108 erythrocytes correspond to a good clinical Among the remaining subjects, the following data were
effect [4, 5], however, they do not guarantee remission. On collected: demographics, body mass, type of disease, and
the other hand, a 6-TGN level above 450 pmol/8 × 108 eryth- laboratory data including white blood cell count, haemoglo-
rocytes may lead to an increased risk of myelotoxicity [6]. bin, aspartate aminotransferase (AST), alanine transaminase
The concentrations of 6-MMP above 5400 pmol/8 × 108 (ALT), and amylase and thiopurine metabolites (6-TGN, 6-
erythrocytes have been related to the development of hepa- MMP). IBD activity was determined, using the respective
totoxicity [7]. Thiopurine metabolite measurements become scales: PUCAI (the Paediatric Ulcerative Colitis Activity
more and more available, although their routine use is still Index) and PCDAI (the Paediatric Crohn’s Disease Activity
limited by costs and technical requirements at laboratories. Index). Biochemical remission in AIH was defined as a nor-
The primary aim of this study was to assess the usefulness malisation of transaminase activity and IgG concentration
of monitoring thiopurine metabolites in paediatric patients [10]. The mean duration of AZA therapy, before azathio-
with IBD and AIH to assess their adherence to therapy prine metabolites were assayed, was 397 days (the range:
and treatment safety. According to our knowledge, evaluat- 127-1294). The characteristics of the study group are
ing the use of metabolite measurement in children receiving presented in Table 1.
thiopurine treatment was not performed in Polish children
population. It is probably that the population from which 2.2. Methods. Azathioprine metabolite (6-TGN and 6-MMP)
the sample comes from could influence the results of the levels were determined at an external analytical laboratory. In
study. The secondary aim of the study was to compare summary, cells, isolated from venous EDTA blood samples,
AZA doses in both diseases and among the subgroups of were first three times washed with an isotonic buffer and then
patients, stratified according to the disease activity. lysed, using the thermal disruption method. Subsequently,
the lysates were deproteinised by incubation in acidic condi-
2. Material and Methods tions and centrifuged for at least 15 min. at >10 000 rcf to
remove cellular debris. The cleared lysates were analysed by
2.1. Subjects. Sixty-eight children (thirty-one girls) with IBD high-performance liquid chromatography (HPLC) against a
and AIH, receiving azathioprine therapy in a consistent dose reversed-phase (RP) and by detection at 300-350 nm (using
to maintain remission for at least 3 months, treated in one a UV-VIS detector). The obtained concentrations were quan-
regional paediatric gastroenterology centre between April tified, using the AUC (area under curve) method, comparing
2017 and May 2020, were identified by means of a retrospec- the values against a standard curve, obtained with synthetic
tive review of their medical records. Within that group, there calibrators of known concentrations. Such raw reads were
were thirty-six patients with CD, eighteen with UC, and four- normalised, based on the RBC (red blood cell count) of each
teen with AIH. All the IBD children were treated according sample. The final results were calculated as pmol/8 × 108Gastroenterology Research and Practice 3
Table 1: Background information about the group receiving erythrocytes. Figure 2 presents a typical spectrum, obtained
azathioprine. for azathioprine metabolite measurement using HPLC
resolved using water to methanol biphasic system.
Characteristics Values
Total number of patients 61 2.3. Interpretation of the Results. The thresholds of 6-TGN
Females (percent) 27 (44%) and 6-MMP measurements and the interpretation of obtained
Age (years ± SD) 14:97 ± 2:6 results are presented in Table 2. Thus, it was aimed at keeping
Crohn’s disease (CD) 31 (50%)
6-TGN levels in the range of 230-450 pmol/8 × 108 erythro-
cytes and 6-MMP below 5700 pmol/8 × 108 erythrocytes.
Ulcerative colitis (UC) 16 (26%)
Autoimmune hepatitis (AIH) 14 (23%)
3. Statistical Analysis
Weight SDS (mean ± SD) 0:13 ± 1:11
CD −0:23 ± 1:0 A statistical analysis was performed, using the Statistica
−0:39 ± 0:7 software (StatSoft, Tulsa, OK, USA). Descriptive statistics
UC
for continuous variables were presented as mean values
AIH 0:53 ± 0:8 and standard deviations. The Shapiro-Wilk test was applied
Height SDS (mean ± SD) −0:43 ± 0:8 to verify the normality of data distribution. For a compara-
CD −0:54 ± 0:9 tive analysis (comparisons between study groups), the
applied statistical tools included the Student’s t-test for
UC −0:60 ± 0:7
independent samples or the Mann–Whitney U-test (for data
AIH 0:11 ± 0:7 with normal or abnormal distribution). The analysis of var-
BMI SDS (mean ± SD) 0:06 ± 0:9 iance (ANOVA) with a post hoc least significance difference
CD −0:04 ± 0:9 (LSD) test was used when more than 2 subgroups were
compared. The longitudinal comparisons between the mea-
UC −0:12 ± 0:8
surements, obtained at baseline and during follow-up, were
AIH −0:03 ± 2:7 assessed by the t-test for dependent samples or the Wil-
Premonitoring azathioprine dose coxon signed-rank test, whichever was appropriate, accord-
1:15 ± 0:3
mg/kg (mean ± SD) ing to the data distribution. A correlation analysis was done
CD 1:22 ± 0:3 by Pearson’s or Spearman’s correlation tests, whichever was
1:23 ± 0:3
appropriate, according to data distribution. Qualitative fea-
UC
tures were presented, juxtaposing the number of subjects
AIH 0:94 ± 0:3 with the percentage values in the defined subgroups. Com-
Postmonitoring azathioprine dose 1:08 ± 0:4 parisons of qualitative feature prevalence rates were per-
mg/kg (mean ± SD) formed by the Chi-square test. Significance for results in
CD 1:11 ± 0:4 all the statistical analyses was assumed at p < 0:05.
UC 1:26:±0:3 The caregivers of the patients have consented to the use
of their medical data in anonymised forms for statistical, edu-
AIH 0:84 ± 0:3
cational, and scientific purposes, which is a standard proce-
6-TGN (mean ± SD) 494:7 ± 345:3 dure at the hospital. The current data analysis has been
CD 534:9 ± 371:8 approved by the hospital authorities.
UC 371:0 ± 174:5
AIH 535:6 ± 398:4
4. Results
6-MMP (mean ± SD) 1288 ± 886:0 4.1. Measurements of 6-TG and 6-MMP: An Interpretation of
CD 1236 ± 816 Metabolite Levels in the Group Receiving AZA. The mean 6-
TGN values in the whole group, as well as in CD, UC, and
UC 1505 ± 990
AIH patients, were 494:7 ± 343:5, 534:9 − ±371, 8 371:0 ±
AIH 1175 ± 952 174:5, and 535:6 ± 398:4 pmol/8 × 108 erythrocytes, respec-
Disease activity: tively. The mean 6-MMP values in the whole group, as well
Remission/mild form of IBD 32 (68%) as in CD, UC, and AIH patients, were 1288 ± 886, 1236 ±
Moderate form of IBD 10 (21%) 816, 1505 ± 990, and 1175 ± 952 pmol/8 × 108 erythrocytes,
Severe form of IBD 5 (11%)
respectively (see Figure 3).
Twenty-five (41%) children had therapeutic 6-TGN con-
Remission of AIH 14 (100%)
centrations with a normal 6-MMP range. Ten (16%) had
SD: standard deviation; 6-MMP: 6-methylmercaptopurine; 6-TGN: suboptimal 6-TGN concentrations with a normal 6-MMP
6-thioguanine; IBD: inflammatory bowel disease; AIH: autoimmunological
range, which indicates that the AZA dose was below the ther-
hepatitis; CD: Crohn’s disease; UC: ulcerative colitis.
apeutic level. Twenty-six subjects (38%) had 6-TGN concen-
trations above the required therapeutic range with a normal
6-MMP concentration, which indicated hypomethylation4 Gastroenterology Research and Practice
mAU
20.0
6-MMP
17.5
6-MMP
15.0
12.5
10.0
7.5
5.0
2.5
0.0
0.0 2.5 5.0 7.5 10.0 12.5 15.0 17.5 20.0 22.5 25.0 27.5 min
mAU
50
6-TGN
40
6-TGN
30
20
10
0
0.0 2.5 5.0 7.5 10.0 12.5 15.0 17.5 20.0 22.5 25.0 27.5 min
Figure 2: Representative examples of full HPLC spectra acquired for the measurements of thiopurine metabolites, 6-MMP (top) and 6-TGN
(bottom). The marked peaks are specific for 6-MMP and 6-TGN, respectively. The remaining peaks do not have an influence on result
interpretation.
Table 2: Interpretation of metabolite levels (measured in pmol/8 × 108 erythrocytes) and recommended approaches. TPMT: thiopurine
methyltransferase; 6-MMP: 6-methylmercaptopurine; 6-TGN: 6-thioguanine.
6-TGN 6-MMP Interpretation Recommendation
Very low Very low Nonadherence Improve adherence
Low (450) Normal (5700)
hepatotoxicity the dose
Potential TMPT absence, lack of
>1000 Undetectable Discontinuation of treatment
methylation, risk of acute toxicityGastroenterology Research and Practice 5
1600
1400
AZA metabolite concentration
1200
[pmol/8×108 erythrocytes]
1000
800 1505
1288 ±
1236 1175
± 990
600 ± ±
886 816 952
400
494.7 534.9 535.6
± ± 371.0 ±
200 371.8 ± 398.4
343.5
174.5
0
6-TGN 6-MMP
AII UC
CD AIH
Figure 3: Interpretation of metabolite levels in the group receiving AZA. AZA: azathioprine; CD: Crohn’s disease; UC: ulcerative colitis; AIH:
autoimmunological hepatitis; 6-MMP: methylmercaptopurine; 6-TGN: 6-thioguanine.
and a potential toxicity for the bone marrow. Seven subjects the other cases (55%), the AZA dose was corrected. In 16%
had undetectable 6-TGN and 6-MMP levels, which indicated (10/61) cases, the AZA levels were below the range but the
nonadherence to the therapy. 6-MMP concentrations above dose was increased only in 15% (9/61) subjects because of
the range, which would indicate potential hepatotoxicity, slightly decreased levels of leucocytes in the remaining
were not identified in any case (see Table 3). patients of the study group. In 42% cases (26/61), 6-TGN-
levels were above the range but dose modification was intro-
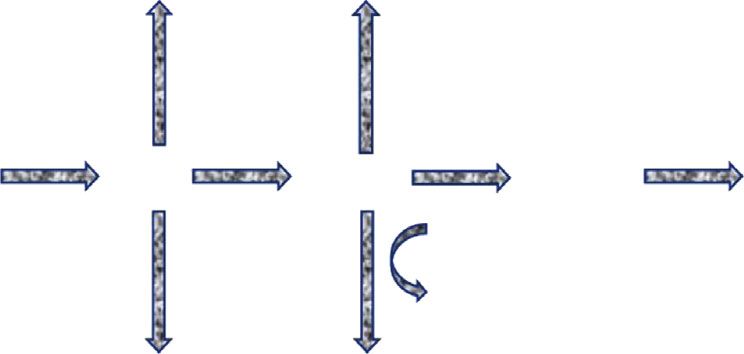
4.2. The Mean AZA Dose, Initial and after Adjustment duced only in 39% (24/61) subjects. In two patients, 6-TGN
concentration was slightly above the range; the dose was
4.2.1. The Difference between Pre- and Postadjustment of
maintained for the lack of remission (see Figure 5).
AZA Dose, Both in IBD (CD, CU) and AIH Subjects. The
The subject with optimal 6-TGN levels presented a
presented mean initial AZA dose in the whole study group,
higher ratio of remission (88%) than those who were
as well as in CD, UC, and AIH subgroups, was 1:15 ± 0:35,
either under- or overdosed (60% and 69%), respectively
1:22 ± 0:37, 1:23 ± 0:32, and 0:94 ± 0:30 (mg/kg/day),
(Chi − square test = 3:87, p < 0:05).
respectively. The dose after adjustment, based on 6-TGN
concentrations, did not differ significantly from the initial 4.4. Adverse Outcomes. One patient (1.6%) developed leuco-
AZA dose, either in the whole study group or in CD, UC, poenia (6 Gastroenterology Research and Practice
Table 3: Metabolite levels. Mean standard deviations and the range of values of 6-thioguanine (6-TGN), 6-methylmercaptopurine
(6-MMPN), measured in pmol/8 × 108 erythrocytes.
6-TGN levels (all subjects) 6-MMPN levels (all subjects) Interpretation
Mean level: 494 ± 343 1288 ± 886
Within range 41% (25/61) Within range Therapeutic optimum
Below range 16% (10/61) Within range Insufficient dose
Potential TPMT deficiency
Above range 43%(26/61) Within range
(potential bone marrow toxicity)
Undetectable 7 subjects Undetectable Nonadherence
6-MMP: methylmercaptopurine; 6-TGN: 6-thioguanine; TPMT: thiopurine S-methyltransferase.
Average AZA dose [mg/kg of body weight]
1.40 p NS
p NS
1.20
p NS
1.00
0.80
1.22 1.23 1.26
1.11 ± ±
0.60 ±
± 0.35 0.94
0.37 0.32 0.84
0.44 ±
0.40 ±
0.31
0.31
0.20
0.00
CD UC AIH
Pre-adjustment dose
Post-adjustment dose
Figure 4: The difference between pre- and postadjustment AZA doses, both in IBD (CD, UC) and AIH subjects. AZA: azathioprine; CD:
Crohn’s disease; UC: ulcerative colitis; AIH: autoimmunological hepatitis.
improve the adherence rates [12]. Several factors, such as
sociodemographic, individual, family, disease regimen, and
health care system, influence nonadherence. Indeed, in our
15% study, only in 46% of cases, 6-TGN levels were within the
therapeutic range and the dose was not changed. In that
group of patients, the subjects with optimal 6-TGN levels
46%
presented higher a higher remission percent (88%) than
those who were either under- or overdosed. That observa-
39% tion applied to all the AIH and IBD subjects. In a large
study, where metabolite levels were reviewed in 9187
patients, the therapeutic goal was achieved only in 2444
patients (27%) [13].
In our study, seven subjects had undetectable 6-TGN and
6-MMP levels. A detailed medical history, regarding medi-
Without dose correction cine intake regularity, revealed that those patients had not
Reduction dose been taking the prescribed medicines for fear of side effects.
Increasing dose In that group, there were five CD and two UC patients. We
did not asses the adherence to treatment, using any specific
Figure 5: Therapeutic decision based on 6-TG concentrations. 6- questionnaires, although a multimethod assessment is more
TGN: 6-thioguanine.
widely used [3]. In the future, we plan to assess adherence
not only by objective methods but also with a specific ques-
tionnaire for both: parents and children. The lack of remis-
sion was an indication to consider the reintroduction ofGastroenterology Research and Practice 7
AZA therapy. In a Spanish study, the authors did not find revealed that serial thiopurine metabolite level assessments
any high rates of nonadherence (6.45%) but they strongly and dose adjustment aiming to maintain higher 6-TGN levels
emphasised that the measurements of thiopurine metabolite could be helpful to improve long-term outcomes in patients
concentrations could be useful to identify nonresponders with IBD. The median 6-TGN levels were significantly higher
before replacing or combining thiopurines with other alter- in the patients who did not relapse, as compared with the
native treatments (generally biological agents), with a conse- levels in those patients who did relapse (233 vs. 167 pmol
quent increase in both, a potential toxicity and costs [2]. per 8 × 10⁸ erythrocytes, p = 0:025) [5]. Dubinsky et al. dem-
Bokemeyer et al. [14] revealed in their study that, in a group onstrated that, in paediatric patients, 6 − TGN level ≥ 235
of 65 adult CD patients, six (9.2%) had metabolite profiles pmol per 8 × 10⁸ erythrocytes was associated with a thera-
that were indicative of nonadherence. The rate of nonadher- peutic response to 6-MP [20]. Wright et al. also revealed that
ence is comparable to the values in previously published those patients, who developed active disease, accumulated
studies [13, 15]. Hommel et al., evaluating adherence in 42 significantly lower 6-TGN concentrations than those who
IBD adolescents, found that the majority of the sample remained in remission (175 vs. 236 pmol per 8 × 10⁸ erythro-
(93%) had demonstrated quantifiable 6-TGN levels but only cytes, respectively). This study shows additionally that, due to
14% were within the therapeutic range what indicated that intrapatient variability in 6-TGN production and the high
nonadherence assessment was especially important in the incidence of compliance problems, a single 6-TGN reading
group of adolescents, faced with learning to manage a may not be reflective of drug metabolism and serial measure-
chronic condition and negotiate normal developmental ments could be more useful [15].
issues [16]. Alsous et al. [3], using a binary logistic regression All our children, whose 6-TGN level was below the ther-
analysis, identified the age to be independently predictive of apeutic range, were IBD patients. They reported a regular
adherence, with adolescents more likely to be classified as intake of AZA, so AZA dose was increased. An ideal thera-
nonadherent. The mean age of our nonadherent subjects peutic 6-TGN-level for AIH was not determined [21]. The
was 15 years. The patients, who are nonadherent, are more abovementioned Sheiko study revealed that 87% of 66 chil-
likely to have a more severe course of disease, potentially dren maintained sustained biochemical remission in associa-
necessitating the need for a more aggressive medical treat- tion with low 6-TGN levels, ranging from 50 to 250 pmol
ment, such as an increased corticosteroid use or surgery, [21]. In a French study [22], the subjects in remission had
present a higher risk of disease recurrence, in addition to similar-6-TGN levels (mean 6-TGN 436 pmol) as those with
these medical consequences, and, eventually, suffer of poor active disease (mean 6-TGN 406 pmol), which demonstrated
psychosocial functioning and low quality of life [17]. the lack of correlation between 6-TGN levels and remission
induction. After dose modification, follow-up measurements
5.2. Underdosing. The regular measurements of metabolites were carried out after three months.
can also identify patients who receive too low or too high
drug dose, with available information about thiopurine 5.3. Overdosing. In 39%, 6-TGN levels were above the range,
methyltransferase (TPMT). In the Caucasian population, with 6-MMP levels within the range, which indicated a
0.3% subjects have TMPT deficiency, 6-11% have moderately potential TPMT deficiency and potential bone marrow toxic-
reduced levels of TPMT activity, and 89-94% have normal ity. We did not observe 6 − TGN > 1000 pmol per 8 × 10⁸
TMPT activity. Tests for TPMT deficiency, prior to the onset erythrocytes with undetectable 6-MMP, which could suggest
of thiopurine therapy, should be the first step in personalising TPMT absence. A high concentration of 6-TGN is associated
thiopurine therapy; however, cytopenia may still occur, with an increased occurrence of adverse events. In a study by
despite normal TPMT activity, which does not identify Lee et al. [23], the occurrence of leucocytopaenia and lym-
patients at risk of other toxic or allergic adverse events, either. phopenia was associated with high concentrations of 6-
The latter information may help differentiate patients TGN. Also, Pavlovska et al. showed similar results [24].
between those who have received a suboptimal AZA dose However, we did not observe this correlation in our study;
and those who have had higher TPMT activity, shifting the possibility of serious side effects should be considered in
AZA metabolism towards 6-MMP production. However, case of high 6-TGN levels. An interpretation of the range as
the cost and availability significantly reduce the use of the high (>450 pmol per 8 × 10⁸ erythrocytes) depends on clini-
tests in routine practice. For this reason, we did not perform cal features. In cases of active diseases, high 6-TGN levels
this test before the beginning of treatment at our hospital. suggest a thiopurine refractory case, prompting for an alter-
In our study, 10 cases (15%) had 6-TGN levels below the native treatment [25]. In case of remission or mild disease,
therapeutic range with 6-MMP within the range that indi- dose reduction should be considered. In our study, dose
cated underdosing. It could also indicate irregular medica- modification was decided in 24 patients (39%), and in 2
tion intake, so a detailed medical history is essential. 6-TG patients, 6-TGN concentration was only slightly above the
below the therapeutic range and 6-MMP above the range range, so the dose was maintained.
could indicate preferential metabolism via the TPMT path- As in some other studies, we did not find any correla-
way but it was not observed in our study. Another study tion between thiopurine dose and 6-TGN levels; therefore,
showed even a higher percentage of underdosing [46]. increasing the drug dose may not be sufficient to reach the
It is recommended to keep 6-TGN levels between 250 desired 6-TGN target [24, 26]. This may be explained by
and 450 pmol to maintain remission in inflammatory bowel an increased methylation of intermediate 6-MP metabo-
disease [8, 9, 18, 19]. In one of the recent studies, it was lites by inherited high levels of TPMT activity [5]. Other8 Gastroenterology Research and Practice
explanations refer to changes in azathioprine absorption, doses, 75% of IBD patients in our study were in remission.
depending on disease activity, AZA formulation, or interac- Those results suggest that therapeutic thiopurine metabolites
tions with other drugs, such as mesalazine or and sulphasala- can be achieved with a dose lower than recommended,
zine [27]. On the contrary, Lee et al. found a positive although, since TMPT activity was not determined at the
correlation between the dose of AZA and the concentrations beginning of treatment, we could not know then that lower
of 6-TGN (p < 0:0001) [23]. Despite the trend, favouring AZA doses could be sufficient to maintain remission.
individualised dosing, other studies show no statistically sig-
nificant differences in treatment efficacy between individua- 5.5. Side Effects. Myelotoxicity is one of the most serious
lised dosing, based on baseline TPMT activity, and dosing, thiopurine-induced side effects and may occur at any time
subsequently adjusted, according to the 6-TGN concentra- during the treatment. It is strongly linked to low TPMT
tions and weight-based AZA dosing [28]. enzyme activity and high 6-TGN blood levels. Myelotoxicity
may also occur with normal TPMT activity, necessitating
5.4. Mean AZA Dose. In our study, the mean initial AZA dose regular full blood count monitoring in clinical practice. In a
and the dose after adjustment, based on 6-TGN concentra- review of 66 studies, including more than 8,000 thiopurine-
tions, were lower than those, proposed in ECCO and ESP- treated patients, the incidence rate of drug-induced myelo-
GHAN guidelines, both in IBD and AIH patients. toxicity was 3% per patient year of treatment [32]. In our
In AIH patients, the initial AZA dose was 0.5 mg/kg/day study, only one patient (1.6%) developed leukopenia (Gastroenterology Research and Practice 9
References [15] S. Wright, D. S. Sanders, A. J. Lobo, and L. Lennard, “Clinical
significance of azathioprine active metabolite concentrations
[1] G. B. Elion, “The purine path to chemotherapy,” Science, in inflammatory bowel disease,” Gut, vol. 53, no. 8,
vol. 244, no. 4900, pp. 41–47, 1989. pp. 1123–1128, 2004.
[2] E. Sánchez Rodríguez, R. Ríos León, F. Mesonero Gismero, [16] K. A. Hommel, C. M. Davis, and R. N. Baldassano, “Objective
A. Albillos, and A. Lopez-Sanroman, “Clinical experience of versus subjective assessment of oral medication adherence in
optimising thiopurine use through metabolite measurement pediatric inflammatory bowel disease,” Inflammatory Bowel
in inflammatory bowel disease,” Gastroenterología y Hepatolo- Diseases, vol. 15, no. 4, pp. 589–593, 2009.
gía, vol. 41, no. 10, pp. 629–635, 2018. [17] K. A. Hommel, R. N. Greenley, M. H. Maddux, W. N. Gray,
[3] M. M. Alsous, A. F. Hawwa, C. Imrie et al., “Adherence to aza- and L. M. Mackner, “Self-management in pediatric inflamma-
thioprine/6-mercaptopurine in children and adolescents with tory bowel disease: a clinical report of the North American
inflammatory bowel diseases: a multimethod study,” Cana- Society for Pediatric Gastroenterology, Hepatology, and Nutri-
dian Journal of Gastroenterology & Hepatology, vol. 2020, arti- tion,” Journal of Pediatric Gastroenterology and Nutrition,
cle 9562192, pp. 1–10, 2020. vol. 57, no. 2, pp. 250–257, 2013.
[4] Y. González-Lama and J. P. Gisbert, “Monitoring thiopurine [18] L. J. J. DERIJKS, L. P. L. GILISSEN, P. M. HOOYMANS, and
metabolites in inflammatory bowel disease,” Frontline Gastro- D. W. HOMMES, “Review article: thiopurines in inflamma-
enterol, vol. 7, no. 4, pp. 301–307, 2016. tory bowel disease,” Alimentary Pharmacology & Therapeutics,
[5] A. J. Yarur, B. Gondal, A. Hirsch, B. Christensen, R. D. Cohen, vol. 24, no. 5, pp. 715–729, 2006.
and D. T. Rubin, “Higher thioguanine nucleotide metabolite [19] R. B. Gearry and M. L. Barclay, “Azathioprine and 6-
levels are associated with better long-term outcomes in mercaptopurine pharmacogenetics and metabolite monitoring
patients with inflammatory bowel diseases,” Journal of Clinical in inflammatory bowel disease,” Journal of Gastroenterology
Gastroenterology, vol. 52, no. 6, pp. 537–544, 2018. and Hepatology, vol. 20, no. 8, pp. 1149–1157, 2005.
[6] J. P. Gisbert and F. Gomollón, “Thiopurine-induced myelo- [20] M. C. Dubinsky, S. Lamothe, H. Yang et al., “Pharmacoge-
toxicity in patients with inflammatory bowel disease: a nomics and metabolite measurement for 6-mercaptopurine
review,” The American Journal of Gastroenterology, vol. 103, therapy in inflammatory bowel disease,” Gastroenterology,
no. 7, pp. 1783–1800, 2008, Epub 2008 Jun 28. vol. 118, no. 4, pp. 705–713, 2000.
[7] D. R. Wong, M. J. Coenen, L. J. Derijks et al., “Early prediction [21] M. A. Sheiko, S. S. Sundaram, K. E. Capocelli, Z. Pan, A. M.
of thiopurine-induced hepatotoxicity in inflammatory bowel McCoy, and C. L. Mack, “Outcomes in pediatric autoimmune
disease,” Alimentary Pharmacology & Therapeutics, vol. 45, hepatitis and significance of azathioprine metabolites,” Journal
no. 3, pp. 391–402, 2017, Epub 2016 Dec 12. of Pediatric Gastroenterology and Nutrition, vol. 65, no. 1,
[8] F. M. Ruemmele, G. Veres, K. L. Kolho et al., “Consensus pp. 80–85, 2017.
guidelines of ECCO/ESPGHAN on the medical management [22] T. M. Nguyen, M. Daubard, C. le Gall, M. Larger, A. Lachaux,
of pediatric Crohn's disease,” Journal of Crohn's & Colitis, and R. Boulieu, “Monitoring of azathioprine metabolites in
vol. 8, no. 10, pp. 1179–1207, 2014, Epub 2014 Jun 6. pediatric patients with autoimmune hepatitis,” Therapeutic
[9] D. Turner, F. M. Ruemmele, E. Orlanski-Meyer et al., “Man- Drug Monitoring, vol. 32, no. 4, pp. 433–437, 2010.
agement of paediatric ulcerative colitis, part 1: ambulatory [23] M. N. Lee, B. Kang, S. Y. Choi et al., “Relationship between
care-an evidence-based guideline from European Crohn's azathioprine dosage, 6-thioguanine nucleotide levels, and ther-
and Colitis Organization and European Society of Paediatric apeutic response in pediatric patients with IBD treated with
Gastroenterology, Hepatology and Nutrition,” Journal of Pedi- azathioprine,” Inflammatory Bowel Diseases, vol. 21, no. 5,
atric Gastroenterology and Nutrition, vol. 67, no. 2, pp. 257– pp. 1054–1062, 2015.
291, 2018. [24] K. Pavlovska, M. Petrushevska, K. Gjorgjievska et al., “Impor-
[10] G. Mieli-Vergani, D. Vergani, U. Baumann et al., “Diagnosis tance of 6-thioguanine nucleotide metabolite monitoring in
and management of pediatric autoimmune liver disease: ESP- inflammatory bowel disease patients treated with azathio-
GHAN hepatology committee position statement,” Journal of prine,” Pril (Makedon Akad Nauk Umet Odd Med Nauki).,
Pediatric Gastroenterology and Nutrition, vol. 66, no. 2, vol. 40, no. 1, pp. 73–79, 2019.
pp. 345–360, 2018. [25] M. C. Dubinsky, E. Reyes, J. Ofman, C. F. Chiou, S. Wade, and
[11] J. Y. Chang and J. H. Cheon, “Thiopurine therapy in patients W. J. Sandborn, “A cost-effectiveness analysis of alternative
with inflammatory bowel disease: a focus on metabolism and disease management strategies in patients with Crohn's disease
pharmacogenetics,” Digestive Diseases and Sciences, vol. 64, treated with azathioprine or 6-mercaptopurine,” The Ameri-
no. 9, pp. 2395–2403, 2019, Epub 2019 Jul 9. can Journal of Gastroenterology, vol. 100, no. 10, pp. 2239–
[12] G. Stocco, M. Londero, A. Campanozzi et al., “Usefulness of 2247, 2005.
the measurement of azathioprine metabolites in the assess- [26] R. Walker, J. Kammermeier, R. Vora, and M. Mutalib, “Azathi-
ment of non-adherence,” Journal of Crohn's & Colitis, vol. 4, oprine dosing and metabolite measurement in pediatric
no. 5, pp. 599–602, 2010. inflammatory bowel disease: does one size fit all?,” Annals of
[13] R. S. Bloomfeld and J. E. Onken, “Mercaptopurine metabolite Gastroenterology, vol. 32, no. 4, pp. 387–391, 2019.
results in clinical gastroenterology practice,” Alimentary Phar- [27] P. W. Lowry, C. L. Franklin, A. L. Weaver et al., “Leucopenia
macology & Therapeutics, vol. 17, no. 1, pp. 69–73, 2003. resulting from a drug interaction between azathioprine or 6-
[14] B. BOKEMEYER, A. TEML, C. ROGGEL et al., “Adherence to mercaptopurine and mesalamine, sulphasalazine, or balsala-
thiopurine treatment in out-patients with Crohn's disease,” zide,” Gut, vol. 49, no. 5, pp. 656–664, 2001.
Alimentary Pharmacology & Therapeutics, vol. 26, no. 2, [28] T. Dassopoulos, M. C. Dubinsky, J. L. Bentsen et al., “Rando-
pp. 217–225, 2007. mised clinical trial: individualised vs. weight-based dosing of10 Gastroenterology Research and Practice
azathioprine in Crohn's disease,” Alimentary Pharmacology &
Therapeutics, vol. 39, no. 2, pp. 163–175, 2014.
[29] X. Qian, T. Wang, J. Shen, and Z. Ran, “Low dose of azathio-
prine is effective to induce and maintain remission in active
Crohn disease: a prospective observational study,” Medicine
(Baltimore), vol. 97, no. 34, article e11814, 2018.
[30] J. Wu, Y. Gao, C. Yang, X. Yang, X. Li, and S. Xiao, “Low-dose
azathioprine is effective in maintaining remission among Chi-
nese patients with Crohn's disease,” Journal of Translational
Medicine, vol. 11, no. 1, p. 235, 2013.
[31] T. Hibi, M. Naganuma, T. Kitahora, F. Kinjyo, and
T. Shimoyama, “Low-dose azathioprine is effective and safe
for maintenance of remission in patients with ulcerative coli-
tis,” Journal of Gastroenterology, vol. 38, no. 8, pp. 740–746,
2003.
[32] R. P. Luber, S. Honap, G. Cunningham, and P. M. Irving, “Can
we predict the toxicity and response to thiopurines in inflam-
matory bowel diseases?,” Front Med (Lausanne), vol. 6, p. 279,
2019.
[33] J. Essmann, C. Keil, O. Unruh, A. Otte, M. P. Manns, and
O. Bachmann, “Fecal calprotectin is significantly linked to aza-
thioprine metabolite concentrations in Crohn's disease,” Euro-
pean Journal of Gastroenterology & Hepatology, vol. 31, no. 1,
pp. 99–108, 2019.You can also read