Clinical symptoms, comorbidities and complications features in severe and non-severe patients with COVID-19: a systematic review and meta-analysis ...
←
→
Page content transcription
If your browser does not render page correctly, please read the page content below
Clinical symptoms, comorbidities and
complications features in severe and non-severe
patients with COVID-19: a systematic review and
meta-analysis without cases duplication
Zhufeng Wang
Guangdong Hospital of Traditional Chinese Medicine
Hongsheng Deng ( hs_deng96@126.com )
Guangzhou Medical College First A liated Hospital
Changxing Ou
The rst a liated hospital of Guangzhou Medical University
Jingyi Liang
The rst a liated hospital of Guangzhou Medical University
Yingzhi Wang
The rst a liated hospital of Guangzhou Medical University
Mei Jiang
The rst a liated hospital of Guangzhou Medical University
Shiyue Li
The rst a liated hospital of Guangzhou Medical University
Research
Keywords: Coronavirus Disease 2019 (COVID-19), Severe, Meta-analysis
DOI: https://doi.org/10.21203/rs.3.rs-30787/v1
License: This work is licensed under a Creative Commons Attribution 4.0 International License.
Read Full License
Page 1/22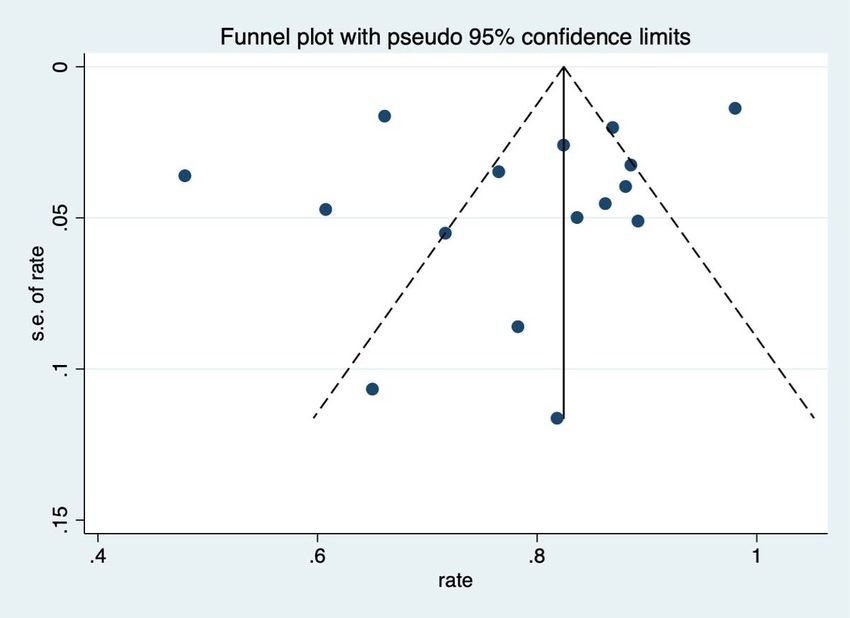
Abstract
Background: The pandemic of COVID-19 posed a challenge to global healthcare. The mortality rates of
severe cases range from 8.1% to 31.8%, and it is particularly important to identify risk factors that
aggravate the disease.

Methods: We performed a systematic review of the literature with meta-analysis, using 7 databases to
assess clinical characteristics, comorbidities and complications in severe and non-severe patients with
COVID-19. All the observational studies were included. We performed a random or xed effects model
meta-analysis to calculate the pooled proportion and 95% CI. Measure of heterogeneity was estimated by
Cochran’s Q statistic, I2 index and P value.

Results: 4881 cases from 25 studies related to COVID-19 were included. The most prevalent comorbidity
was hypertension (severe: 33.4%, 95% CI: 25.4% - 41.4%; non-severe 21.6%, 95% CI: 9.9% - 33.3%),
followed by diabetes (severe: 14.4%, 95% CI: 11.5% - 17.3%; non-severe: 8.5%, 95% CI: 6.1% - 11.0%). The
prevalence of ARDS, AKI and shock were all higher in severe cases, with 41.1% (95% CI: 14.1% - 68.2%),
16.4% (95% CI: 3.4% - 29.5%) and 19.9% (95% CI: 5.5% - 34.4%), rather than 3.0% (95% CI: 0.6% - 5.5%),
2.2% (95% CI: 0.1% - 4.2%) and 4.1% (95% CI -4.8% - 13.1%) in non-severe patients, respectively. The death
rate was higher in severe cases (30.3%, 95% CI: 13.8% - 46.8%) than non-severe cases (1.5%, 95% CI: 0.1%
- 2.8%).

Conclusions: Hypertension, diabetes and cardiovascular diseases may be risk factors for COVID-19
patients to develop into severe cases.

Background
Since the end of 2019, there's been a surge in cases of COVID-19 with 153517 laboratory-con rmed cases
and 5735 death as of March 15th. COVID-19 exerted an adverse in uence on globally, especially
increasing the burden of healthcare. According to latest report[1-3], mortality rates of severe
cases(8.1%-31.8%) is signi cantly higher than general estimation of WHO (2.9%)[4]. Severe patients often
have dyspnea or hypoxemia one week after onset, which may rapidly progress to acute respiratory
distress syndrome (ARDS), septic shock, metabolic acidosis that is di cult to correct, and coagulation
dysfunction. Therefore, it’s critical to reveal early risk factors of severe cases under the circumstance of
wide-spread outbreak, which is helpful for precise treatment and prognosis improvement. Notably,
previous studies have clari ed that patients particularly vulnerable to severe disease are those with pre-
existing medical conditions such as diabetes, cardiovascular diseases, renal failure, obesity, and
immunode ciency[5, 6]. Wang et al. reported 138 cases of COVID-19 and the result indicated that almost
half of hospitalized patients had comorbidities, and patients admitted to ICU with comorbidities was
twice as high as without comorbidities[2]. To sum up, evaluating the prevalence of underlying diseases is
fundamental to mitigate COVID-19 complications. However, this effort has been hindered by the limited
number of cases and confounding classi cation in pre-exist studies.

                                                  Page 2/22
The present study was undertaken to provide a systematic evaluation without cases duplication to
compare the prevalence of demographic, comorbidities, symptoms, complications and outcomes
between severe and non-severe COVID-19 cases. This assessment may aid the public health sector while
developing policies for surveillance and response to COVID-19 and its severe outcomes.
Aims
The followings are the aims of the study:
To demonstrate the differences in the eld of demographic, comorbidities, clinical symptoms,
complications and outcomes between severe and non-severe patients with COVID-19.
To gure out the risk factor of conversion to severe.
Methods
We registered the study protocol with PROSPERO (registration number ID: CRD42020177414)
(Supplemental material: study protocol).
Search strategy
We searched PubMed, Web of Science, Cochrane Library, CBM (Chinese Biomedical), CNKI (China
National Knowledge Infrastructure), WanFang, and VIP databases up to March 16, 2020. The search
terms were used as follows: “Wuhan coronavirus” OR “COVID-19” OR “novel coronavirus” OR “2019-
nCoV” OR “coronavirus disease” OR “SARS-CoV-2” OR “SARS2” OR “severe acute respiratory syndrome
coronavirus 2”; the full search strategy is shown in Supplemental material: search strategy. The search
was limited to English and Chinese language. We hand-searched included papers’ reference lists and
contacted experts in the eld to ensure a comprehensive review.
Inclusion and exclusion criteria
We included studies which:
Examined laboratory-con rmed patients with COVID-19.
Examined the demographic, early comorbidities, clinical symptoms, complications, and outcomes of
severe and (or) non-severe patients with COVID-19.
Reported mean ± SDs or proportion and 95% con dence interval (95% CI) of these factors.
Observational studies.
We excluded papers which:
Did not contribute to any conducted factors of this study. (We will include the maximum sample size
of the same hospital according to speci c indicators. If the article does not contribute to all
Page 3/22indicators of this study, it will be excluded even if it meets all inclusion criteria, so as to avoid the
duplication of sample size.)
Did not provide full-text.
Did not publish in neither English nor Chinese.
Screening papers
After excluding duplicate papers, one researcher (ZW) screened the titles and abstracts using the
eligibility criteria. Then two researchers (HD, CO) assessed the rest full-text articles for eligibility. The
Kappa value for study inclusion between them was 0.82, which showed strong consistency. Consensus
on the inclusion of all studies was agreed by two researchers (HD, CO) with any disagreements resolved
in a discussion with researcher (ZW).
Data Extraction and synthesis
Where available, the following information from each article was extracted using a standardized data
extracted form: title, study design, study period, location, rst author, publication year, sample size, sex
distribution, any comorbidities, clinical symptoms, complications.
We extracted the counting data as the number of occurrences of an event versus the total number of
people reported for that event (n/N). Additionally, we used the mean and standard deviation (SD), or
median and interquartile range (IQR) (or median and range), to record the measurement data.
Data analysis
Quality assessment and analysis
Two researchers (CO, HD) assessed the risk of bias in individual papers using the Newcastle-Ottawa
Scale (NOS) for assessing the quality of cohort studies and case-control studies[7]. This considered the
domains of selection, comparability and ascertainment of the outcome of interest. A study with a score
of 0-3, 4-6 and 7-9 was considered as poor, intermediate and high quality, respectively. The Weighted
Kappa value was 0.67 on quality rating criteria, and consensus was reached through discussion in cases
of disagreement on individual rating criteria.
Statistical analysis
All analyses were conducted using STATA Version 15. Unit discordance for variables will be resolved by
converting all units to a standard measurement for that variable. We conducted analyses by severity
(severe vs non-severe). We used a random-effects model or a xed-effects model to calculate the pooled
proportion or mean and 95% con dence interval (95% CI) of all reported variables. All P values were
based on two-sided tests and were considered statistically signi cant at Psubstantial heterogeneity. Publication bias was checked by visual inspection of funnel plots and tested
using Egger’s test when ten or more studies reported the variable, and the Egger test with P < 0.05 was
considered to be an indication of substantial publication bias.
Results
We extracted data from 25 studies reported COVID-19 cases between December, 2019 and February, 2020
(Table 1), including a total of 4881 laboratory-con rmed patients with COVID-19. The Preferred Reporting
Items for Systematic Review and Meta-Analysis (PRISMA) diagram (Fig.1) describes the results of the
search and reasons for excluding studies. All included studies were from hospitals in China mainland,
with 12 from Hubei, 4 from Chongqing, 3 from Beijing and 1 each from Anhui, Henan, Hunan, Shanxi,
Liaoning and Wenzhou. Publication bias was assessed with a funnel plot for the standard error by logit
event, with no evidence of bias (Fig.2). Additionally, the Egger test (P=0.312) suggested that there was no
notable evidence of publication bias. We analyzed 20 variables for the meta-analysis, the following
results were all presented in detail in Table 2.
Comparison on demographic
The average age was higher in severe cases as compared with non-severe cases (48.5 vs. 38.5, P< 0.10;
P=0.01). The sex ratio (male to female) was 1.33 in severe cases and 0.95 in non-severe cases. Being
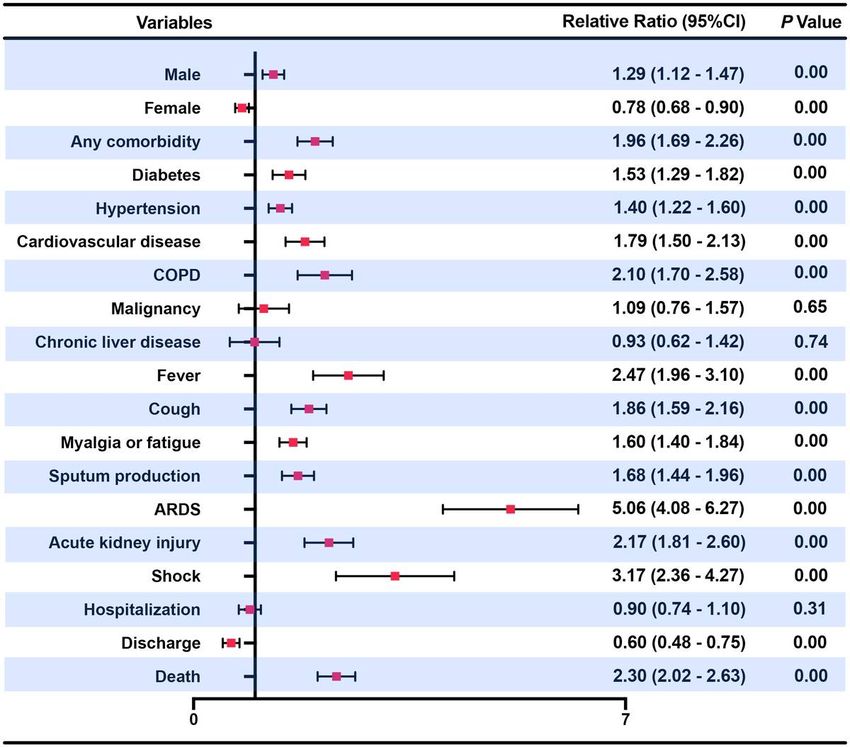
aged or male were considered as risk factors to severe COVID-19 (RR=1.29, 95% CI: 1.12 - 1.47). ( Figure 3
)
Comparison in comorbidities
Prevalence of comorbidity in severe cases was remarkably higher in severe cases (58.4%, 95% CI: 48.8% -
67.9%) than non-severe cases (27.6%, 95% CI: 18.6% - 36.6%) (P=0.00). Meta-analysis showed that in
both groups, the most prevalent comorbidity was hypertension (severe case: 33.4%, 95% CI: 25.4% -
41.4%; non-severe cases:21.6%, 95% CI: 9.9% - 33.3%; P=0.00), followed by diabetes (severe case:14.4%,
95% CI: 11.5% - 17.3%; non-severe cases: 8.5%, 95% CI: 6.1% - 11.0%; P=0.00). With any comorbidity
(RR=1.96, 95% CI: 1.69 – 2.26), especially diabetes (RR=1.53, 95% CI: 1.29 - 1.82), hypertension (RR=1.40,
95% CI: 1.22 - 1.60), cardiovascular disease (RR=1.79, 95% CI: 1.50 – 2.13) and COPD (RR=2.10, 95% CI:
1.70 – 2.58) were considered as risk factors to severe COVID-19. ( Figure 3 )
Comparison on clinical symptoms
Both in severe and non-severe case, the most common clinical symptom was fever (severe: 90.0%, 95%
CI: 86.7% - 93.3%; non-severe: 78.4%, 95% CI: 70.7% - 86.2%; P=0.00), followed by cough (severe: 69.0%,
95% CI: 60.4% - 77.5%; non-severe: 54.2%, 95% CI: 47.0% - 61.5%; P=0.00). Myalgia or fatigue (severe:
36.7%, 95% CI: 25.5% - 48.0%; non-severe: 28.8%, 95% CI: 20.2% - 37.4%; P=0.00) and sputum production
(severe: 37.3%, 95% CI: 23.3% - 51.3%; non-severe: 23.3%, 95% CI: 18.4% - 28.1%; P=0.00) were almost
Page 5/22equally prevalent in two groups. The overall proportion of clinical symptoms was about 10%-15% higher
in severe patients (RR: 1.60~2.47). ( Figure 3 )
Comparison on complications
Severe cases have signi cantly higher prevalence as compared with control group for ARDS (41.1% vs.
3.0%, P=0.00), AKI (16.4% vs. 2.2%, P=0.00), shock (19.9% vs. 4.1%, P=0.00). ARDS (RR=5.06, 95% CI:
4.08 – 6.27), AKI (RR=2.17, 95% CI: 1.81 – 2.60) and shock (RR=3.17, 95% CI: 2.36 – 4.27) were all risk
factors to severe COVID-19. ( Figure 3 )
Comparison on outcomes
The mortality was obviously higher in severe cases than non-severe cases (30.3% vs. 1.5%, P=0.00).
Severe patients were 2.30 times more likely to die than non-severe patients (RR=2.30, 95% CI: 2.02 –
2.63). ( Figure 3 )
Discussion
This is the rst meta-analysis that avoids the phenomenon of included cases duplication, which
compares severe and non-severe COVID-19 in the eld of demographic features, clinical symptoms
comorbidities, complications and outcomes. Based on 4881 laboratory-con rmed cases with COVID-19 in
mainland China from 25 studies, we found that being male was more susceptible to severe COVID-19. In
terms of comorbidities, patients combining diabetes, hypertension, cardiovascular disease and COPD
were more likely to develop severe COVID-19, which was consistent with the ndings of Guan Wei-jie et al.
to some degree[31]. Fever and cough were the main clinical symptoms in both severe and non-severe
cases, which was consistent with previous studies[1, 2, 32] . As for complications, ARDS, AKI or shock
were much more likely to observed in severe cases, which was in accordance with the nding on MERS-
CoV[6, 33]. The death rate of severe cases was obviously higher than the WHO estimates as 2.90%, while
it was lower in non-severe cases.
Based on results of clinical symptoms, we found that a signi cant difference between severe and non-
severe patients with COVID-19 on overall factors. But in clinical practice, it is di cult to conclude whether
a patient is more likely to develop severe or non-severe COVID-19 based on such clinical symptoms.
Nonetheless, clinical symptoms are undoubtedly essential for susceptible cases screening.
According to our analysis results on comorbidities, severe patients used to be with comorbidities on
admission especially as diabetes, hypertension and cardiovascular disease, which could affect some key
mediators of the host's innate immune response[33]. Previous ndings on MERS-CoV also found that
people with severe illness were more likely to combine these underlying comorbidities[33]. This can be
explained by the phenomenon of cytokine storm that a variety of cytokines gather in the body uids. Early
studies of MERS-CoV found that the amount of Th1/Th2 cytokines pro le was higher in patients with
diabetes, hypertension or cardiovascular disease which was linked with exacerbation of pro-in ammatory
Page 6/22state and generation of oxidative stress[17, 34-38]. Studies have shown that cytokine storm indicate poor
prognosis and tissue damage[10] . So far in COVID-19 patients, research has shown that ICU patients had
higher plasma levels of IL-2, IL-7, IL-10, GSCF, IP10, MCP1, MIP1A, and TNF-α compared with non-ICU
patients[1].
Considering that these cytokines mainly belong to Th1 or Th2 subgroups, we infer that patients with
comorbidities, especially those with diabetes, hypertension or cardiovascular disease, are more likely to
develop severe COVID-19. Therefore, we suggest that clinicians can pay more attention to patients with
comorbidities, which may prevent the development of severe COVID-19 and its progressive complications
with suitable care.
Also, it is believed that cytokine storm is also an important cause of ARDS and multiple organ failure in
patients with viral infections[39, 40].
Therefore, we believed that patients combined with diabetes, hypertension or cardiovascular disease were
more likely to develop progressive complications, which was fatal and di cult to cure.
As mentioned on complications of severe and non-severe patients, we found that the incidence of ARDS,
AKI and shock were remarkably higher in severe patients. This was also consistent with the conclusion of
previous research that secondary pneumonia, ARDS, encephalitis, myocarditis and other fatal
complications could occur in severe patients[6, 33]. These severe clinical manifestations caused by the
underlying comorbidities can also be seen in other respiratory diseases such as in uenza and in uenza
H1N1[32, 39, 41]. With evaluating the occurrence of complications induced by SARS-CoV-2 infection, it
helps us fully understand the adverse impact and disease burden of severe COVID-19.
In general, guring out differences on comorbidities, clinical symptoms and complications between
severe and non-severe patients may serves as the superb way to effectively prevent patients who are non-
severe but combined comorbidities from developing severe COVID-19. Besides, due to the similarity
between COVID-19 with SARS and MERS to a certain extent, we could draw some experience in the
previous studies of SARS and MERS while comparing with the studies of COVID-19 as well. We hope that
this assessment may aid the public health sector while developing policies for surveillance and response
to COVID-19 and its severe outcomes. Also, we hope that it may aid the development of vaccination for
those vulnerable people.
Strengths And Limitations
We followed the PRISMA procedure in this meta-analysis for medical evidence searching. For the sake of
data sources from each literature, we excluded the potential repeated cases from the same hospital or
region according to every speci c variable which we are about to conduct, avoiding to amplify the false
effect of some factors by including many duplicate cases.
Page 7/22There are still some limitations in this study. First, all the included studies are conducted in mainland
China, so the outcomes may not be suitable for the international situation at present. Second, there were
some differences in the proportion of diabetes, hypertension or cardiovascular diseases between the
studies, which may be a source of heterogeneity.
But these results can play a certain reference value and alert role for future epidemic prevention and
treatment measures.
Conclusion
There is a signi cant difference between severe and non-severe patients with COVID-19 in terms of
demographic features, clinical symptoms, comorbidities, complications and outcomes. Hypertension,
diabetes and cardiovascular diseases may be risk factors for COVID-19 patients to develop into severe
cases.
Abbreviations
COVID-19: corona virus disease 2019
SARS : severe acute respiratory syndrome
MERS-CoV: middle east respiratory syndrome coronavirus
WHO: world health organization
SD: standard deviation
IQR: interquartile range
CI: con dence interval
RR: relative risk
ARDS: acute respiratory distress syndrome
AKI: acute kidney injury
Declarations
Ethics approval and consent to participate
No ethical approval was required for this systematic review of existing published literature.
Consent for publication
Page 8/22Not applicable.
Competing interests
The authors declare that they have no competing interests.
Funding
None.
Authors' contributions
Conception and design: Mei Jiang, Shiyue Li, Zhufeng Wang, Yingzhi Wang; (II) Administrative support:
Mei Jiang, Shiyue Li; (III) Collection and assembly of data: Zhufeng Wang, Hongsheng Deng, Changxing
Ou and Jingyi Liang; (V) Data analysis and interpretation: Zhufeng Wang, Hongsheng Deng, Changxing
Ou and Yingzhi Wang; (VI) Manuscript writing: All authors; (VII) All authors have read and approved the
manuscript.
Acknowledgements
Not applicable.
References
1. Huang C, Wang Y, Li X, Ren L, Zhao J, Hu Y, Zhang L, Fan G, Xu J, Gu X et al: Clinical features of
patients infected with 2019 novel coronavirus in Wuhan, China. Lancet (London, England) 2020,
395(10223):497-506.
2. Wang D, Hu B, Hu C, Zhu F, Liu X, Zhang J, Wang B, Xiang H, Cheng Z, Xiong Y et al: Clinical
Characteristics of 138 Hospitalized Patients With 2019 Novel Coronavirus-Infected Pneumonia in
Wuhan, China. Jama 2020.
3. Guan WJ, Ni ZY, Hu Y, Liang WH, Ou CQ, He JX, Liu L, Shan H, Lei CL, Hui DSC et al: Clinical
Characteristics of Coronavirus Disease 2019 in China. The New England journal of medicine 2020.
4. Batlle D, Wysocki J, Satchell K: Soluble angiotensin-converting enzyme 2: a potential approach for
coronavirus infection therapy? Clinical science (London, England : 1979) 2020, 134(5):543-545.
5. Al-Taw q JA, Hinedi K, Ghandour J, Khairalla H, Musleh S, Ujayli A, Memish ZA: Middle East
respiratory syndrome coronavirus: a case-control study of hospitalized patients. Clinical infectious
diseases : an o cial publication of the Infectious Diseases Society of America 2014, 59(2):160-165.
6. Assiri A, Al-Taw q JA, Al-Rabeeah AA, Al-Rabiah FA, Al-Hajjar S, Al-Barrak A, Flemban H, Al-Nassir WN,
Balkhy HH, Al-Hakeem RF et al: Epidemiological, demographic, and clinical characteristics of 47
cases of Middle East respiratory syndrome coronavirus disease from Saudi Arabia: a descriptive
study. The Lancet Infectious diseases 2013, 13(9):752-761.
Page 9/227. Wells G, Shea B, O'Connell J: The Newcastle-Ottawa Scale (NOS) for Assessing The Quality of
Nonrandomised Studies in Meta-analyses. Ottawa Health Research Institute Web site 2014, 7.
8. Cheng K, Wei M, Shen H, Wu C, Chen D, Xiong W, Zhou X, Zhang D, Zheng J,: Clinical characteristics
of 463 patients with normal and severe COVID-19 rehabilitation. Shanghai Medical Journal 2020.
9. Yang X, Yu Y, Xu J, Shu H, Xia J, Liu H, Wu Y, Zhang L, Yu Z, Fang M et al: Clinical course and
outcomes of critically ill patients with SARS-CoV-2 pneumonia in Wuhan, China: a single-centered,
retrospective, observational study. The Lancet Respiratory medicine 2020.
10. Xu S, Hu H, Hu Y, Shui H: Clinical features of 62 cases of critical COVID-19 with acute renal injury.
Medical Journal of Wuhan University 2020.
11. Bai P, He W, Zhang X, Jin J, Liu S: Clinical characteristics of 58 patients with severe and critical
COVID 19 . Chin J Emerg Med 2020, 29.
12. Peng YD, Meng K, Guan HQ, Leng L, Zhu RR, Wang BY, He MA, Cheng LX, Huang K, Zeng QT: Clinical
characteristics and outcomes of 112 cardiovascular disease patients infected by 2019-nCoV. Chin J
Cardiol 2020, 48(0):E004-E004.
13. Wen K, Li W, Zhang D, Zhang A, Zhang T, Zhao P, Qin E: Epidemiological and clinical characteristics
of 46 COVID - 19 patients in Beijing. Chinese Journal of Infectious Diseases 2020, 38.
14. Xu YH, Dong JH, An WM, Lv XY, Yin XP, Zhang JZ, Dong L, Ma X, Zhang HJ, Gao BL: Clinical and
computed tomographic imaging features of novel coronavirus pneumonia caused by SARS-CoV-2.
The Journal of infection 2020, 80(4):394-400.
15. Wan Q, Shi A, He T, Tang L: Clinical characteristics of 153 cases infected with COVID - 19 in
Chongqing area.Chin J Clin Infect Dis 2020, 13.
16. Yuan J, Sun Y, Zuo Y, Chen T, Cao Q, Yuan G, Yang M, Zhang W, Peng A, Chen Y: Clinical
characteristics of 153 cases infected with COVID - 19 in Chongqing area. Journal of Southwest
University(Natural Science Edition) 2020.1-7.
17. Xiong J, Jiang W, Zhou Q, Hu X, Liu C: Clinical characteristics, treatment and prognosis of 89 patients
with COVID-19. Medical Journal of Wuhan University 2020.
18. Lu Z, He R, Jiang W, Fan C, Geng Q: Analysis of clinical characteristics and immune function of
COVID‐19 patients. Medical Journal of Wuhan University 2020.
19. Fang X, Mei Q, Yang T, Zhang L, Yang Y, Wang Y, Tong F, Ye C, Gao Y, Huang Y et al: Clinical features
and treatment of 79 cases infected by COVID-19. Chinese Pharmacological Bulletin 2020, 36.
20. Xiao K, Shui L, Pang X, Mou H, Wang J, Lang C, Lv J, Sun K, Li W, Chen Y: Analysis of clinical
characteristics of 143 patients with COVID-19 in northeast Chongqing. Journal of Third Military
Medical University 2020.
21. Li K, Wu J, Wu F, Guo D, Chen L, Fang Z, Li C: The Clinical and Chest CT Features Associated with
Severe and Critical COVID-19 Pneumonia. Investigative radiology 2020.
22. Cheng J, Huang C, Zhang G, Liu D, Li P, Lu C, Li J: Epidemiological characteristics of COVID-19 in
Henan province. Chinese Journal of Tuberculosis and Respiratory Diseases 2020, 43.
Page 10/2223. Dai Z, Gao L, Luo K, Xiao J, Huang C, Zeng K, Liu Z, Zhao S, Yang H, Sun Q et al: Analysis of clinical
characteristics of COVID-19 in Hunan province. Practical Preventive Medicine 2020, 27.
24. Gao T, He X, Su H, Zheng H, Jiang Y, Chen J, Xu X: Clinical characteristics of COVID-19 in 11 cases.
Chinese Journal of Infectious Diseases 2020, 13.
25. Li D, Liu H, Wang Y, Guo H, Wang Y, Wang K, Zhao R, Wu Y, Li X: Clinical characteristics of COVID-19
in 30 cases. Chin J Infect 2020, 38.
26. Chen C, Chen C, Yan J, Zhou N, Zhao J, Wang D: Analysis of myocardial injury and cardiovascular
disease in critically ill patients with COVID-19. Chin J Cardiol 2020, 48.
27. Tian S, Hu N, Lou J, Chen K, Kang X, Xiang Z, Chen H, Wang D, Liu N, Liu D et al: Characteristics of
COVID-19 infection in Beijing. The Journal of infection 2020, 80(4):401-406.
28. Zhang JJ, Dong X, Cao YY, Yuan YD, Yang YB, Yan YQ, Akdis CA, Gao YD: Clinical characteristics of
140 patients infected with SARS-CoV-2 in Wuhan, China. Allergy 2020.
29. Chen M, An W, Xia F, Yang P, Liao Y, Fang S, Xu X, Zhang M: Retrospective analysis of case data of
COVID-19 patients with different clinical type. Herald of Medicine 2020.
30. Yang W, Cao Q, Qin L, Wang X, Cheng Z, Pan A, Dai J, Sun Q, Zhao F, Qu J et al: Clinical
characteristics and imaging manifestations of the 2019 novel coronavirus disease (COVID-19):A
multi-center study in Wenzhou city, Zhejiang, China. The Journal of infection 2020, 80(4):388-393.
31. Guan WJ, Liang WH, Zhao Y, Liang HR, Chen ZS, Li YM, Liu XQ, Chen RC, Tang CL, Wang T et al:
Comorbidity and its impact on 1590 patients with Covid-19 in China: A Nationwide Analysis. The
European respiratory journal 2020.
32. Akbar DH: Bacterial pneumonia: comparison between diabetics and non-diabetics. Acta
diabetologica 2001, 38(2):77-82.
33. Badawi A, Ryoo SG: Prevalence of comorbidities in the Middle East respiratory syndrome coronavirus
(MERS-CoV): a systematic review and meta-analysis. International journal of infectious diseases :
IJID : o cial publication of the International Society for Infectious Diseases 2016, 49:129-133.
34. Mahlangu T, Dludla PV, Nyambuya TM, Mxinwa V, Mazibuko-Mbeje SE, Cirilli I, Marcheggiani F, Tiano
L, Louw J, Nkambule BB: A systematic review on the functional role of Th1/Th2 cytokines in type 2
diabetes and related metabolic complications. Cytokine 2020, 126:154892.
35. Al-Shukaili A, Al-Ghafri S, Al-Marhoobi S, Al-Abri S, Al-Lawati J, Al-Maskari M: Analysis of
in ammatory mediators in type 2 diabetes patients. International journal of endocrinology 2013,
2013:976810.
36. Limonta D, Torres G, Capo V, Guzman MG: Apoptosis, vascular leakage and increased risk of severe
dengue in a type 2 diabetes mellitus patient. Diabetes & vascular disease research 2008, 5(3):213-
214.
37. Kaviarasan K, Jithu M, Arif Mulla M, Sharma T, Sivasankar S, Das UN, Angayarkanni N: Low blood
and vitreal BDNF, LXA4 and altered Th1/Th2 cytokine balance are potential risk factors for diabetic
retinopathy. Metabolism: clinical and experimental 2015, 64(9):958-966.
Page 11/2238. Dharmashankar K, Widlansky ME: Vascular endothelial function and hypertension: insights and
directions. Current hypertension reports 2010, 12(6):448-455.
39. Mertz D, Kim TH, Johnstone J, Lam PP, Science M, Kuster SP, Fadel SA, Tran D, Fernandez E,
Bhatnagar N et al: Populations at risk for severe or complicated in uenza illness: systematic review
and meta-analysis. BMJ (Clinical research ed) 2013, 347:f5061.
40. Gupta DL, Bhoi S, Mohan T, Galwnkar S, Rao DN: Coexistence of Th1/Th2 and Th17/Treg
imbalances in patients with post traumatic sepsis. Cytokine 2016, 88:214-221.
41. Kusznierz G, Uboldi A, Sosa G, Torales S, Colombo J, Moyano C, Escobar H, Lejona S, Anchart E,
Gomez A et al: Clinical features of the hospitalized patients with 2009 pandemic in uenza A (H1N1)
in Santa Fe, Argentina. In uenza and other respiratory viruses 2013, 7(3):410-417.
Tables
Table 1. Description of 25 studies retrieved from systematic search
PLA People’s Liberation Ar
Table 2. Meta-analysis Results
Page 12/22First Authour Year Location Study Design Number of Study period Quality score
Patients
Chaolin 2020 Wuhan, China prospective 41 By Jan. 2, 7
Huang[1] (Jin-Yintan study 2020
hospital)
Cheng 2020 Wuhan, China retrospective 463 By Feb. 6, 5
Kebin[2] (Jin-Yintan study 2020
hospital)
Xiaobo 2020 Wuhan, China retrospective 52 Dec. 2019 to 6
Yang[3] (Jin-Yintan study Jan. 26, 2020
hospital)
Xu Shen[4] 2020 Wuhan, China retrospective 62 Jan. 8, 2020 5
(Zhongnan study to Feb. 24,
hospital) 2020
Dawei 2020 Wuhan, China retrospective 138 Jan. 1, 2020 7
Wang[5] (Zhongnan study to Jan. 28,
hospital) 2020
Bai Peng[6] 2020 Wuhan, retrospective 58 Jan. 29, 2020 6
China Xiehe study to Feb. 26,
hospital) 2020
Peng 2020 Wuhan, retrospective 112 Jan. 20, 2020 5
Yudong[7] China Xiehe study to Feb. 15,
hospital) 2020
Wen Ke[8] 2020 Beijing, China retrospective 46 Jan. 20, 2020 4
(The Fifth study to Feb. 8,
Medical 2020
Center of
Chinese PLA
General
Hospital)
Yuhuan Xu[9] 2020 Beijing, China retrospective 59 Jan. 2020 to 5
(The Fifth study Feb. 2020
Medical
Center of
Chinese PLA
General
Hospital)
Wan Qiu[10] 2020 Chongqing, retrospective 153 Jan. 26, 2020 5
China study to Feb. 5,
(Treatment 2020
center)
Yuan Jing[11] 2020 Chongqing, retrospective 223 Jan. 24, 2020 6
China study to Feb. 23,
(Treatment 2020
center)
Xiong 2020 Wuhan, China retrospective 89 Jan. 17, 2020 6
Juan[12] (Renmin study to Feb. 20,
Hospital of 2020
Wuhan
University)
Lu Zilong[13] 2020 Wuhan, China retrospective 101 Jan. 15, 2020 4
(Renmin study to Feb. 15,
Hospital of 2020
Wuhan
University)
Fang 2020 Anhui, China retrospective 79 Jan. 22, 2020 5
Xiaowei[14] study to Feb. 18,
2020
Page 13/22Xiao 2020 Chongqing, retrospective 143 Jan. 23, 2020 4
Kaihu[15] China (San- study to Feb. 8,
Xia hospital) 2020
Kunhua Li[16] 2020 Chongqing, retrospective 83 Jan. 2020 to 5
China (the study Feb. 2020
Second
Affiliated
Hospital of
Chongqing
Medical
University)
Cheng 2020 Henan, China cross sectional 1265 By Feb. 19, 3
Jiuling[17] 2020
Dai Zhihui[18] 2020 Hunan, China retrospective 918 Jan. 21, 2020 4
study to Feb. 13,
2020
Gao Ting[19] 2020 Shanxi, China retrospective 11 Jan. 20, 2020 5
(Xianyang study to Feb. 15,
central 2020
hospital)
Li Dan[20] 2020 Liaoning, retrospective 30 Jan. 22, 2020 6
China study to Feb. 8,
2020
Chen 2020 Wuhan, China retrospective 150 Jan. 2020 to 5
Chen[21] (Tongji study Feb. 2020
hospital)
SiJia Tian[22] 2020 Beijing, China retrospective 262 By Feb. 10, 5
(Emergency study 2020
center)
Jin-jin 2020 Wuhan, China retrospective 140 Jan. 16, 2020 5
Zhang[23] (No.7 hospital study to Feb. 3,
of Wuhan) 2020
Chen Min[24] 2020 Hubei, China retrospective 54 Jan. 24, 2020 6
(the third study to Feb. 8,
Renmin 2020
hospital of
Jianghan
university)
Wenjie 2020 Wenzhou, retrospective 149 Jan. 17, 2020 6
Yang[25] China study to Feb. 10,
2020
Page 14/22Mea
n (y- Test for subgroup
old)/ Heterogeneity differences
Prev
alenc
e, RR
Varia Grou even (95% (95% P val
ble p number t n CI) Q I2 P value CI) ue
Age severe 14 - 599 48.5 823. 98.4 0.00 - 0.01
(42.7 14 %
-
54.4)
non-severe 15 - 1586 38.5 2530 99.4 0.00
(34.3 .23 %
-
42.6)
Male severe 14 351 613 57.8 13.2 1.7% 0.43 1.29 (1.12 - 0.00
% 2 1.47)
(53.9
%-
61.6
%)
non-severe 15 778 1600 48.2 26.9 48.0 0.02
% 5 %
(44.6
%-
51.8
%)
Fem severe 14 263 613 42.4 13.5 3.7% 0.41 0.78 (0.68 - 0.00
ale % 0 0.90)
(38.5
%-
46.2
%)
non-severe 15 822 1600 51.8 26.9 48.0 0.02
% 5 %
(48.2
%-
55.4
%)
Any severe 9 281 500 58.4 36.9 78.3 0.00 1.96 (1.69 - 0.00
como % 5 % 2.26)
rbidi (48.8
ty %-
67.9
%)
non-severe 10 337 1061 27.6 100. 91.0 0.00
% 21 %
(18.6
%-
36.6
%)
Diab severe 12 85 551 14.4 9.05 0.0% 0.62 1.53 (1.29 - 0.00
etes % 1.82)
(11.5
%-
17.3
%)
non-severe 12 100 1189 8.5% 19.8 49.6 0.03
(6.1 5 %
%-
11.0
%)
Hype severe 13 188 569 33.4 45.1 75.6 0.00 1.40 (1.22 - 0.00
rtens % 6 % 1.60)
ion (25.4
%-
Page 15/2241.4
%)
non-severe 13 277 1212 21.6 410. 97.1 0.00
% 13 %
(9.9
%-
33.3
%)
Card severe 12 56 521 10.4 19.0 47.5 0.04 1.79 (1.50 - 0.00
iovas % 3 % 2.13)
cular (6.4
disea %-
se 14.4
%)
non-severe 6 33 891 3.3% 20.0 75.0 0.00
(1.1 2 %
%-
5.4%
)
COP severe 8 31 413 6.8% 5.73 0.0% 0.45 2.10 (1.70 - 0.00
D (4.3 2.58)
%-
9.2%
)
non-severe 7 13 769 1.8% 1.38 0.0% 0.85
(0.8
%-
2.9%
)
Mali severe 6 17 388 3.5% 4.89 18.3 0.30 1.09 (0.76 - 0.65
gnan (1.6 % 1.57)
cy %-
5.4%
)
non-severe 5 22 579 3.7% 10.8 63.0 0.03
(0.9 2 %
%-
6.4%
)
Chro severe 7 16 423 3.5% 2.17 0.0% 0.83 0.93 (0.62 - 0.74
nic (1.7 1.42)
liver %-
disea 5.3%
se )
non-severe 8 37 889 3.8% 5.81 0.0% 0.45
(2.5
%-
5.1%
)
Feve severe 14 600 672 90.0 23.3 48.5 0.03 2.47 (1.96 - 0.00
r % 1 % 3.10)
(86.7
%-
93.3
%)
non-severe 16 1711 2323 78.4 364. 95.9 0.00
% 59 %
(70.7
%-
86.2
%)
Coug severe 14 454 646 69.0 82.5 84.3 0.00 1.86 (1.59 - 0.00
h % 5 % 2.16)
(60.4
%-
77.5
%)
non-severe 16 1204 2314 54.2 164. 90.9 0.00
% 90 %
Page 16/22(47.0
%-
61.5
%)
Myal severe 13 220 652 36.7 130. 90.8 0.00 1.60 (1.40 - 0.00
gia % 41 % 1.84)
or (25.5
fatig %-
ue 48.0
%)
non-severe 15 476 2234 28.8 416. 96.6 0.00
% 18 %
(20.2
%-
37.4
%)
Sput severe 9 192 492 37.3 88.9 91.0 0.00 1.68 (1.44 - 0.00
um % 4 % 1.96)
prod (23.3
uctio %-
n 51.3
%)
non-severe 9 420 1723 23.3 35.2 77.3 0.00
% 0 %
(18.4
%-
28.1
%)
ARD severe 4 67 144 41.1 43.5 93.1 0.00 5.06 (4.08 - 0.00
S % 4 % 6.27)
(14.1
%-
68.2
%)
non-severe 5 7 360 3.0% 1.37 0.0% 0.50
(0.6
%-
5.5%
)
Acut severe 4 36 170 16.4 21.5 86.1 0.00 2.17 (1.81 - 0.00
e % 6 % 2.60)
kidne (3.4
y %-
injur 29.5
y %)
non-severe 4 6 211 2.2% 2.23 10.2 0.33
(0.1 %
%-
4.2%
)
Shoc severe 3 17 80 19.9 5.29 62.2 0.07 3.17 (2.36 - 0.00
k % % 4.27)
(5.5
%-
34.4
%)
non-severe 3 4 188 4.1% 2.70 62.9 0.10
(-4.8 %
%-
13.1
%)
Hosp severe 7 149 295 53.9 109. 94.5 0.00 0.90 (0.74 - 0.31
italiz % 43 % 1.10)
ation (32.6
%-
75.3
%)
non-severe 7 439 814 48.9 245. 97.6 0.00
% 86 %
Page 17/22(28.7
%-
69.1
%)
Disc severe 7 89 295 30.4 90.0 93.3 0.00 0.60 (0.48 - 0.00
harg % 2 % 0.75)
e (13.4
%-
47.4
%)
non-severe 7 374 814 50.6 241. 97.5 0.00
% 00 %
(30.5
%-
70.6
%)
Deat severe 7 77 267 30.3 103. 94.2 0.00 2.30 (2.02 - 0.00
h % 70 % 2.63)
(13.8
%-
46.8
%)
non-severe 4 9 308 1.5% 4.86 38.2 0.18
(0.1 %
%-
2.8%
)
Figures
Page 18/22Figure 1
PRISMA ow diagram of included studies
Page 19/22Figure 2
Funnel plot for the standard error by logit event that assess publication bias
Page 20/22Figure 3
The Relative Ratio (RR) and the 95% con dence interval (95%CI) for the factors associated with the
severe COVID-19.
Supplementary Files
This is a list of supplementary les associated with this preprint. Click to download.
FigureS4.tif
FigureS5.tif
FigureS6.tif
Page 21/22FigureS7.tif
FigureS8.tif
FigureS9.tif
FigureS10.tif
searchstrategy.pdf
studyprotocol.pdf
Page 22/22You can also read