Effect of spontaneous breathing on ventilator-free days in critically ill patients-an analysis of patients in a large observational cohort
←
→
Page content transcription
If your browser does not render page correctly, please read the page content below
Original Article
                                                                                                                                        Page 1 of 11

Effect of spontaneous breathing on ventilator-free days in critically
ill patients—an analysis of patients in a large observational cohort
Aline Mela Dos Reis 1, Thais Dias Midega 1, Rodrigo Octavio Deliberato1,2, Alistair EW Johnson 3,
Lucas Bulgarelli2,3, Thiago Domingos Correa1, Leo Anthony Celi3,4, Paolo Pelosi5,6, Marcelo Gama de Abreu7,
Marcus J. Schultz8,9,10, Ary Serpa Neto1,8,11,12; for the PROVE Network investigators*
1
    Department of Critical Care Medicine, Hospital Israelita Albert Einstein, São Paulo, Brazil; 2Big Data Analytics Group, Hospital Israelita Albert
Einstein, São Paulo, Brazil; 3Laboratory for Computational Physiology, Institute for Medical Engineering & Science, MIT, Cambridge, MA,
USA; 4Division of Pulmonary, Critical Care and Sleep Medicine, Beth Israel Deaconess Medical Center, Boston, MA, USA; 5IRCCS San Martino
Policlinico Hospital, Genoa, Italy; 6Department of Surgical Sciences and Integrated Diagnostics (DISC), University of Genoa, Genoa, Italy;
7
    Pulmonary Engineering Group, Department of Anesthesiology and Intensive Care Medicine, University Hospital Carl Gustav Carus, Technical
University Dresden, Dresden, Germany; 8Department of Intensive Care & ‘Laboratory of Experimental Intensive Care and Anesthesiology’
(L·E·I·C·A), Academic Medical Center, Amsterdam, The Netherlands; 9Mahidol-Oxford Tropical Medicine Research Unit (MORU), Faculty of
Tropical Medicine, Mahidol University, Bangkok, Thailand; 10Nuffield Department of Medicine, University of Oxford, Oxford, UK; 11Australian and
New Zealand Intensive Care Research Centre, Monash University, Melbourne, Australia; 12Data Analytics Research & Evaluation (DARE) Centre,
Austin Hospital and University of Melbourne, Melbourne, Australia
Contributions: (I) Conception and design: AMD Reis, A Serpa Neto; (II) Administrative support: A Serpa Neto, LA Celi, M Gama de Abreu, P Pelosi,
MJ Schultz; (III) Provision of study materials or patients: AMD Reis, RO Deliberato, AEW Johnson, L Bulgarelli, LA Celi; (IV) Collection and
assembly of data: AMD Reis, RO Deliberato, AEW Johnson, L Bulgarelli, LA Celi; (V) Data analysis and interpretation: AMD Reis, TD Midega, A
Serpa Neto; (VI) Manuscript writing: All authors; (VII) Final approval of manuscript: All authors.
Correspondence to: Ary Serpa Neto, MD, MSc, PhD. Australian and New Zealand Intensive Care Research Centre, Monash University, Level 3, 553
St. Kilda Rd., Melbourne, VIC 3004, Australia. Email: ary.serpaneto@monash.edu.

                   Background: Mechanical ventilation can injure lung tissue and respiratory muscles. The aim of the present
                   study is to assess the effect of the amount of spontaneous breathing during mechanical ventilation on patient
                   outcomes.
                   Methods: This is an analysis of the database of the ‘Medical Information Mart for Intensive Care
                   (MIMIC)’-III, considering intensive care units (ICUs) of the Beth Israel Deaconess Medical Center
                   (BIDMC), Boston, MA. Adult patients who received invasive ventilation for at least 48 hours were included.
                   Patients were categorized according to the amount of spontaneous breathing, i.e., ≥50% (‘high spontaneous
                   breathing’) and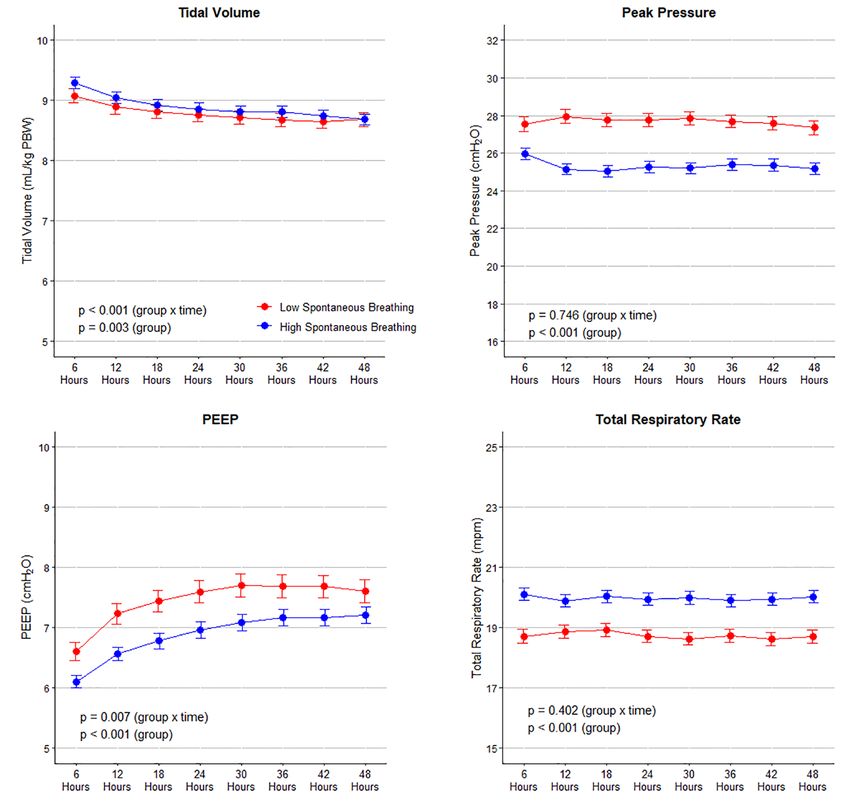
Page 2 of 11 Reis et al. Spontaneous breathing in critically ill patients
(ARDS); positive end-expiratory pressure (PEEP); ventilator-induced lung injury
Submitted Dec 09, 2020. Accepted for publication Jan 22, 2021.
doi: 10.21037/atm-20-7901
View this article at: http://dx.doi.org/10.21037/atm-20-7901
Introduction that contains high-resolution clinical data from patients
admitted to the ICUs of the Beth Israel Deaconess
Mechanical ventilation has a strong potential to harm
Medical Center (BIDMC), Boston, MA (11,12). The data
lung tissue and respiratory muscles. Prevention of lung
in MIMIC-III has been previously de-identified, and the
injury translates to improved survival, shorter need for
study was conducted in accordance with the Declaration
mechanical ventilation, and reduced length of stay in the
of Helsinki (as revised in 2013) and approved by the
intensive care unit (ICU) and hospital (1-3). One proven
institutional review boards of the Massachusetts Institute of
effective measure against ventilator-induced lung injury is
Technology (No. 0403000206) and Beth Israel Deaconess
the use of an adequately-sized, i.e., low tidal volume (VT)
Medical Center (2001-P-001699/14). Due to the study’s
(4-6). Maintaining respiratory muscle activity may prevent
retrospective nature, the requirement for individual consent
ventilator-induced diaphragm dysfunction (1,7).
was waived.
There is a clear trend towards a preference for assisted
over controlled modes of ventilation. Use of assisted
ventilation which allows spontaneous breaths may not only Inclusion and exclusion criteria
reduce the risk of lung injury by additional recruitment of
Patients in the MIMIC-III version v1.4 database were
non-aerated areas, but also keeps a patient’s diaphragm active
selected for the current analysis if: (I) age ≥16 years; and
(2,8,9). However, assisted ventilation may also result in high
(II) they received mechanical ventilation for at least 48
inspiratory efforts and a higher respiratory drive, which
consecutive hours. Patients who received ventilation
can potentially increase lung injury (10). Thus, it remains
through a tracheostomy cannula at any time during the
uncertain whether increased use of spontaneous breathing
first 48 hours of ventilation. Only data of the first ICU
translates into clinical benefit. The results of a recent post-
admission of the first hospitalization were included. Patients
hoc analysis of a large observational study in acute respiratory
transferred from other hospitals were considered only when
distress syndrome (ARDS) patients suggests that spontaneous
mechanical ventilation started in the final hospital.
breathing in the first days of ventilation does not impact
survival but hastens liberation from the ventilator (9).
To gain a better understanding of the effect of the Data extraction and preparation
amount of spontaneous breathing on outcome in critically
The dataset was assessed for completeness and consistency;
ill patients who received mechanical ventilation for various
outliers, defined as observations that lied outside 1.5×
reasons, the ‘Medical Information Mart for Intensive Care
interquartile range (IQR), were checked and substituted
(MIMIC)’-III was analyzed. The primary hypothesis tested
by the 5th or 95th percentile (13). Ventilatory variables were
was that the amount of spontaneous breathing is associated
extracted as the highest and the lowest values per each time-
with an increased number of ventilator-free days at day 28
frame of six hours during the first 48 hours of ventilation.
in patients surviving and receiving mechanical ventilation
These values were summarized as the mean for every 6-hour
for at least 48 hours. We present the following article in
time window.
accordance with the STROBE reporting checklist (available
The ventilation modes were extracted per each time-
at http://dx.doi.org/10.21037/atm-20-7901).
frame of six hours during the first 48 hours of ventilation.
The classification of the ventilation modes that was
Methods used for the longest time in each time-frame follows the
categorization in previous studies (14,15), as follows:
Study design and ethical concerns
Modes mandating spontaneous breathing: in these
This is a retrospective analysis of the MIMIC-III database modes spontaneous breathing is always required,
© Annals of Translational Medicine. All rights reserved. Ann Transl Med 2021;9(9):783 | http://dx.doi.org/10.21037/atm-20-7901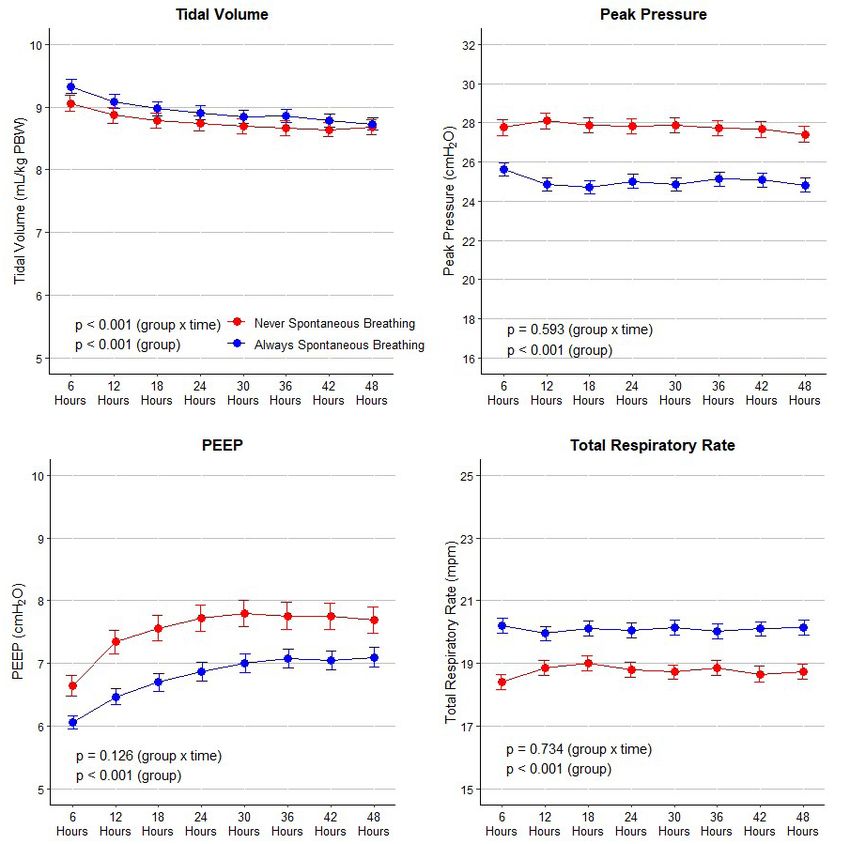
Annals of Translational Medicine, Vol 9, No 9 May 2021 Page 3 of 11
i.e., the ventilator will never provide a breath when eligible for inclusion.
the patient does not trigger the ventilator [e.g.,
‘continuous positive airway pressure’ (CPAP),
Statistical analysis
‘proportional assisted ventilation’ (PAV) or ‘pressure
support ventilation’ (PSV)]; and Only complete case analysis was carried out and no
Modes allowing spontaneous breathing: spontaneous assumption for missing data was done. All patients were
breathing is possible, but when the patient does not followed until hospital discharge or death. Continuous
trigger the ventilator, only controlled breaths will variables are presented as medians with their interquartile
be delivered [e.g., ‘pressure-controlled ventilation’ ranges and categorical variables as total number and
(PCV) or ‘volume-controlled ventilation’ (VCV)]. percentage. Proportions were compared using χ2 or Fisher
For details, see Tables S1,S2. exact tests and continuous variables were compared using
the t test or Wilcoxon rank sum test, as appropriate.
VT size was collected as an absolute volume (mL) and
Definitions
then normalized for predicted body weight (mL/kg PBW).
For every 6 hours during the first 48 hours of ventilation, it The PBW was calculated as equal to 50+0.91 (centimeters
was defined whether a patient was spontaneous breathing, of height 152.4) in males, and 45.5+0.91 (centimeters
as follows: of height 152.4) in females (16). Presence of the acute
A patient was considered not to have spontaneous respiratory distress syndrome (ARDS) in the first 48 hours
breathing if set respiratory rate (RR) equaled the of ventilation was scored according to current definition for
total RR, and ARDS, the Berlin Definition, which means that all patients
A patient was considered to have spontaneous had to be reclassified when previous definitions or criteria
breathing if receiving a ventilation mode mandating were used (17).
spontaneous breathing, or if set RR was lower than All main analyses were performed using mixed-effect
the total RR. models to account for within-year clustering. Heterogeneity
Then each patient was classified as follows: between years was determined by fitting a fixed interaction
Breathing spontaneously for equal or more than 50% term between the variable of interest and year of
of the time (high spontaneous breathing’ patients), if admission as continuous variable, while overall effect of
the proportion of time with spontaneous breathing the comparison of ‘high spontaneous breathing’ with ‘low
was ≥50% in the first 48 hours of ventilation; and spontaneous breathing’ patients was reported with year of
Breathing spontaneous for less than 50% of the admission treat as a random effect.
time (‘low spontaneous breathing’ patients), if the In a fir st assessmen t, gr oup assign ment ( ‘hi gh
proportion of time with spontaneous breathing was spontaneous breathing’ vs. ‘low spontaneous breathing’) was
250. To determine if the relationship between group
and the primary outcome differs between the subgroups,
Power calculation
fixed interaction terms between treatment and subgroup
No formal sample size calculation was carried out, and all were added in the adjusted models for the primary outcome
patients included in the current version of the dataset were described above. To further ascertain if the treatment-
© Annals of Translational Medicine. All rights reserved. Ann Transl Med 2021;9(9):783 | http://dx.doi.org/10.21037/atm-20-7901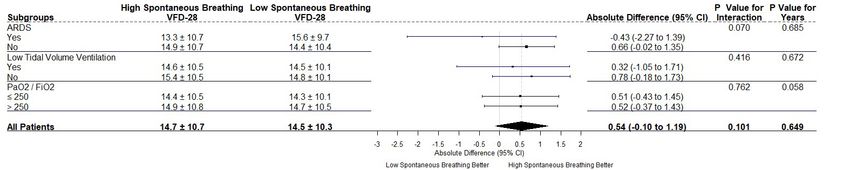
Page 4 of 11 Reis et al. Spontaneous breathing in critically ill patients
subgroup interaction varied between the year of admission, patients had a shorter duration of ventilation and a shorter
a three-way fixed interaction between year, treatment and ICU length of stay. In the adjusted analysis, only duration of
subgroup were also reported. ventilation remained lower in ‘high spontaneous breathing’
To address heterogeneity of treatment effect, the models patients.
described above were re-assessed in two groups using
stricter definitions, as follows:
Subgroup analyses
exclusively breathing spontaneously (‘always
spontaneous breathing’ patients), if the proportion Results of the subgroup analyses are present in Figure S3.
of time with spontaneous breathing was 100% in the There was no interaction among any of the subgroups and
first 48 hours of ventilation; and ‘high spontaneous breathing’ patients.
never breathing spontaneous (‘never spontaneous
breathing’ patients), if the proportion of time with
Additional analysis
spontaneous breathing was 0% in the first 48 hours
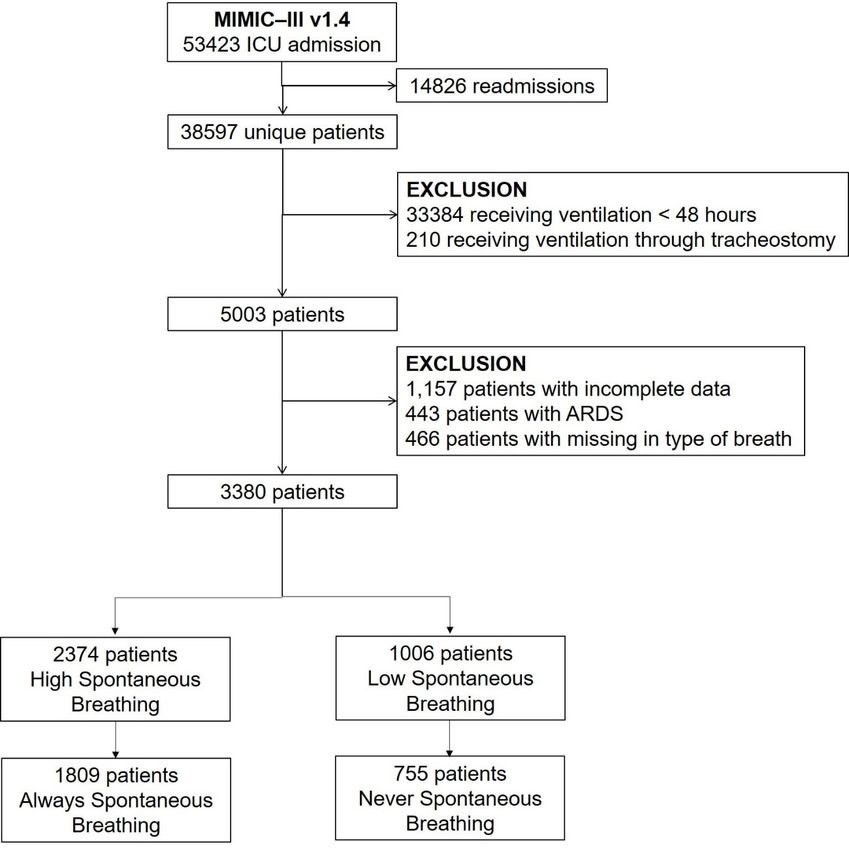
of ventilation. Of all patients available, 1,809 (53.5%) were classified as
Statistical significance was considered to be at two-sided ‘always spontaneous breathing’ patients, and 755 (22.3%)
P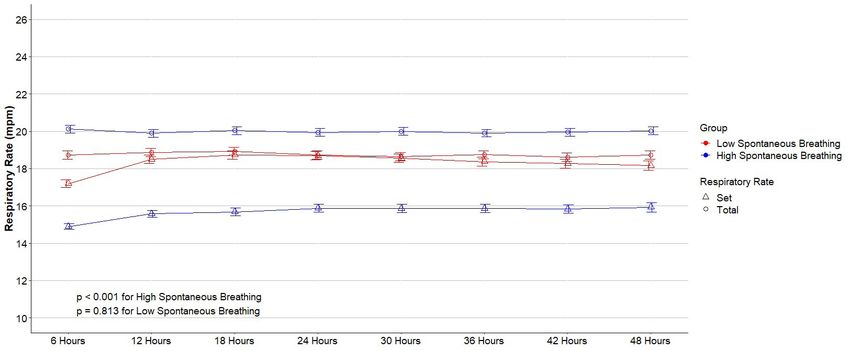
Annals of Translational Medicine, Vol 9, No 9 May 2021                                                                               Page 5 of 11

 Table 1 Baseline characteristics of the included patients according to the groups
                                        High spontaneous breathing            Low spontaneous breathing
                                                                                                                           P value
                                                (n=2,374)                             (n=1,006)

 Age, years                                    66.6 [52.9–77.8]                      61.7 [47.3–74.6]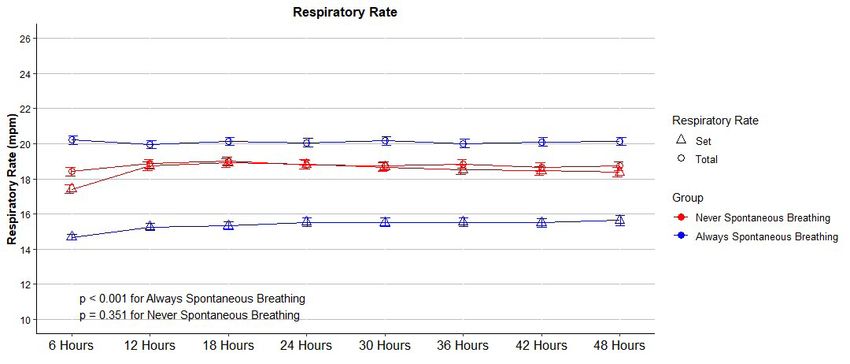
Page 6 of 11                                                                  Reis et al. Spontaneous breathing in critically ill patients

 Table 1 (continued)

                                        High spontaneous breathing    Low spontaneous breathing
                                                                                                                    P value
                                                (n=2,374)                     (n=1,006)

 Vital signs

   SAS                                           3.0 [2.8–3.4]                3.0 [2.3–3.3]
Annals of Translational Medicine, Vol 9, No 9 May 2021 Page 7 of 11
Tidal volume Peak pressure
10 32
30
Tidal volume (mL/kg PBW)
9
Peak pressure ( cmH2O)
28
26
8
24
7 22
20
6
PPage 8 of 11 Reis et al. Spontaneous breathing in critically ill patients
Table 2 Ventilatory characteristics of the patients included
High spontaneous Low spontaneous Absolute difference*** (95%
P value
breathing (n=2,374) breathing (n=1,006) confidence interval)
Percentage of spontaneous breathing 100 [100–100] 0 [0–0] 83.88 (82.71 to 85.07) < 0.001
First day of ventilation
Ventilator mode
Assisted controlled 1,308 (38.7) 553 (16.4)Annals of Translational Medicine, Vol 9, No 9 May 2021 Page 9 of 11
Table 3 Adjusted analyses for the primary and secondary outcomes
High spontaneous breathing Low spontaneous breathing Absolute difference*,** (95%
P value
(n=2,374) (n=1,006) confidence interval)
Ventilator-free days at day 28 20.0 (0.0–24.2) 19.0 (0.00–23.7) 0.54 (−0.10 to 1.19)a 0.101
Duration of ventilation in 6.5 (3.6–12.2) 7.6 (4.1–13.9) −0.91 (−1.80 to −0.02)a 0.046
survivors, days
ICU length of stay, days 9.5 (5.8–15.7) 10.0 (6.0–17.1) −0.67 (−1.49 to 0.15)a 0.110
Hospital length of stay, days 15.4 (9.6–24.2) 15.8 (9.3–25.3) −0.26 (−1.47 to 0.95)a 0.672
b
ICU mortality 598 (25.2) 246 (24.5) −0.43 (−3.09 to 2.23) 0.751
b
Hospital mortality 712 (30.0) 281 (27.9) −0.17 (−2.85 to 2.49) 0.903
b
30-day mortality 696 (29.3) 280 (27.8) −0.38 (−3.10 to 2.33) 0.786
Data are median (quartile 25%–quartile 75%) or No. (%). *absolute difference from a multivariable mixed = effect linear model with year
as random effect and adjusted for: age, gender, weight, initial diagnosis, Elixhauser comorbidity score, use of vasopressor in the first day,
limitation of support, SAPS II, OASIS, SOFA at day 1, heart rate at day 1 and 2, mean arterial pressure at day 1 and 2, and SpO2/FiO2
at day 1 and 2. **continuous variables were standardized before inclusion to improve convergence. aeffect estimate is mean difference;
b
effect estimate is risk ratio. ICU, intensive care unit.
compliant respiratory system (28). Conclusions
In conclusion, in this analysis of a large ICU dataset of
Limitations high resolution, in critically ill patients surviving and
receiving ventilation for at least 48 hours, the amount
The observational retrospective nature of the study should
of spontaneous breathing during this period was not
be considered when interpreting the findings. Residual
associated with an increased number of ventilator-free days
confounding is always a concern despite appropriate modeling
at day 28. This finding was not different for the various
and sensitivity analyses. The data was extracted from a single–
center which may limit generalizability. Only patients who subgroups However, the amount of spontaneous breathing
survived and received invasive ventilation for at least 48 hours was associated with duration of mechanical ventilation
were included, aiming to select more severely ill patients and among survivors, and the number of ventilator-free days at
also those who had been exposed to the primary exposure of day 28 was higher in ‘always spontaneous breathing’ patients
interest for a sufficient period of time. However, the results compared to ‘never spontaneous breathing’ patients.
cannot be applied to patients who were extubated or died
within 48 hours of ICU admission. Total RR was compared Acknowledgments
with set RR to determine whether patients had spontaneous
breathing. Nevertheless, it cannot be ascertained that patients Funding: Local funding was provided for the investigators
whose total and set rate did not have spontaneous breathing. by theirs centers. LAC is funded by the National Institute
Also, the exposure assessed was dependent on the patient of Health through NIBIB R01 EB017205.
clinical condition over time, and this should be considered when
interpreting the results. In addition, since the dataset used in
Footnote
this study is for clinical purposes and the present analysis is
a secondary analysis of these data, we cannot guarantee that Reporting Checklist: The authors have completed the
plateau pressure and other ventilatory variables were collected STROBE reporting checklist. Available at http://dx.doi.
under standard conditions. Finally, the observation that org/10.21037/atm-20-7901
patients with no spontaneous breathing were sicker may reflect
a systematic bias toward the use of controlled ventilation in Peer Review File: Available at http://dx.doi.org/10.21037/
patients with higher severity. atm-20-7901
© Annals of Translational Medicine. All rights reserved. Ann Transl Med 2021;9(9):783 | http://dx.doi.org/10.21037/atm-20-7901Page 10 of 11 Reis et al. Spontaneous breathing in critically ill patients
Data Sharing Statement: Available at http://dx.doi. in patients at risk of acute respiratory distress syndrome
org/10.21037/atm-20-7901 in intensive care units from 16 countries (PRoVENT):
an international, multicentre, prospective study. Lancet
Conflicts of Interest: All authors have completed the Respir Med 2016;4:882-93.
ICMJE uniform disclosure form (available at http:// 5. Gajic O, Dara SI, Mendez JL, et al. Ventilator-associated
dx.doi.org/10.21037/atm-20-7901). Dr. MGdA reports lung injury in patients without acute lung injury at
grants and personal fees from Drager, grants and personal the onset of mechanical ventilation. Crit Care Med
fees from GlaxoSmithKline, personal fees from GE 2004;32:1817-24.
Healthcare, outside the submitted work. Dr. ASN reports 6. Slutsky AS, Ranieri VM. Ventilator-induced lung injury. N
personal fees from Drager, outside the submitted work. The Engl J Med 2013;369:2126-36.
other authors have no conflicts of interest to declare. 7. Levine S, Nguyen T, Taylor N, et al. Rapid disuse atrophy
of diaphragm fibers in mechanically ventilated humans. N
Ethical Statement: The authors are accountable for all Engl J Med 2008;358:1327-35.
aspects of the work in ensuring that questions related 8. Yoshida T, Rinka H, Kaji A, et al. The impact of
to the accuracy or integrity of any part of the work are spontaneous ventilation on distribution of lung aeration
appropriately investigated and resolved. The study was in patients with acute respiratory distress syndrome:
conducted in accordance with the Declaration of Helsinki airway pressure release ventilation versus pressure support
(as revised in 2013). The study was approved by the ventilation. Anesth Analg 2009;109:1892-900.
Institutional Review Board of the Beth Israel Deaconess 9. Haren FV, Pham T, Brochard L, et al. Spontaneous
Medical Center (2001-P-001699/14) and the Massachusetts Breathing in Early Acute Respiratory Distress Syndrome:
Institute of Technology (No. 0403000206) and individual Insights from the Large observational study to UNderstand
consent for this retrospective analysis was waived. the Global Impact of Severe Acute Respiratory FailurE
Study*. Crit Care Med 2019;47:229-38.
Open Access Statement: This is an Open Access article 10. Telias I, Brochard L, Goligher EC. Is my patient’s
distributed in accordance with the Creative Commons respiratory drive (too) high? Intensive Care Med
Attribution-NonCommercial-NoDerivs 4.0 International 2018;44:1936-9.
License (CC BY-NC-ND 4.0), which permits the non- 11. Johnson AEW, Pollard TJ, Shen L, et al. MIMIC-
commercial replication and distribution of the article with III, a freely accessible critical care database. Sci Data
the strict proviso that no changes or edits are made and the 2016;3:160035.
original work is properly cited (including links to both the 12. Johnson AE, Stone DJ, Celi LA, et al. The MIMIC
formal publication through the relevant DOI and the license). Code Repository: enabling reproducibility in critical care
See: https://creativecommons.org/licenses/by-nc-nd/4.0/. research. J Am Med Inform Assoc 2018;25:32-9.
13. Johnson AEW, Kramer A, Clifford GD. Computing in
Cardiology Conference (CinC), 2014. Vol. 41. IEEE;
References
2014. Data preprocessing and mortality prediction: the
1. Jaber S, Petrof BJ, Jung B, et al. Rapidly progressive Physionet/CinC 2012 challenge revisited; p. 157-60.
diaphragmatic weakness and injury during mechanical 14. Cao H, Lee KP, Ennett CM, et al. Heuristics to determine
ventilation in humans. Am J Respir Crit Care Med ventilation times of ICU patients from the MIMIC-
2011;183:364-71. II database. Annu Int Conf IEEE Eng Med Biol Soc
2. Futier E, Constantin JM, Combaret L, et al. Pressure 2010;2010:5213-6.
support ventilation attenuates ventilator-induced protein 15. Deden K. Ventilation modes in intensive care. Dräger.
modifications in the diaphragm. Crit Care 2008;12:R116. 16. Acute Respiratory Distress Syndrome Network, Brower
3. Putensen C, Zech S, Wrigge H, et al. Long-term effects RG, Matthay MA, et al. Ventilation with lower tidal
of spontaneous breathing during ventilatory support in volumes as compared with traditional tidal volumes
patients with acute lung injury. Am J Respir Crit Care Med for acute lung injury and the acute respiratory distress
2001;164:43-9. syndrome. N Engl J Med 2000;342:1301-8.
4. Neto AS, Barbas CSV, Simonis FD, et al. Epidemiological 17. ARDS Definition Task Force, Ranieri VM, Rubenfeld
characteristics, practice of ventilation, and clinical outcome GD, et al. Acute respiratory distress syndrome: the Berlin
© Annals of Translational Medicine. All rights reserved. Ann Transl Med 2021;9(9):783 | http://dx.doi.org/10.21037/atm-20-7901Annals of Translational Medicine, Vol 9, No 9 May 2021 Page 11 of 11
definition. JAMA 2012;307:2526-33. 2019;131:594-604.
18. Blanch L, Villagra A, Sales B, et al. Asynchronies during 24. Bertoni M, Telias I, Urner M, et al. A novel non-invasive
mechanical ventilation are associated with mortality. method to detect excessively high respiratory effort
Intensive Care Med 2015;41:633-41. and dynamic transpulmonary driving pressure during
19. Vaporidi K, Babalis D, Chytas A, et al. Clusters of mechanical ventilation. Crit Care 2019;23:346.
ineffective efforts during mechanical ventilation: Impact 25. Telias I, Junhasavasdikul D, Rittayamai N, et al. Airway
on outcome. Intensive Care Med 2017;43:184-91. Occlusion Pressure as an Estimate of Respiratory Drive
20. Carvalho NC, Güldner A, Beda A, et al. Higher levels of and Inspiratory Effort During Assisted Ventilation. Am J
spontaneous breathing reduce lung injury in experimental Respir Crit Care Med 2020;201:1086-98.
moderate acute respiratory distress syndrome. Crit Care 26. Bellani G, Laffey JG, Pham T, et al. Epidemiology,
Med 2014;42:e702-15. Patterns of Care, and Mortality for Patients With Acute
21. Güldner A, Braune A, Carvalho N, et al: Higher levels Respiratory Distress Syndrome in Intensive Care Units in
of spontaneous breathing induce lung recruitment and 50 Countries. JAMA 2016;315:788-800.
reduce global stress/strain in experimental lung injury. 27. Amato MB, Meade MO, Slutsky AS, et al. Driving pressure
Anesthesiology 2014;120:673-82. and survival in the acute respiratory distress syndrome. N
22. Yoshida T, Amato MBP, Kavanagh BP. Understanding Engl J Med 2015;372:747-55.
spontaneous vs. ventilator breaths: Impact and monitoring. 28. Georgopoulos D, Xirouchaki N, Tzanakis N, et al.
Intensive Care Med 2018;44:2235-8. Driving pressure during assisted mechanical ventilation: Is
23. Bellani G, Grassi A, Sosio S, et al. Driving Pressure Is it controlled by patient brain? Respir Physiol Neurobiol
Associated with Outcome during Assisted Ventilation in 2016;228:69-75.
Acute Respiratory Distress Syndrome. Anesthesiology
Cite this article as: Reis AMD, Midega TD, Deliberato RO,
Johnson AEW, Bulgarelli L, Correa TD, Celi LA, Pelosi P,
Gama de Abreu M, Schultz MJ, Serpa Neto A; for the PROVE
Network investigators. Effect of spontaneous breathing on
ventilator-free days in critically ill patients—an analysis of
patients in a large observational cohort. Ann Transl Med
2021;9(9):783. doi: 10.21037/atm-20-7901
© Annals of Translational Medicine. All rights reserved. Ann Transl Med 2021;9(9):783 | http://dx.doi.org/10.21037/atm-20-7901Supplementary
Additional methods Statistical analyses
Characteristics of the study dataset Relevant covariates known to predict outcome were
entered into the multivariable model if a p value less than
The data were prospectively collected and stored in two
0.1 was found in the univariable model and when the
different databases. The Medical Information Mart for
percentage of missing was less than 10%. In the adjusted
Intensive Care III database (MIMIC-III v1.4), is a freely
models for the comparison of the groups (high vs. low
accessible and conveniently-sized database that contains
spontaneous breathing and always vs. never spontaneous
high resolution information from hospital monitoring
breathing), relevant covariates known to predict outcome
systems (including laboratory data, medication, and hospital
were included, not considering variables with more than
administrative data) and bedside monitoring systems (vital
10% of missing. In addition, ventilatory variables were
signs, caregivers notes, radiology reports). This database is
not included in the model, since they are closely related
hosted by the Laboratory for Computational Physiology
to the types of ventilation studied and could mediate the
at the Massachusetts Institute of Technology (MIT)
relationship between them and outcomes. At the end, the
and contains data for over 50,000 de-identified patient
following variables were considered: age, gender, weight,
admissions to ICUs at the BIDMC from 2001 to 2012. We
initial diagnosis, Elixhauser comorbidity score, use of
used the MIMIC Code Repository to define many concepts
vasopressor in the first day, limitation of support, SAPS
in MIMIC-III.
II, OASIS, SOFA at day 1, heart rate at day 1 and 2, mean
arterial pressure at day 1 and 2, and SpO2/FiO2 at day 1
Ethical approval and 2. All continuous variables were standardized before
inclusion in the models to improve convergence. The use
The Institutional Review Board of the Beth Israel
of neuromuscular blocking agents was not considered in
Deaconess Medical Center (2001-P-001699/14) and the
the models due to its highly correlation with the variable of
Massachusetts Institute of Technology (No. 0403000206)
interest (spontaneous breathing).
approved use of the MIMIC database.
© Annals of Translational Medicine. All rights reserved. http://dx.doi.org/10.21037/atm-20-7901Table S1 Classification of ventilation modes in the MIMIC-III dataset
Mode Mandating
Original Classification Re–classification
Spontaneous Breathing
APRV Airway Pressure Release Ventilation (APRV) No
APRV/Biphasic+ApnVol Airway Pressure Release Ventilation (APRV) No
Assist Control Assist Control No
CMV Continuous Mandatory Ventilation No
CMV/ASSIST Continuous Mandatory Ventilation No
CMV/ASSIST/AutoFlow Pressure Regulated Volume Control (PRVC) No
CMV/AutoFlow Pressure Regulated Volume Control (PRVC) No
CPAP Continuous Positive Airway Pressure (CPAP) Yes
CPAP/PPS Proportional Assist Ventilation (PAV) Yes
CPAP/PSV Pressure Support Ventilation (PSV) Yes
CPAP/PSV+Apn TCPL Pressure Support Ventilation (PSV) Yes
CPAP/PSV+ApnPres Pressure Support Ventilation (PSV) Yes
CPAP/PSV+ApnVol Pressure Support Ventilation (PSV) Yes
CPAP+PS Pressure Support Ventilation (PSV) Yes
MMV Mandatory Minute Ventilation (MMV) No
MMV/AutoFlow Mandatory Minute Ventilation (MMV) No
MMV/PSV Mandatory Minute Ventilation–PSV (MMV–PSV) No
MMV/PSV/AutoFlow Mandatory Minute Ventilation–PSV (MMV–PSV) No
Other/Remarks Other No
PCV+ Pressure Control No
PCV+/PSV Pressure Control No
PCV+Assist Pressure Control No
PRES/AC Pressure Control No
Pressure Control Pressure Control No
Pressure Support Pressure Support Ventilation (PSV) Yes
PRVC/AC Pressure Regulated Volume Control (PRVC) No
PSV/SBT Pressure Support Ventilation (PSV) Yes
SIMV Synchronized Intermittent Mandatory Ventilation (SIMV) No
SIMV/AutoFlow Synchronized Intermittent Mandatory Ventilation (SIMV) No
SIMV/PSV Synchronized Intermittent Mandatory Ventilation (SIMV) No
SIMV/PSV/AutoFlow Synchronized Intermittent Mandatory Ventilation (SIMV) No
SIMV+PS Synchronized Intermittent Mandatory Ventilation (SIMV) No
Standby Other No
SYNCHRON MASTER Synchronized Intermittent Mandatory Ventilation (SIMV) No
SYNCHRON SLAVE Synchronized Intermittent Mandatory Ventilation (SIMV) No
TCPCV Pressure Control No
VOL/AC Volume Control No
© Annals of Translational Medicine. All rights reserved. http://dx.doi.org/10.21037/atm-20-7901Table S2 Example of how patients were categorized in the present study in the MIMIC–III when using an assist control mode
ID Moment Set Lowest RR Total Lowest RR Set Highest RR Total Highest RR SA Percentage of SB
01 1 10 10 23 23 No
01 2 9 9 25 25 No
01 3 10 12 29 31 Yes
01 4 13 13 25 28 Excluded
01 5 12 14 22 25 Yes
01 6 12 14 24 24 Excluded
01 7 12 15 23 24 Yes
01 8 10 10 21 21 No
02 1 10 10 22 23 Excluded
02 2 14 14 25 25 No
02 3 17 17 28 28 No
02 4 9 9 25 25 No
02 5 11 11 24 24 No
02 6 10 10 26 26 No
02 7 11 11 29 29 No
02 8 12 12 30 30 No
ID: unique identificator; RR: respiratory rate; SB: spontaneous breathing; NM SB: number of moments with spontaneous breathing; NO: number of
observations available.
© Annals of Translational Medicine. All rights reserved. http://dx.doi.org/10.21037/atm-20-7901Figure S1 Flowchart of the study in the MIMIC-III dataset. © Annals of Translational Medicine. All rights reserved. http://dx.doi.org/10.21037/atm-20-7901
Table S3 Vital signs and laboratory tests
                                     High Spontaneous Breathing   Low Spontaneous Breathing      Absolute Difference* (95%
                                                                                                                               P value
                                              (n=2374)                    (n=1006)                 Confidence Interval)

 First day of ventilation

   SAS                                        3.0 (2.8–3.4)              3.0 (2.3–3.3)               0.26 (0.19 to 0.33)       < 0.001

   Heart rate, bpm                             92 (80–104)                92 (80–103)               0.18 (-0.96 to 1.33)        0.753

   Mean arterial pressure,                     80 (73–89)                 81 (73–90)                -0.55 (-1.49 to 0.40)       0.257
   mmHg

   SpO2, %                                     96 (94–98)                 96 (94–98)                 0.31 (0.05 to 0.57)        0.021

   Temperature, ºC                           37.1 (36.6–37.7)          37.0 (36.4–37.4)              0.19 (0.14 to 0.25)       < 0.001

   pH                                        7.38 (7.33–7.42)          7.36 (7.31–7.40)              0.02 (0.01 to 0.03)       < 0.001

   PaO2/FiO2                                 258 (185–361)              264 (186–367)              -2.94 (-11.84 to 5.98)       0.517

   SpO2/FiO2                                 176 (140–209)              163 (137–197)                6.81 (3.97 to 9.65)       < 0.001

   PaCO2, mmHg                                 39 (35–44)                 40 (36–45)                -1.01 (-1.67 to -0.35)      0.003

 Second day of ventilation

   SAS                                        3.1 (3.0–3.7)              3.0 (2.5–3.3)               0.31 (0.24 to 0.38)       < 0.001

   Heart rate, bpm                             90 (79–102)                89 (78–100)                1.45 (0.35 to 2.56)        0.010

   Mean arterial pressure,                     81 (73–90)                 80 (73–90)                0.08 (-0.75 to 0.90)        0.856
   mmHg

   SpO2, %                                     97 (95–98)                 97 (95–98)                -0.05 (-0.27 to 0.17)       0.648

   Temperature, ºC                           37.3 (36.8–37.8)          37.2 (36.7–37.7)              0.10 (0.06 to 0.15)       < 0.001

   pH                                        7.40 (7.36–7.43)          7.41 (7.36–7.44)             -0.01 (-0.01 to 0.00)       0.019

   PaO2/FiO2                                 247 (187–324)              243 (186–321)               1.62 (-5.19 to 8.46)        0.643

   SpO2/FiO2                                 213 (184–244)              207 (176–244)                3.30 (0.17 to 6.44)        0.039

   PaCO2, mmHg                                 39 (34–44)                 38 (34–42)                 0.81 (0.19 to 1.42)        0.010

 Data are median (quartile 25% - quartile 75%). SpO2: pulse oximetry; SAS: sedation agitation scale. *mean difference from a univariable
 mixed-effect linear model with year as random effect.

© Annals of Translational Medicine. All rights reserved.                                           http://dx.doi.org/10.21037/atm-20-7901
Figure S2 Comparison of set and total respiratory rate among groups. Symbols and bars are mean and 95% confidence interval. Mixed-
effect longitudinal models with random intercept for patients and year of admission, and with group, time and the interaction of group x
time as fixed effects. P values reported are for the group and reflect the overall test for difference between groups across the 48 hours.
Table S4 Unadjusted analyses for the primary and secondary outcomes
High Spontaneous Breathing Low Spontaneous Breathing Absolute Difference* (95%
P value
(n=2374) (n=1006) Confidence Interval)
Ventilator–free days at day 28 20.0 (0.0–24.2) 19.0 (0.00–23.7) 0.19 (-0.59 to 0.97)a 0.635
Duration of ventilation in 6.5 (3.6–12.2) 7.6 (4.1–13.9) -1.03 (-1.90 to -0.15)a 0.021
survivors, days
ICU length of stay, days 9.5 (5.8–15.7) 10.0 (6.0–17.1) -0.80 (-1.57 to -0.02)a 0.043
a
Hospital length of stay, days 15.4 (9.6–24.2) 15.8 (9.3–25.3) -0.81 (-1.97 to 0.35) 0.170
ICU mortality 598 (25.2) 246 (24.5) 0.74 (-2.46 to 3.93)b 0.651
b
Hospital mortality 712 (30.0) 281 (27.9) 2.06 (-1.30 to 5.42) 0.230
30–day mortality 696 (29.3) 280 (27.8) 1.48 (-1.86 to 4.83)b 0.384
Data are median (quartile 25% - quartile 75%) or N (percentage). ICU: intensive care unit; *absolute difference from a univariable mixed-
effect linear model with year as random effect; aeffect estimate is mean difference; beffect estimate is risk ratio.
Figure S3 Subgroup analyses.
© Annals of Translational Medicine. All rights reserved. http://dx.doi.org/10.21037/atm-20-7901Table S5 Baseline characteristics of the included patients according to more strict groups
Always Spontaneous Breathing
Never Spontaneous Breathing (n=755) P value
(n=1809)
Age, years 67.5 (54.0–78.3) 61.8 (47.3–74.9) < 0.001
Male gender 977 (54.0) 454 (60.1) 0.005
Weight, kg 77.0 (65.5–92.8) 81.1 (68.3–98.6) < 0.001
Height, cm 170 (164–177) 173 (163–178) 0.001
2
Body mass index, kg/m 27.3 (23.8–32.2) 28.3 (24.2–33.2) 0.011
Predicted body weight, kg 63.9 (54.7–73.1) 66.2 (56.9–73.1) 0.001
Admission type 0.032
Surgical elective 136 (7.5) 61 (8.1)
Surgical urgency 89 (4.9) 20 (2.6)
Clinical 1584 (87.6) 674 (89.3)
Source of admission 0.024
Emergency room 881 (48.7) 383 (50.7)
Office or operating room 195 (10.8) 81 (10.7)
Ward or step-down unit 235 (13.0) 125 (16.6)
Transferred from other hospital 482 (26.6) 163 (21.6)
Other 16 (0.9) 3 (0.1)
Initial diagnosis < 0.001
Sepsis (including pneumonia) 404 (22.3) 132 (17.5)
Cardiovascular disease 377 (20.8) 221 (29.3)
Other respiratory condition 279 (15.4) 95 (12.6)
Neurological condition 332 (18.4) 152 (20.1)
Renal condition 27 (1.5) 1 (0.1)
Other 390 (21.6) 154 (20.4)
COPD 102 (5.6) 35 (4.6) 0.351
Smoking 857 (48.0) 344 (46.9) 0.018
Elixhauser comorbidity score 6 (2–12) 6 (0–11) 0.026
Support in the first 24 hours
Vasopressor 818 (45.2) 444 (58.8) < 0.001
Renal replacement therapy 99 (5.5) 35 (4.6) 0.441
Limitation of support 461 (27.2) 155 (22.0) 0.009
Severity of illness
SAPS II 43 (34–53) 43 (33–55) 0.858
OASIS 38 (33–44) 37 (32–43) 0.001
SOFA 6 (4–8) 7 (4–9) < 0.001
Data are median (quartile 25% - quartile 75%) or No (%). BMI: body mass index; PBW: predicted body weight; COPD: chronic obstructive
pulmonary disease; ARDS: acute respiratory distress syndrome; SAPS: Simplified Acute Physiology Score; OASIS: Oxford Acute Severity
of Illness Score; SOFA: Sequential Organ Failure Assessment; bpm: beats per minute.
© Annals of Translational Medicine. All rights reserved. http://dx.doi.org/10.21037/atm-20-7901Table S6 Vital signs and laboratory tests according to more strict groups
Always Spontaneous Breathing Never Spontaneous Breathing Absolute Difference* (95%
P value
(n=1809) (n=755) Confidence Interval)
First day of ventilation
SAS 3.0 (2.9–3.4) 3.0 (2.2–3.2) 0.34 (0.26 to 0.42) < 0.001
Heart rate, bpm 92 (81–104) 92 (79–104) 0.38 (-0.94 to 1.71) 0.573
Mean arterial pressure, 80 (73–89) 81 (73–90) -0.81 (-1.91 to 0.29) 0.149
mmHg
SpO2, % 96 (94–98) 96 (94–98) 0.42 (0.11 to 0.73) 0.007
Temperature, ºC 37.2 (36.6–37.7) 36.9 (36.4–37.4) 0.24 (0.18 to 0.30) < 0.001
pH 7.38 (7.33–7.42) 7.36 (7.31–7.40) 0.02 (0.02 to 0.03) < 0.001
PaO2/FiO2 261 (186–366) 260 (184–366) 2.46 (-7.82 to 12.78) 0.640
SpO2/FiO2 178 (141–210) 161 (136–196) 9.66 (6.38 to 12.96) < 0.001
PaCO2, mmHg 39 (34–44) 40 (36–44) -1.20 (-1.93 to -0.46) 0.001
Second day of
ventilation
SAS 3.1 (3.0–3.7) 3.0 (2.2–3.3) 0.39 (0.30 to 0.47) < 0.001
Heart rate, bpm 90 (79–102) 89 (78–101) 1.28 (0.01 to 2.55) 0.048
Mean arterial pressure, 80 (73–90) 80 (73–89) 0.13 (-0.82 to 1.08) 0.786
mmHg
SpO2, % 97 (95–98) 97 (95–98) -0.02 (-0.28 to 0.24) 0.888
Temperature, ºC 37.3 (36.9–37.8) 37.2 (36.7–37.7) 0.11 (0.06 to 0.17) < 0.001
pH 7.40 (7.36–7.43) 7.41 (7.36–7.44) -0.01 (-0.01 to 0.00) 0.057
PaO2/FiO2 247 (187–325) 238 (182–319) 4.12 (-3.76 to 12.04) 0.307
SpO2/FiO2 213 (184–244) 199 (175–242) 5.75 (2.12 to 9.40) 0.002
PaCO2, mmHg 38 (34–44) 38 (34–42) 0.67 (-0.03 to 1.36) 0.060
Data are median (quartile 25% - quartile 75%). SpO2: pulse oximetry; SAS: sedation agitation scale; * mean difference from a univariable
mixed-effect linear model with year as random effect.
© Annals of Translational Medicine. All rights reserved. http://dx.doi.org/10.21037/atm-20-7901Table S7 Ventilatory characteristics of the patients included according to more strict groups
Always Spontaneous Breathing Never Spontaneous Absolute Difference*** (95%
P value
(n=1809) Breathing (n=755) Confidence Interval)
Percentage of spontaneous 100 (100–100) 0 (0–0) – –
breathing
First day of ventilation
Tidal volume, ml/kg PBW 8.9 (7.9–10.1) 8.8 (7.9–10.0) 0.09 (-0.07 to 0.25) 0.249
PEEP, cmH2O 5 (5–7) 6 (5–10) -0.87 (-1.07 to -0.68)Figure S4 omparison of set and total respiratory rate among more strict groups Symbols and bars are mean and 95% confidence interval. Mixed-effect longitudinal models with random intercept for patients and year of admission, and with group, time and the interaction of group x time as fixed effects. P values reported are for the group and reflect the overall test for difference between groups across the 48 hours. © Annals of Translational Medicine. All rights reserved. http://dx.doi.org/10.21037/atm-20-7901
Figure S5 Measurements of ventilatory parameters every 6 hours for the first 48 hours of ventilation according to more strict groups.
Circles and bars are mean and 95% confidence interval. Mixed-effect longitudinal models with random intercept for patients and with
group, time and the interaction of group x time as fixed effects. P values for the group reflect the overall test for difference between groups
across the 48 hours while P values for the group x time interaction evaluate if change over time differed by group.

© Annals of Translational Medicine. All rights reserved.                                               http://dx.doi.org/10.21037/atm-20-7901
Table S8 Unadjusted analyses for the primary and secondary outcomes according to more strict groups

                                      Always Spontaneous        Never Spontaneous Breathing          Absolute Difference* (95%
                                                                                                                                    P value
                                       Breathing (n=1809)                 (n=755)                      Confidence Interval)

 Ventilator–free days at day 28              20 (0–24)                     18 (0–23)                    0.72 (-0.19 to 1.63)         0.119

 Duration of ventilation in               5.9 (3.6–10.4)                 5.0 (2.9–9.8)                  0.80 (-0.03 to 1.63)         0.058
 survivors, days

 ICU length of stay, days                 9.5 (5.9–15.6)                10.1 (6.0–17.4)                -1.04 (-1.92 to -0.14)        0.022

 Hospital length of stay, days            15.5 (9.7–24.4)               15.4 (9.2–25.8)                 -0.83 (-2.20 to 0.55)        0.235

 ICU mortality                              470 (26.0)                    203 (26.9)                    -0.91 (-4.64 to 2.83)        0.635

 Hospital mortality                         561 (31.0)                    229 (30.3)                    0.68 (-3.24 to 4.60)         0.734

 30–day mortality                           546 (30.2)                    230 (30.5)                    -0.28 (-4.18 to 3.62)        0.888

 Data are median (quartile 25% - quartile 75%) or N (percentage). ICU: intensive care unit. * absolute difference from a univariable mixed–
 effect linear model with year as random effect; a effect estimate is mean difference; b effect estimate is risk ratio.

 Table S9 Adjusted analyses for the primary and secondary outcomes according to more strict groups

                                        Always Spontaneous             Never Spontaneous               Absolute Difference*,**
                                                                                                                                    P value
                                         Breathing (n=1809)             Breathing (n=755)            (95% Confidence Interval)

 Ventilator–free days at day 28                20 (0–24)                    18 (0–23)                   0.96 (0.20 to 1.72)          0.014

 Duration of ventilation in                 5.9 (3.6–10.4)                5.0 (2.9–9.8)                 0.77 (-0.16 to 1.70)         0.109
 survivors, days

 ICU length of stay, days                   9.5 (5.9–15.6)               10.1 (6.0–17.4)                -0.86 (-1.83 to 0.10)        0.080

 Hospital length of stay, days              15.5 (9.7–24.4)              15.4 (9.2–25.8)                -0.29 (-1.74 to 1.17)        0.700

 ICU mortality                                470 (26.0)                    203 (26.9)                  -1.27 (-4.40 to 1.86)        0.428

 Hospital mortality                           561 (31.0)                    229 (30.3)                  -1.02 (-4.19 to 2.13)        0.530

 30–day mortality                             546 (30.2)                    230 (30.5)                  -1.66 (-4.86 to 1.54)        0.313

 Data are median (quartile 25% - quartile 75%) or N (percentage). ICU: intensive care unit. * absolute difference from a multivariable mixed–
 effect linear model with year as random effect and adjusted for: age, gender, weight, initial diagnosis, Elixhauser comorbidity score, use
 of vasopressor in the first day, limitation of support, SAPS II, OASIS, SOFA at day 1, heart rate at day 1 and 2, mean arterial pressure at
 day 1 and 2, and SpO2 / FiO2 at day 1 and 2; ** continuous variables were standardized before inclusion to improve convergence; a effect
 estimate is mean difference; b effect estimate is risk ratio.

© Annals of Translational Medicine. All rights reserved.                                                 http://dx.doi.org/10.21037/atm-20-7901
You can also read