A novel severity score to predict inpatient mortality in COVID 19 patients - Nature
←
→
Page content transcription
If your browser does not render page correctly, please read the page content below
www.nature.com/scientificreports
OPEN A novel severity score to predict
inpatient mortality in COVID‑19
patients
David J. Altschul1,3,4*, Santiago R. Unda1*, Joshua Benton1,4, Rafael de la Garza Ramos1,3,4,
Phillip Cezayirli1,3,4, Mark Mehler2,4 & Emad N. Eskandar1,3,4
COVID-19 is commonly mild and self-limiting, but in a considerable portion of patients the disease is
severe and fatal. Determining which patients are at high risk of severe illness or mortality is essential
for appropriate clinical decision making. We propose a novel severity score specifically for COVID-19
to help predict disease severity and mortality. 4711 patients with confirmed SARS-CoV-2 infection
were included. We derived a risk model using the first half of the cohort (n = 2355 patients) by logistic
regression and bootstrapping methods. The discriminative power of the risk model was assessed by
calculating the area under the receiver operating characteristic curves (AUC). The severity score was
validated in a second half of 2356 patients. Mortality incidence was 26.4% in the derivation cohort
and 22.4% in the validation cohort. A COVID-19 severity score ranging from 0 to 10, consisting of
age, oxygen saturation, mean arterial pressure, blood urea nitrogen, C-Reactive protein, and the
international normalized ratio was developed. A ROC curve analysis was performed in the derivation
cohort achieved an AUC of 0.824 (95% CI 0.814–0.851) and an AUC of 0.798 (95% CI 0.789–0.818) in
the validation cohort. Furthermore, based on the risk categorization the probability of mortality was
11.8%, 39% and 78% for patient with low (0–3), moderate (4–6) and high (7–10) COVID-19 severity
score. This developed and validated novel COVID-19 severity score will aid physicians in predicting
mortality during surge periods.
The first confirmed case of COVID-19 in New York City was on March 1st, 2020. Within a few short weeks all of
the hospitals in the area were overwhelmed hitting a peak on April 6th, 2020 of 6,377 confirmed positive cases
that day. As of July 3rd, 2020, there have been 18,535 deaths, 55,110 hospitalizations and a total of 213,212 cases
in this city1. New York City is an international travel hub with a high population density, and a heavy reliance
on mass transportation that provided the permissive substrate for rapid viral s pread2. As such, this region was
andemic3. Over these first few
one of the earliest areas in the United States to encounter the full impact of the p
months much has been learned about the disease, its deadliness, and those who are at higher risk for dying.
In many people the disease is mild and self-limiting, but in a considerable portion of patients the disease is
severe and fatal. Determining which patients are at high risk of severe illness or mortality is an essential part
of understanding this illness. Prior reports from Wuhan identified certain comorbidities as diabetes, hyperten-
sion and coronary artery disease as patients more likely to present to their h ospital4. They also discovered that
patients with older age, higher Sequential Organ Failure Assessment (SOFA) score, and elevated d-dimers were
significantly associated with inpatient m ortality4. Further reports have shown other predictors of poor outcome
such as acute kidney injury, acute hepatic injury, the need for mechanical ventilation, elevated c-reactive protein
(CRP), interleukin-6 (IL-6), lymphocyte count, and Procalcitonin l evels5–8.
COVID-19 is unique in its ability to not only cause sepsis, and multi-system organ failure, but also to cause
a severe inflammatory response that can lead to systemic multi-vascular t hrombosis9,10. While the SOFA score
is also predictive of mortality for COVID-19, it does not address the additional thrombotic mitigators of severe
illness11. Other reports have recommended the use of the International Society of Thrombosis and Haemostasis
(ISTH) Disseminated Intravascular Coagulation Score (DICS), which was initially developed to help predict the
1
Department of Neurological Surgery, Montefiore Medical Center, 3316 Rochambeau Ave., Bronx, NY 10467,
USA. 2Department of Neurology, Montefiore Medical Center, Bronx, NY, USA. 3Leo M. Davidoff Department of
Neurosurgery, Montefiore Medical Center, Bronx, NY, USA. 4Albert Einstein College of Medicine, Bronx, NY,
USA. *email: daltschu@montefiore.org; Santiagounda94@gmail.com
Scientific Reports | (2020) 10:16726 | https://doi.org/10.1038/s41598-020-73962-9 1
Vol.:(0123456789)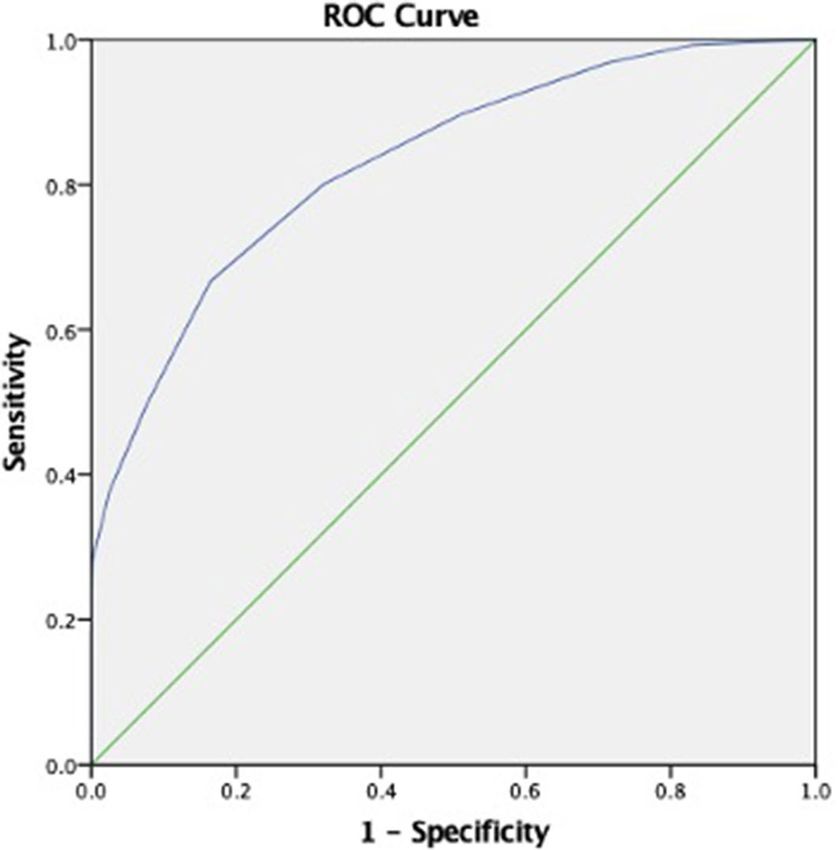
www.nature.com/scientificreports/
development of disseminated intravascular coagulation (DIC), and now being used to help guide the use of anti-
coagulation for patients with COVID-1912–14. We propose a novel score specifically for COVID-19 in-hospital
mortality, combining elements of both of these scores to help predict disease severity and mortality.
Methods
After approval of this study by the Montefiore Medical Center/Albert Einstein College of Medicine Institutional
Review Board, information on demographics, comorbidities, admission laboratory values, admission medica-
tions, admission supplemental oxygen orders, discharge and mortality was identified through a healthcare sur-
veillance software package (Clinical Looking Glass [CLG]; Streamline Health, Atlanta, Georgia) and review of
the primary medical records. The Montefiore Medical Center/Albert Einstein College of Medicine Institutional
Review Board approved waiver of patient informed consent due to the retrospective design of the study. To our
knowledge, a description of the entire cohort of patients, as in the current manuscript, has not been reported in
other submissions. In the interest of transparency, anonymized data will be made available at https://figshare.
com/s/79827c396af7df42b3d7.
All methods were carried out in accordance with relevant guidelines and regulations Laboratory measures
were extracted by identifying those obtained-on-admission. Comorbidities were identified based on the Inter-
national Coding Disease coding system (ICD-10). The comorbidities chosen for this study are those used in
the Charlson Comorbidity Index. Each patient’s medical record was queried for any diagnosis occurring within
5 years of his or her index admission. We included the laboratory markers that were made part of the routine
tests on admission during the period of the study in our institution, among the available markers we selected
the ones that have been reported to be commonly altered accordingly to recent studies (Online Appendix 1).
This study is an observational cohort study validating a novel, simple COVID-19 in-hospital mortality score
to predict inpatient mortality risk in 4711 patients with confirmed SARS-CoV-2 infection using a combination
of presentation vital signs, and basic admission laboratory values. This model was created on patients present-
ing from March 1st to April 16th. We used the first numeric half of patients during this period (n = 2355) as the
“derivation cohort” in which the severity score was developed and internally validated. The second numeric
half of our cohort (n = 2356) was used to confirm the power of the prediction score; this part of the cohort was
considered the “validation cohort”.
Inclusion criteria was defined as all patients admitted to a hospital within a large healthcare network that
were positive by detection of SARS-CoV-2 RNA using real-time reverse transcriptase–polymerase chain reac-
tion (RT-PCR) assay testing, performed within the hospital system or documented at an outside system prior to
transfer. Patients evaluated in the emergency room but not admitted, or those that died in the emergency room,
were excluded from the analysis, given the relative paucity of data. Most patients had only one admission, and
we only considered the last hospitalization for those that had multiple admissions during this period.
Statistical analysis. Continuous values were represented using mean ± standard deviation (SD), or median
and interquartile range (IQR). Categorical variables were described using frequencies and proportions. Compar-
isons were performed using Student’s t test, the nonparametric Mann–Whitney test or χ2 tests as appropriate.
No imputation was made for missing data. The primary outcome of this study was in-hospital mortality. Hence,
all the following statistical steps were done with in-hospital mortality as the only dependent variable.
For easier application to a risk score model, when performing multiple regression analysis, most continuous
variables were converted to categories based on published data as follows: advanced age (≥ 60 years, ≥ 70 years,
and ≥ 80 years), body mass index (< 18.5 or > 24.9 kg/m2), oxygen saturation (< 94%), temperature (> 38 °C), mean
arterial pressure (MAP < 80 mmHg, < 70 mmHg, < 60 mmHg), white blood cell count (< 4800 or > 10,800 per
mm3), Lymphocytes (< 1000 per m m3), platelet count (≤ 150,000 per m
m3), alanine aminotransferase (ALT > 40
U/L), aspartate aminotransferase (AST > 40 U/L), ferritin (> 300 µg/L), INR (> 1.2), d-dimer (> 3 mg/ml), cre-
atinine (> 150 µmol/L), blood urea nitrogen (BUN) (> 35 mg/dL), glucose (< 60 or > 500 mg/dL), sodium (< 139
or > 154 mmol/L), interleukin-6 (IL-6) (> 150 pg/ml), C-reactive protein (CRP) (> 10 mg/L), Procalcitonin
(> 0.1 ng/ml), and Troponin (> 0.1 ng/ml).
Candidate predictors with P < 0.10 in univariate analyses were included a multiple logistic regression. In
addition, a backward stepwise bootstrap regression model, in which 1000 random samples patients were gener-
ated with replacement, was also performed to investigate the relative importance of each variable included in
our model15. Frequencies of occurrence of each covariate in the final model were noted; if predictors occurred
in 70% or more of the bootstrap models, they were retained in the final multiple regression model. Beta coef-
ficients and odds ratios (OR) were calculated with 95% confidence intervals (CI). The multiple regression coef-
ficients of the predictive factors were used to assign integer points for the prediction score. However, for the
simplicity of the score we allocated points in sequential order for variables with multiple categories (e.g., age in
years < 60, ≥ 60, ≥ 70, and ≥ 80 would equal to 0, 1, 2 and 3 points in the score, respectively).
As described in previous validation m ethods13, we assessed the discriminative power of the prediction score
by calculating the area under the receiver operating characteristic (ROC) curves (AUC). A predictor with an
AUC above 0.7 was considered to be useful, while an AUC between 0.8 and 0.9 indicated good diagnostic accu-
racy. Risk categories were determined using the classification and regression tree (CART) analysis. The CART
algorithm builds decision tree based on Gini’s impurity index as splitting criterion; the score was iteratively
subdivided to find the cut-off point that produces the greatest reduction of impurity, meaning that it measures
how often a random patient that died will be incorrectly labeled as low-risk and vice versa, a patient that survived
will be labeled as high-risk16. Calibration of the risk score reflecting the link between predicted and observed
risk, was evaluated by the Hosmer–Lemeshow goodness of fit test. A P value < 0.05 was considered statistically
significant for all analyses. Data were analyzed using the STATA version 12 and IBM SPSS version 24.
Scientific Reports | (2020) 10:16726 | https://doi.org/10.1038/s41598-020-73962-9 2
Vol:.(1234567890)www.nature.com/scientificreports/
Baseline characteristics Derivation cohort (n = 2355) Validation cohort (n = 2356)
Age-years, mean (SD) 65.3 (15.9) 61.4 (17.2)
Female sex, n (%) 1256 (53.3) 944 (40.1)
White, n (%) 269 (11.4) 197 (8.4)
African American, n (%) 1011 (42.9) 732 (31.1)
Hispanic, n (%) 837 (35.5) 916 (38.9)
Asian, n (%) 44 (1.9) 77 (3.3)
Body mass index (kg/m2) (IQR) 28.9 (24.8–33.8) 28.1 (24.3–32.3)
Diabetes simple, n (%) 442 (18.8) 244 (10.4)
Diabetes complicated, n (%) 323 (13.7) 172 (7.3)
Congestive heart failure, n (%) 357 (15.2) 184 (7.8)
Myocardial infarction, n (%) 137 (5.8) 64 (2.7)
Chronic pulmonary disease, n (%) 181 (7.7) 84 (3.6)
Temperature (°C), (IQR) 37.1 (36.7–37.7) 37.1 (36.7–37.7)
Oxygen saturation (%), (IQR) 95 (90–98) 95 (90–98)
Mean Arterial Pressure (MAP)-mmHg, (IQR) 86.7 (75.7–95.3) 86.7 (76–96.7)
White Blood Cells (WBC) per mm3, (IQR) 7200 (5300–10,000) 7400 (5400–10,500)
Lymphocytes per mm3, (IQR) 1000 (700–1400) 1000 (700–1500)
Platelets k per mm3, (IQR) 212 (158–276) 211.5 (158–281.5)
Alanine aminotransferase (AST) U/L, (IQR) 25 (15–41) 27 (16–46)
Aspartate aminotransferase (ALT) U/L , (IQR) 37 (24–61) 38 (24–64)
Ferritin µg/L , (IQR) 778 (369–1623) 675 (236–1459)
International normalized ratio (INR), (IQR) 1.1 (1.0–1.2) 1.1 (1.0–1.2)
D-dimer mg/ml, (IQR) 1.24 (0.36–3.16) 1.12 (0.0–2.95)
Creatinine µmol/L, (IQR) 110 (80–190) 102 (76–170)
Blood urea nitrogen (BUN) mg/dL, (IQR) 18 (11–35) 16 (9–32)
Glucose mg/dL, (IQR) 117 (105–167) 116 (91–161)
Sodium mmol/L, (IQR) 137 (134–140) 137 (134–140)
Interleukin-6 (IL-6) pg/ml, (IQR) 40.7 (17.3–88.9) 36.1 (14.6–80.1)
C-Reactive protein (CRP) mg/L, (IQR) 6.1 (0.5–15.9) 7 (1.4–16.2)
Procalcitonin ng/ml, (IQR) 0.2 (0.1–1.0) 0.2 (0.09–0.7)
Troponin ng/ml, (IQR) 0.01 (0.01–0.02) 0.01 (0.01–0.03)
In-hospital mortality, n (%) 621 (26.4) 527 (22.4)
Table 1. Baseline characteristics of COVID-19 positive patients in the derivation and validations cohorts.
Missing data: Congestive heart failure (2%), Chronic Pulmonary Disease (3%), Oxygen saturation (4%),
Temperature (3%), Mean arterial pressure (5%), D-dimer (21%), Platelets (3%), INR (9%), BUN (12%),
Creatinine (3%), Sodium (4%), Glucose (29%), AST (5%), ALT (4%), WBC (3%), Lymphocytes (3%), IL-6
(66%), Ferritin (28%), CRP (14%), Procalcitonin (44%), and Troponin (14%).
Results
Distribution of socio-demographics, comorbidities, vital signs and laboratory values between the validation and
derivation cohorts are shown in Table 1. A total of 2355 COVID-19 positive patients were treated in our hospital
during the first half of period chosen during the New York City outbreak (derivation cohort), from which 621
(26.4%) patients died. The validation cohort consisted of 2356 COVID-19 positive patients out of which 527
(22.4%) died.
The univariate analysis showed 22 potential predictors with a P < 0.1 (Table 2). Out of the 22 candidate pre-
dictors, 10 variables remained as independent predictors in the multiple logistic regression analysis, including
age (> 60, > 70 and > 80 years), female sex, oxygen saturation < 94%, mean arterial pressure (MAP) (< 80, < 70
and < 60 mmHg), international normalized ratio (INR) > 1.2, creatinine > 150 µmol/L, blood urea nitrogen
(BUN) > 30 mg/dL, interleukin-6 (IL-6) > 150 pg/ml mol/dL, C-reactive protein (CRP) > 10, and procalci-
tonin > 0.1 (Table 3).
The bootstrap analysis revealed that, out of the 10 independent predictors of mortality, age, oxygen saturation,
MAP, BUN, CRP, INR and procalcitonin were reproducibly selected in more than 70%. Due to the large number
of missing data for procalcitonin (44%), this variable was excluded in order to avoid noise predictors. Allocation
of points for the COVID-19 severity score was made based on Beta coefficients and BCa 95%CI, however for
the simplicity of the score we allocated points 1 to 3 in subcategorized variables (Age & MAP) (Table 4). The
total prediction score ranges between 0 and 10 with a high score indicating high risk of in-hospital mortality.
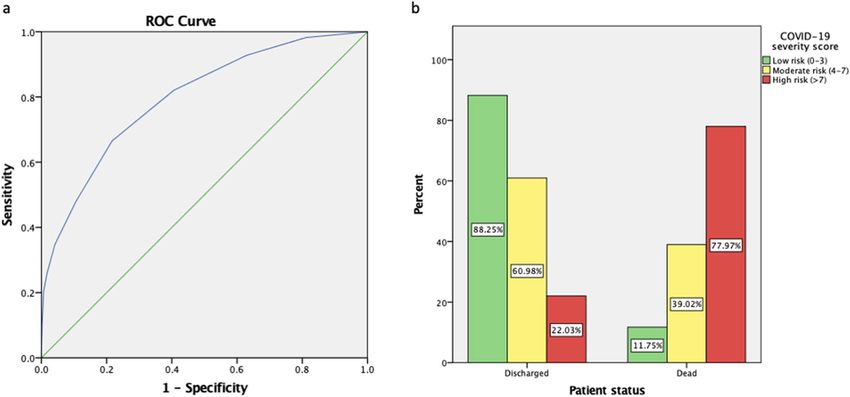
A ROC curve analysis was performed in the derivation cohort (Fig. 1), the novel COVID-19 severity score
achieved an AUC of 0.824 (95% CI 0.814–0.851) indicating a good discrimination for patients with higher risk
Scientific Reports | (2020) 10:16726 | https://doi.org/10.1038/s41598-020-73962-9 3
Vol.:(0123456789)www.nature.com/scientificreports/
Predictors Discharged (n = 1733) Died (n = 621) p value
Age-years, mean (SD) 62.72 (16.1) 72.55 (13.1) < 0.001
Female sex, n (%) 962 (55.5) 294 (47.3) < 0.001
White, n (%) 188 (10.8) 81 (13)
African American, n (%) 759 (43.8) 252 (40.6)
0.139
Hispanic, n (%) 626 (36.1) 211 (34)
Asian, n (%) 27 (1.6) 17 (2.7)
Body mass index (kg/m2) (IQR) 29.1 (25–33.9) 28.2 (23.6–33.2) 0.42
Diabetes simple, n (%) 327 (18.9) 115 (18.5) 0.852
Diabetes complicated, n (%) 241 (13.9) 82 (13.2) 0.666
Congestive heart failure, n (%) 248 (14.3) 109 (17.6) 0.053
Myocardial infarction, n (%) 102 (5.9) 35 (5.6) 0.822
Chronic pulmonary disease, n (%) 120 (6.9) 61 (9.8) 0.02
Temperature (°C), (IQR) 37.06 (36.7–37.67) 37.17 (36.72–37.8) 0.001
Oxygen saturation (%), (IQR) 95 (92–98) 92 (84–96) < 0.001
Mean Arterial Pressure (MAP)-mmHg, (IQR) 89 (80–96.7) 72.3 (53.3–88.3) < 0.001
White Blood Cells per mm3, (IQR) 7 (5.2–9.5) 8.1 (5.8–11.6) 0.041
Lymphocytes per mm3, (IQR) 1 (0.7–1.4) 0.9 (0.6–1.3) < 0.001
Platelets k per mm3, (IQR) 217 (162–279) 192 (150–259) < 0.001
Alanine aminotransferase (AST) U/L , (IQR) 24 (15–39) 29 (17–44) 0.028
Aspartate aminotransferase (ALT) U/L , (IQR) 34 (23–55) 52 (31–82) < 0.001
Ferritin µg/L , (IQR) 675.5 (316–1476) 1119 (622–1980) < 0.001
International normalized ratio (INR), (IQR) 1.1 (1–1.2) 1.1 (1–1.3) < 0.001
D-dimer mg/ml, (IQR) 1.09 (0.36–2.51) 2.19 (0.35–7.0) < 0.001
Creatinine µmol/L, (IQR) 1.01 (0.8–1.52) 1.62 (1.03–3.1) < 0.001
Blood urea nitrogen (BUN) mg/dL, (IQR) 16 (10–28) 29 (13–58) < 0.001
Glucose mg/dL, (IQR) 132.5 (110–189) 155 (121–232) 0.187
Sodium mmol/L , (IQR) 137 (134–140) 138 (134–142) < 0.001
Interleukin-6 (IL-6) pg/ml, (IQR) 29.5 (13.7–61.1) 87 (42.3–179.4) < 0.001
C-Reactive protein (CRP) mg/L , (IQR) 5.5 (1.1–13.6) 13.3 (4.3–23) < 0.001
Procalcitonin ng/ml, (IQR) 0.2 (0.1–0.5) 0.9 (0.3–3.6) < 0.001
Troponin ng/ml, (IQR) 0.01 (0.01–0.01) 0.02 (0.01–0.08) < 0.001
Table 2. Univariate analysis of discharged and dead patients with Covid-19 in the derivation cohort.
Independent Predictors OR [95% CI] p value
Age (< 60 years-reference)
≥ 60 years 2.4 [1.18–5.16] p = 0.025
≥ 70 years 3.39 [1.59–7.19] p = 0.001
≥ 80 years 5.69 [2.61–12.42] p < 0.001
Female sex (Male sex-reference) .95 [.58–1.57] p = 0.048
Oxygen saturation < 94% (≥ 94% -reference) 2.49 [1.49–4.18] p = 0.001
MAP (> 80 mmHg-reference)
≤ 80 mmHg 1.4 [.93–2.12] p = 0.109
≤ 70 mmHg 4.34 [2.52–7.48] p < 0.001
≤ 60 mmHg 20.53 [4.73–89.0] p < 0.001
INR > 1.2 (≤ 1.2-reference) 1.24 [.74–2.06] p = 0.04
Creatinine > 150 µmol/L (≤ 150 µmol/L-reference) 1.59 [.83–3.03] p = 0.016
BUN > 30 mg/dL (≤ 30 mg/dL-reference) 1.53 [.79–2.96] p = 0.02
IL-6 > 150 pg/ml (≤ 150 pg/ml-reference) 2.06 [1.07–3.96] p = 0.03
CRP > 10 mg/L (≤ 10 mg/L-reference) 1.49 [.85–2.64] p = 0.016
Procalcitonin > 0.1 ng/ml (≤ 0.1 ng/ml-reference) 4.19 [2.01–8.75] p < 0.001
Table 3. Multiple logistic regression analysis for in-hospital mortality in the derivation cohort. MAP mean
arterial pressure, INR international normalized ratio, BUN Blood urea nitrogen, IL-6 Interleukin-6 CRP
C-Reactive protein.
Scientific Reports | (2020) 10:16726 | https://doi.org/10.1038/s41598-020-73962-9 4
Vol:.(1234567890)www.nature.com/scientificreports/
Scoring factors Beta coefficient BCa 95% CI Score assigned
Age
≥ 60 years 0.882 0.218–1.67 1
≥ 70 years 1.064 0.434–1.822 2
≥ 80 years 1.500 0.883–2.347 3
Oxygen saturation
< 94% 0.739 0.285–1.252 1
MAP
≤ 80 mmHg 0.259 0.428–0.911 1
≤ 70 mmHg 1.43 0.561–2.34 2
≤ 60 mmHg 22.96 21.90–24.31 3
BUN
> 30 mg/dL 0.495 0.053–1.063 1
CRP
> 10 mg/L 0.660 0.78–1.069 1
INR
> 1.2 0.130 0.486–0.743 1
Total score 10
Table 4. Point allocation for predictors of COVID-19 in-hospital mortality. MAP mean arterial pressure, INR
international normalized ratio, BUN Blood urea nitrogen, CRP C-Reactive protein.
Figure 1. ROC curve analysis in derivation cohort. Area under the curve (AUC) of the COVID-19 in-hospital
mortality score in the 2355 patients that constituted the derivation cohort.
of in-hospital mortality. Furthermore, the Hosmer–Lemeshow goodness of fit test of tenfold cross-validation
did not reach statistical significance (P = 0.244) indicating a good match of predicted risk over observed risk.
Finally, we applied the score to the 2356 patients in the validation cohort. The ROC curve analysis showed
an AUC of 0.798 (95% CI 0.789–0.818) still indicating a useful discrimination for our model (Fig. 2A). Then, we
determined that low risk patients (0–3 points) had a 11.8% risk of mortality, moderate risk patients (4–7 points)
had a 39% risk of mortality and high-risk patients (> 7 points) had a 78% risk of mortality (Fig. 2B).
Scientific Reports | (2020) 10:16726 | https://doi.org/10.1038/s41598-020-73962-9 5
Vol.:(0123456789)www.nature.com/scientificreports/
Figure 2. Validation of COVID-19 severity score. (a) Area under the curve (AUC) of the COVID-19
in-hospital mortality score in the 2356 patients that constituted the validation cohort. (b) Percentage death
patients in low, moderate and high-risk categories.
Discussion
We propose a novel scoring system to aid in the prediction of inpatient mortality for patients presenting with
SARS-CoV-2 infection to hospital emergency rooms. The score is based on simple pragmatic demographic data,
and presenting biomarker values. This score incorporates the unique constellation of various presentations in
which COVID-19 can manifest in severe illness. We avoided incorporating mechanical ventilation use into the
score as this was tied to a clinical decision, which over time with more knowledge an approach that changed.
While IL-6 also seems to predict mortality, we avoided incorporating this biomarker, as it is a non-routine test,
and were not available in a large percentage of our patient population. As of yet there are no scoring systems
created that are specific to the elements of COVID-19 illness manifestations and that can predict mortality.
The limitations of this study are its retrospective design, its cohort, which is primarily a minority urban
population, and the epoch at which the data was required. Since the data and outcomes were recorded during
the highest surge of the pandemic this may bias the results towards higher mortality as this was a great strain on
treating hospitals at the time. Prior reports also have shown increased mortality in racial and ethnic minority
patients17. Given the sociodemographic background of our patient population the score may again be biased
towards higher mortality risk. While the design of the study may limit its generalizability to other populations,
these findings are meaningful in that they are specifically applicable to minority urban centers that are suffering
from large surge populations of infected patients, which in the first wave of the pandemic across the United States
of America suffered the most. The encountered mortality rate is certainly high, but most likely the result of the
high comorbidity burden in our population, the fact that all of these patients had enough symptom severity to
warrant admission, and the fact that the study period was early in the pandemic when there was limited under-
standing regarding the disease. Nonetheless, given the diverse patient population of the Bronx, it is possible that
this score can be generalized to other large inner-city populations. Future research is needed to validate this score
in other populations, as well as to compare this score to the SOFA and ISTH DICS score. The health network from
which this data was captured is comprised of a network of 3 major hospitals in the Bronx in New York City, one
of which is a large quaternary care facility accepting transfers for complex and severely ill patients in the region
beyond the Bronx into Westchester County. The mortality rates reported here are for hospitalized patients who
tended to be older and more severely affected than others infected with the virus. Hence the mortality rate for
hospitalized patients is higher than the more commonly reported case-fatality rate that reflects the number of
deaths per documented infection. In any case, the rates reported here are broadly comparable to mortality rates
for hospitalized patients in other countries at comparable time points in their respective pandemic outbreaks:
China—48%4, Italy—26%18, and New York—21%19.
The mortality rates were slightly different between the training set (26.4%) and the testing set (22.4%). This is
likely secondary to the temporal difference between the sets. During the first 3 weeks of the pandemic surge, there
was still little known about optimal management strategies for severely ill patients. As time went on, mortality
rates decreased. In addition, there was more community awareness of the potential impact of the virus and it is
possible patients were more likely to seek medical attention sooner and arrived in less severe states. Despite this
mortality rate differences, the severity score itself remained valid. There were also variances in racial distribu-
tion between the two cohorts. Despite these differences in race, the severity score remained valid in predicting
in-hospital mortality.
Scientific Reports | (2020) 10:16726 | https://doi.org/10.1038/s41598-020-73962-9 6
Vol:.(1234567890)www.nature.com/scientificreports/
In other metropolitan areas outside of New York City there have been reports of racial disparity and outcome,
we found no difference in mortality rates between r aces17,20. There are a number of possibilities why. The Bronx
is uniquely diverse in its racial and ethnic populations however also one of the poorest regions in the United
States of America with median income of $38,085 and 27.3% of persons living in p overty21. One reason could
be that other social determinants of health, including poverty level are more powerful predictors of mortality
rather than race alone.
While mortality prediction is neither perfect nor absolute, having a simple score to predict how severe a
patient’s illness and hospital course will be, can aid admitting and emergency room physician’s ability to triage
severity and predict prognosis during surge periods. This can also be used to guide recommendations for pal-
liative care consultation early in a patient’s hospital course.
Received: 15 July 2020; Accepted: 22 September 2020
Reference
1. City DoHNY. COVID-19 Data. Department of Health, New York City. https://www1.nyc.gov/site/doh/covid/covid-19-data.page
(2020)
2. Total International Passenger Traffic. https: //aci.aero/news/2019/03/13/prelim
inary -world- airpor t-traffi c-rankin
gs-releas ed/ (2019)
3. Medicine JHU. Johns Hopkins Coronavirus Resource Center.https://coronavirus.jhu.edu/ (2020)
4. Zhou, F. et al. Clinical course and risk factors for mortality of adult inpatients with COVID-19 in Wuhan, China: a retrospective
cohort study. Lancet 395, 1054–1062. https://doi.org/10.1016/S0140-6736(20)30566-3 (2020).
5. Yang, X. et al. Clinical course and outcomes of critically ill patients with SARS-CoV-2 pneumonia in Wuhan, China: a single-
centered, retrospective, observational study. Lancet Respir. Med. 8, 475–481. https: //doi.org/10.1016/S2213- 2600(20)30079- 5 (2020).
6. Richardson, S. et al. Presenting characteristics, comorbidities, and outcomes among 5700 patients hospitalized With COVID-19
in the New York City Area. JAMA https://doi.org/10.1001/jama.2020.6775 (2020).
7. Cheng, Y. et al. Kidney disease is associated with in-hospital death of patients with COVID-19. Kidney Int. 97, 829–838. https://
doi.org/10.1016/j.kint.2020.03.005 (2020).
8. Wu, S. et al. Identification and validation of a novel clinical signature to predict the prognosis in confirmed COVID-19 patients.
Clin Infect Dis https://doi.org/10.1093/cid/ciaa793 (2020).
9. Huang, C. et al. Clinical features of patients infected with 2019 novel coronavirus in Wuhan China. Lancet. 395, 497–506. https://
doi.org/10.1016/S0140-6736(20)30183-5 (2020).
10. Iba, T., Levy, J. H., Levi, M. & Thachil, J. Coagulopathy in COVID-19. J Thromb. Haemost. https: //doi.org/10.1111/jth.14975 (2020).
11. Vincent, J. L. et al. The SOFA (Sepsis-related Organ Failure Assessment) score to describe organ dysfunction/failure. On behalf of
the working group on sepsis-related problems of the european society of intensive care medicine. Intensive Care Med. 22, 707–710.
https://doi.org/10.1007/BF01709751 (1996).
12. Taylor, F. B., Toh, C. H., Hoots, W. K., Wada, H. & Levi, M. (ISTH) SSoDICDotISoTaH. Towards definition, clinical and laboratory
criteria, and a scoring system for disseminated intravascular coagulation. Thromb Haemost. 86, 1327–1330 (2001).
13. Sivula, M., Tallgren, M. & Pettilä, V. Modified score for disseminated intravascular coagulation in the critically ill. Intensive Care
Med. 31, 1209–1214. https://doi.org/10.1007/s00134-005-2685-2 (2005).
14. Thachil, J. et al. ISTH interim guidance on recognition and management of coagulopathy in COVID-19. J. Thromb Haemost. 18,
1023–1026. https://doi.org/10.1111/jth.14810 (2020).
15. Hong, W. et al. Development and validation of a risk prediction score for severe acute pancreatitis. J. Transl Med. 17, 146. https://
doi.org/10.1186/s12967-019-1903-6 (2019).
16. Hayes, T., Usami, S., Jacobucci, R. & McArdle, J. J. Using classification and regression trees (CART) and random forests to analyze
attrition: Results from two simulations. Psychol. Aging. 30, 911–929. https://doi.org/10.1037/pag0000046 (2015).
17. Price-Haywood, E. G., Burton, J., Fort, D. & Seoane, L. Hospitalization and mortality among black patients and white patients
with Covid-19. N Engl J Med. 382, 2534–2543. https://doi.org/10.1056/NEJMsa2011686 (2020).
18. Grasselli, G. et al. Baseline characteristics and outcomes of 1591 patients infected With SARS-CoV-2 admitted to ICUs of the
Lombardy Region, Italy. JAMA https://doi.org/10.1001/jama.2020.5394 (2020).
19. Cummings, M. J. et al. Epidemiology, clinical course, and outcomes of critically ill adults with COVID-19 in New York City: a
prospective cohort study. medRxiv https://doi.org/10.1101/2020.04.15.20067157 (2020).
20. Gu, T. et al. COVID-19 outcomes, risk factors and associations by race: a comprehensive analysis using electronic health records
data in Michigan Medicine. medRxiv https://doi.org/10.1101/2020.06.16.20133140 (2020).
21. United States Census Bureau. https://www.census.gov/quickfacts/bronxcountybronxboroughnewyork (2020)
Author contributions
D.J.A.: Conceptualization, Methodology, Investigation, Writing-Original Draft, Review & Editing. S.R.U.: Con-
ceptualization, Methodology, Formal Analysis, Investigation, Writing-Original Draft, Review & Editing. J.B.:
Investigation, Methodology. R.G.R.: Conceptualization, Methodology, Investigation, Methodology. P.C.: Con-
ceptualization, Methodology, Investigation, Methodology. M.M.: Conceptualization, Investigation, Methodology.
E.E.: Conceptualization, Methodology, Visualization, Supervision, Writing-Review & Editing.
Competing interests
The authors declare no competing interests.
Additional information
Supplementary information is available for this paper at https://doi.org/10.1038/s41598-020-73962-9.
Correspondence and requests for materials should be addressed to D.J.A. or S.R.U.
Reprints and permissions information is available at www.nature.com/reprints.
Publisher’s note Springer Nature remains neutral with regard to jurisdictional claims in published maps and
institutional affiliations.
Scientific Reports | (2020) 10:16726 | https://doi.org/10.1038/s41598-020-73962-9 7
Vol.:(0123456789)www.nature.com/scientificreports/
Open Access This article is licensed under a Creative Commons Attribution 4.0 International
License, which permits use, sharing, adaptation, distribution and reproduction in any medium or
format, as long as you give appropriate credit to the original author(s) and the source, provide a link to the
Creative Commons licence, and indicate if changes were made. The images or other third party material in this
article are included in the article’s Creative Commons licence, unless indicated otherwise in a credit line to the
material. If material is not included in the article’s Creative Commons licence and your intended use is not
permitted by statutory regulation or exceeds the permitted use, you will need to obtain permission directly from
the copyright holder. To view a copy of this licence, visit http://creativecommons.org/licenses/by/4.0/.
© The Author(s) 2020
Scientific Reports | (2020) 10:16726 | https://doi.org/10.1038/s41598-020-73962-9 8
Vol:.(1234567890)You can also read