Development and validation of a risk stratification model for predicting the mortality of acute kidney injury in critical care patients
←
→
Page content transcription
If your browser does not render page correctly, please read the page content below
Original Article
                                                                                                                                         Page 1 of 15

Development and validation of a risk stratification model for
predicting the mortality of acute kidney injury in critical care
patients
Haofan Huang1#, Yong Liu2#, Ming Wu3, Yi Gao1, Xiaxia Yu1
1
School of Biomedical Engineering, Health Science Center, Shenzhen University, Shenzhen, China; 2Department of Intensive Care Unit, Shenzhen
Hospital, Southern Medical University, Shenzhen, China; 3Department of Critical Care Medicine & Infection Prevention and Control, The Second
People’s Hospital of Shenzhen & First Affiliated Hospital of Shenzhen University, Health Science Center, Shenzhen, China
Contributions: (I) Conception and design: H Huang, Y Liu; (II) Administrative support: M Wu; (III) Provision of study materials or patients: Y Gao; (IV)
Collection and assembly of data: X Yu, M Wu; (V) Data analysis and interpretation: X Yu, H Huang; (VI) Manuscript writing: All authors; (VII) Final
approval of manuscript: All authors.
#
These authors contributed equally to this work.
Correspondence to: Xiaxia Yu; Yi Gao. School of Biomedical Engineering, Health Science Center, Shenzhen University, Shenzhen, China.
Email: xiaxiayu@szu.edu.cn; gaoyi@szu.edu.cn.

                 Background: This study aimed to develop and validate a model for mortality risk stratification of intensive
                 care unit (ICU) patients with acute kidney injury (AKI) using the machine learning technique.
                 Methods: Eligible data were extracted from the Medical Information Mart for Intensive Care (MIMIC-
                 III) database. Calibration, discrimination, and risk classification for mortality prediction were evaluated
                 using conventional scoring systems and the new algorithm. A 10-fold cross-validation was performed. The
                 predictive models were externally validated using the eICU database and also patients treated at the Second
                 People’s Hospital of Shenzhen between January 2015 to October 2018.
                 Results: For the new model, the areas under the receiver operating characteristic curves (AUROCs) for
                 mortality during hospitalization and at 28 and 90 days after discharge were 0.91, 0.87, and 0.87, respectively,
                 which were higher than for the Simplified Acute Physiology Score (SAPS II) and Sequential Organ Failure
                 Assessment (SOFA). For external validation, the AUROC was 0.82 for in-hospital mortality, higher than
                 SOFA, SAPS II, and Acute Physiology and Chronic Health Evaluation (APACHE) IV in the eICU database,
                 but for the 28- and 90-day mortality, the new model had AUROCs (0.79 and 0.80, respectively) similar to
                 that of SAPS II in the SZ2 database. The reclassification indexes were superior for the new model compared
                 with the conventional scoring systems.
                 Conclusions: The new risk stratification model shows high performance in predicting mortality in ICU
                 patients with AKI.

                 Keywords: Acute kidney injury (AKI); intensive care unit (ICU); machine learning; in-hospital mortality; severity
                 score

                 Submitted Aug 06, 2020. Accepted for publication Nov 26, 2020.
                 doi: 10.21037/atm-20-5723
                 View this article at: http://dx.doi.org/10.21037/atm-20-5723

© Annals of Translational Medicine. All rights reserved.                     Ann Transl Med 2021;9(4):323 | http://dx.doi.org/10.21037/atm-20-5723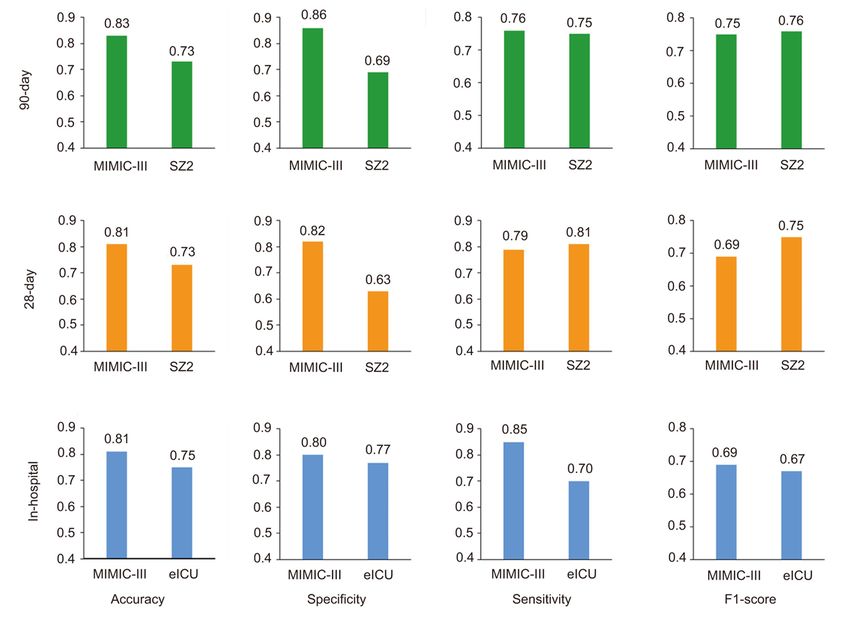
Page 2 of 15                                                             Huang et al. Risk model for mortality of AKI patients in ICU

Introduction                                                           Therefore, this study aimed to develop a risk
                                                                    stratification system for ICU patients with AKI at admission
Acute kidney injury (AKI) is a common but complex disease
                                                                    using machine-learning. We present the following article in
in critically ill patients, leading to high morbidity and
                                                                    accordance with the TRIPOD reporting checklist (available
mortality (1,2). In addition, AKI is associated with increased
                                                                    at http://dx.doi.org/10.21037/atm-20-5723).
length of hospital stay (LOS), total health-related costs, and
mortality (3-6). In-hospital mortality in patients with AKI
has recently been estimated to be between 20% and 25%               Methods
(7,8), while critically ill patients with AKI requiring dialysis
                                                                    Study population
have a mortality rate exceeding 50% (9,10). Currently,
the diagnosis criteria for AKI mostly depend on serum               This study is a cohort retrospective study based on three
creatinine (SCr) assessment (3), and diagnosing AKI based           different population. Three databases were used: the
on SCr might delay AKI detection, leading to a more                 publicly available Medical Information Mart for Intensive
advanced stage at diagnosis and irreversible damage and             Care (MIMIC-III) database (24) (internal validation), the
loss of organ function (11). Therefore, the development of          publicly available eICU Collaborative Research Database
new predictive models for risk stratification in patients with      (external validation), and Shenzhen Second Renmin
AKI in the intensive care unit (ICU) is crucial in reducing         Hospital database (SZ2) (also external validation). In this
unnecessary kidney stress and improving patient outcomes            study, all patients diagnosed with AKI in the ICU according
(4,12).                                                             to the diagnostic criteria described in the “Kidney Disease
   The burden of care for critically ill patients is massive.       Improving Global Outcomes” (KDIGO) clinical practice
The basis of critical care is a risk stratification approach for    guidelines were included according to the diagnostic
classifying patients by severity levels and thus optimizing         codes in the hospital information system (25). Therefore,
personal care. Precision delivery is based on this prediction-      the diagnosis of AKI was: (I) increase in SCr ≥0.3 mg/dL
personalization approach, deployed precisely at the right           within 48 h or ≥50% within 7 days, and (II) urine output
moment in the course of clinical management for improved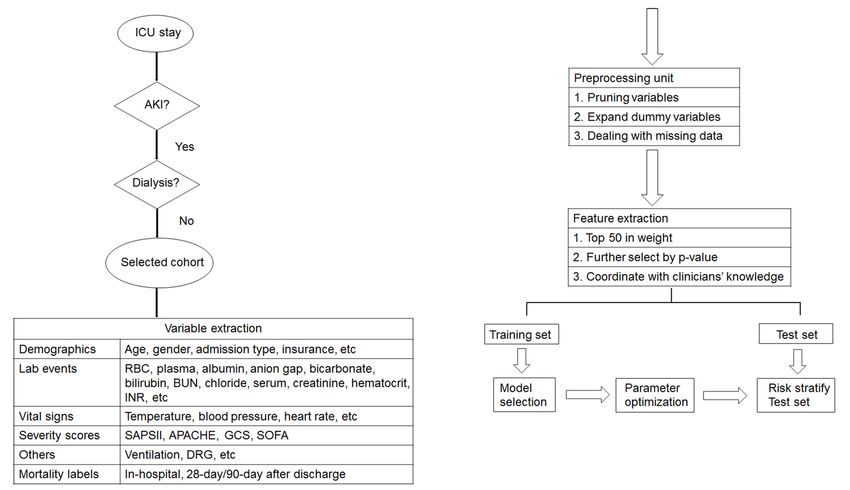
Annals of Translational Medicine, Vol 9, No 4 February 2021 Page 3 of 15
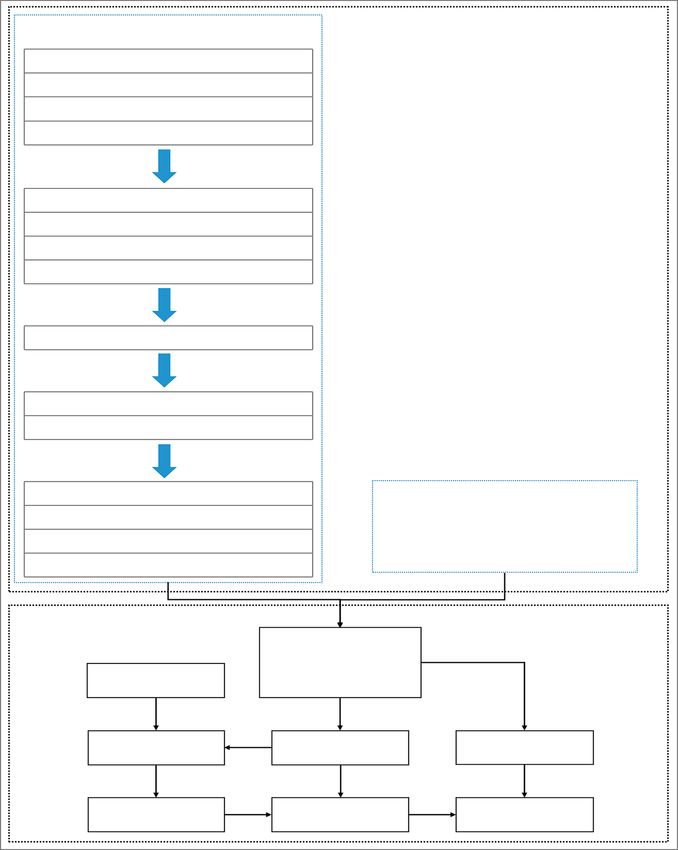
Physiology (LCP) at the Massachusetts Institute of Figure 1.
Technology (MIT) and the eICU Research Institute (eRI)
at Philips Healthcare (31). A total of 1,087 events made
Prediction algorithm
by a total of 1,063 patients were included from the eICU
database. In this study, the proposed algorithm was built based on the
The other external dataset was obtained from our local random forest algorithm method (32) with improvement in
hospital, and a total of 84 randomly selected patients feature selection (Figure 2) and consisted of two steps:
with AKI admitted to the general adult ICU in the (I) Feature selection. Because the relative rank of
Second People’s Hospital of Shenzhen (a tertiary-care each feature could be used to reflect its relative
teaching hospital) from January 2015 to October 2018 significance (12-14), a random forest algorithm was
were included. The study was approved by the ethics first applied to rank the contributions of the various
committee of the Second People’s Hospital of Shenzhen features. Then, a stepwise multivariable regression
(#20180515001). For the data from this hospital, informed analysis was performed to further screen the selected
consent was obtained from all patients or their families by variables. Variables with P2 mmol/L despite by fitting a main-term logistic regression model
adequate volume resuscitation. The exclusion criteria were to our data using the same explanatory variables as
(I)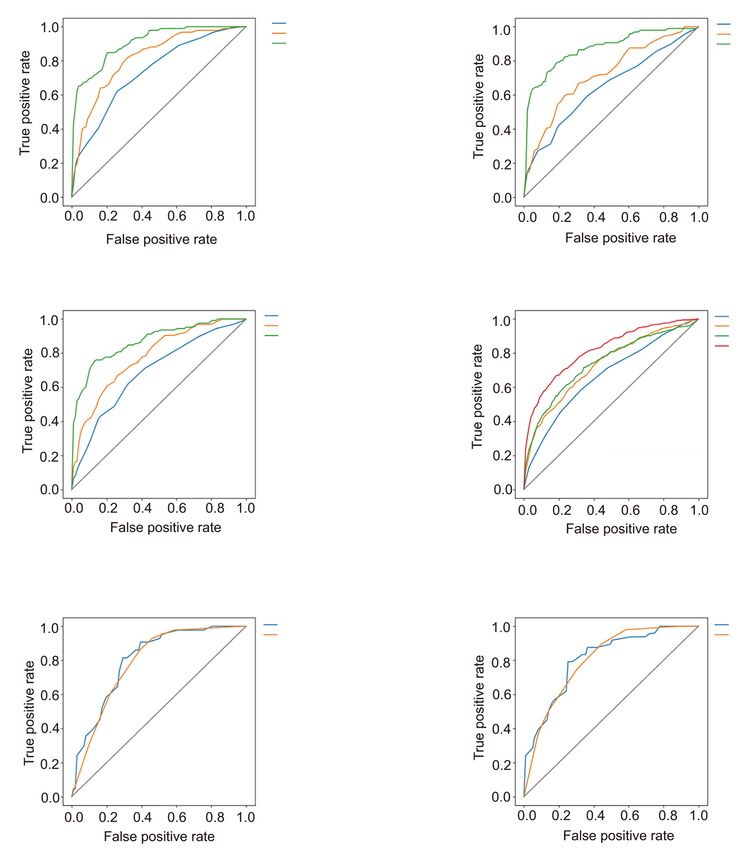
Page 4 of 15                                                                Huang et al. Risk model for mortality of AKI patients in ICU

Figure 1 Flowchart of data processing. ICU, intensive care unit; AKI, acute kidney injury; RBC, red blood cell; BUN, blood urea nitrogen;
INR, international normalized ratio; SOFA, Sequential Organ Failure Assessment; SAPS II, Simplified Acute Physiology Score II;
APACHE, Acute Physiology and Chronic Health Evaluation.

prediction algorithm would satisfy the logistic regression             laboratory results, and admission diagnoses were compared
equation (22). Summary reclassification measures, including            among databases by the Kruskal-Wallis rank-sum test, chi-
continuous net reclassification index (cNRI) and integrated            square test, or Fisher’s exact test, as appropriate. P
Annals of Translational Medicine, Vol 9, No 4 February 2021                                                                                       Page 5 of 15

                                      Machine knowledge

                         Clean data of AKI patients from MIMIC-III
                         - 11,809 patients
                         - 12,974 inspection records
                         - 954 variables recorded

                         Random forest classifier
                         1. 40 rounds, 10-fold cross validation
                         2. Calculate feature importance

                                                                                                                              Feature Selection
                         3. Rank the importance by rounds

                         Top 50 variables selected

                         Logistic regression
                         - Screen the importance by P value

                         Select features with P value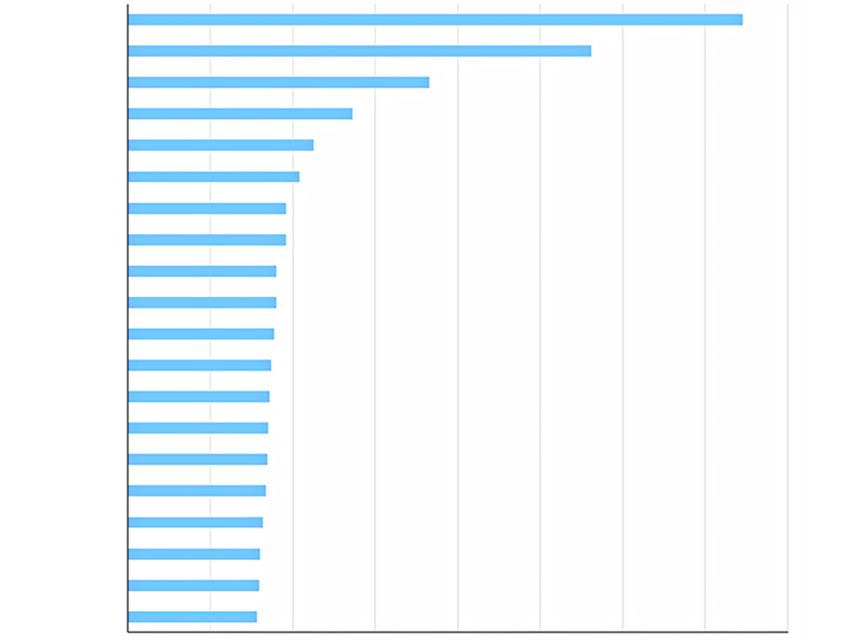
Page 6 of 15                                                                 Huang et al. Risk model for mortality of AKI patients in ICU

 Table 1 Characteristics of the study population
 Data source                                          MIMIC-III                  eICU                          SZ2                P value

 N                                                      3,540                    1,087                          84

 Age (years)                                   65.96 (52.72, 78.33)       67.00 (57.50, 78.00)         67.00 (52.75, 78.25)       0.009

 Length of stay in ICU (days)                      4.07 (2.18, 8.14)       3.79 (1.96, 7.79)            7.00 (3.00, 19.25)
Annals of Translational Medicine, Vol 9, No 4 February 2021                                                                        Page 7 of 15

                                       CMO
                                        DNR
                                     SAPS II
                                Urine output
                                       SOFA
                                  Anion gap
                                        BUN
                                     Lactate
                                     SYSBP
                                   Total CO2
                                Bicarbonate
                                     Platelet
                                   Resprate
                                         Age
                                         INR
                                          PT
                                       WBC
                                        LOS
                                         PTT
                                    Sodium
                                                0   0.01   0.02   0.03     0.04    0.05   0.06   0.07    0.08
                                                                         Importance

Figure 3 Variables selected by machine knowledge, ranking by their importance levels. AKI, acute kidney injuries. CMO, comfort measures
only; DNR, do not resuscitate; SAPS II, Simplified Acute Physiology Score II; SOFA, Sequential Organ Failure Assessment; BUN, blood
urea nitrogen; SYSBP, systolic blood pressure; INR, international normalized ratio; PT, prothrombin time; WBC, white blood cells; LOS,
length of stay; PTT, partial thromboplastin time.

on identifying patient mortality during hospitalization                          The accuracies, specificities, sensitivities, and F1 scores
(Model_inpatient) and at 28 (Model_28) and 90 (Model_90)                     of the new risk stratification model for internal and external
days after discharge. The AUROCs for Model_inpatient,                        validation are shown in Figure 5. Even though external
Model_28, and Model_90 were 0.91, 0.87, and 0.87,                            validation performed well, internal validation results were
respectively. Compared with traditional scoring systems                      slightly better in general.
(SAPS II and SOFA), all three newly developed models
had better predictive performances based on AUROCs
                                                                             Discrimination and calibration
(Figure 4A,B,C).
   The performances of the three models were externally                      To better evaluate the discrimination potential of our
validated in the eICU and SZ2 dataset. Since eICU only has                   predicted results, the whole population was grouped
inpatient records, while SZ2 only records post-discharge                     into five categories based on predicted risk scores. The
mortality, Model_inpatient was evaluated in the eICU                         observed mortality rate was determined for each group.
dataset and Model_28 and Model_90 in the SZ2 dataset. The                    As demonstrated in Table 2, the lower the relative rate
ROC curves for hospital mortality prediction in the external                 of patient mortality, the lower the predicted risk score,
validation are provided in Figure 4D,E,F. For the eICU                       especially in patients with risk scores greater than 60%
dataset, AUROCs were 0.67 and 0.73 for the SOFA and                          or lower than 20%. These results suggested that the new
SAPS II scores, respectively; similar results were obtained                  algorithm could successfully identify survivors and non-
for the APACHE IV, which yielded an AUROC of 0.74.                           survivors, especially among patients with very high (0.8–1.0)
Model_inpatient substantially outperformed the traditional                   and low (
Page 8 of 15 Huang et al. Risk model for mortality of AKI patients in ICU
A SOFA (AUC =0.73) B SOFA (AUC =0.64)
SAPSII (AUC =0.82) SAPSII (AUC =0.72)
minic_hos (AUC =0.91) minic_28 (AUC =0.87)
C SOFA (AUC =0.69)
D SOFA (AUC =0.67)
SAPSII (AUC =0.78) SAPSII (AUC =0.73)
minic_90 (AUC =0.87) APACHE IV (AUC =0.74)
elCU (AUC =0.82)
E SAPSII (AUC =0.80) F SAPSII (AUC =0.81)
Sz2_28 (AUC =0.79) Sz2_90 (AUC =0.80)
Figure 4 Performances of the newly developed prediction models and traditional scoring systems for internal and external validation.
Internal validation performance: The new predictive model targeted on identifying patient mortality in the MIMIC-III database during
hospitalization (A), and at 28 (B) and 90 (C) days, versus the SOFA and SAPS II models. External validation performance: (D) the new
predictive model targeted on identifying patient mortality during hospitalization in eICU database, versus the SOFA, SAPS II, and
APACHE IV models. (E) The new predictive model targeted on identifying 28-day mortality after discharge in the SZ2 database, versus the
SAPS II model. (F) The new predictive model targeted on identifying 90-day mortality after discharge in the SZ2 database, versus the SAPS
II model. SOFA, Sequential Organ Failure Assessment; SAPS II, Simplified Acute Physiology Score II; APACHE, Acute Physiology and
Chronic Health Evaluation.
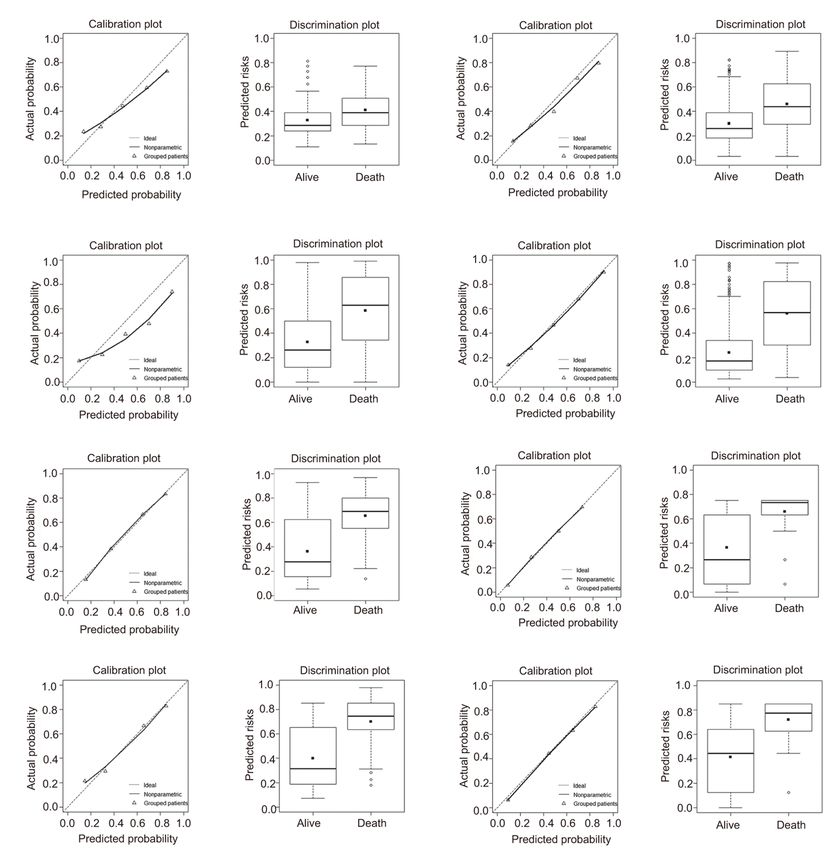
the APACH IV score, and 0.32 for the RF score. The plots entire range of death probability.
indicated a lack of fit for the traditional scores.
Prediction based on the RF exhibited excellent
Reclassification
calibration properties (Figure 6), as reflected by a Brier
scores of 0.159 (χ2=4.185, P=0.84) for Model_inpatient, We calculated the risk of each individual in the entire
0.177 (χ 2 =0.064, P=0.969) for Model_28, and 0.170 external validation cohort and divided all patients into three
(χ 2=0.472, P=0.79) for Model_90. The calibration plots groups based on the risk cut-off at 95% sensitivity and 95%
indicated a lack of fit for the traditional scoring methods. specificity (37). The reclassification tables involving the RF
The newly developed algorithm performed better for the score and traditional scores are provided in Table 3. The
© Annals of Translational Medicine. All rights reserved. Ann Transl Med 2021;9(4):323 | http://dx.doi.org/10.21037/atm-20-5723Annals of Translational Medicine, Vol 9, No 4 February 2021 Page 9 of 15
Figure 5 Predictive performances of the new proposed models. Predictive performances measured by accuracy, specificity, and sensitivity
of the three predictive models for mortality during hospitalization, and at 28 and 90 days after discharge, respectively, based on the internal
MIMIC-III database and two external validation datasets (the eICU database for mortality during hospitalization, and the SZ2 dataset for
28/90-day mortality).
Table 2 Relative risk ratios for various risk groups in both external validation datasets
Model_inpatient Model_28 Model_90
Risk
Patients, n Mortality, % RR Patients, n Mortality, % RR Patients, n Mortality, % RR
>80% 221 81.40 2.3 17 76.50 1.5 17 82.40 1.4
60–79% 216 43.50 1.2 17 70.60 1.4 17 70.60 1.2
40–59% 216 26.40 0.7 16 62.50 1.2 17 70.60 1.2
20–39% 220 18.60 0.5 17 41.20 0.8 16 50 0.9Page 10 of 15 Huang et al. Risk model for mortality of AKI patients in ICU A B C D E F G H Figure 6 Calibration and discrimination potentials of the new RF-based algorithm and traditional scoring systems in external validation. (A,B,C,D) In-hospitalization mortality. (A) SOFA score (Brier score =0.210; χ2=4.992, P=0.759; discrimination slope =0.085); (B) SAPS II score (Brier score =0.192; χ2=7.188, P=0.517; discrimination slope =0.16); (C) APACHE IV score (Brier score =0.203; χ2=249.148, P=0; discrimination slope =0.257); (D) the newly developed algorithm (Brier score =0.159; χ2=4.185, P=0.84; discrimination slope =0.32). (E,F) Mortality within 28 days after discharge. (E) 28_SAPS II score (Brier score =0.177; χ2=1.181, P=0.554; discrimination slope =0.291); (F) 28_RF score (Brier score =0.177; χ2=0.064, P=0.969; discrimination slope =0.294). (G,H) Mortality within 90 days after discharge. (G) 90_SAPS II score (Brier score =0.172; χ2=0.404, P=0.817; discrimination slope =0.302); (H) 90_RF (Brier score =0.170; χ2=0.472, P=0.79; discrimination slope =0.306). SOFA, Sequential Organ Failure Assessment; SAPS II, Simplified Acute Physiology Score II; APACHE, Acute Physiology and Chronic Health Evaluation. © Annals of Translational Medicine. All rights reserved. Ann Transl Med 2021;9(4):323 | http://dx.doi.org/10.21037/atm-20-5723
Annals of Translational Medicine, Vol 9, No 4 February 2021                                                                         Page 11 of 15

 Table 3 Reclassification (reclassification tables)
                                                  Predicted probability according to
                                                                                                                       Statistics
 Initial model            Updated model                      initial model             % Reclassified
                                                      64%                               NRI (95% CI)               P

 SOFA                     Model_inpatient                                                                  0.628 (0.555–0.701)
Page 12 of 15 Huang et al. Risk model for mortality of AKI patients in ICU
Table 4 Reclassification (reclassification statistics)
Model_inpatient Model_28 Model_90
SOFA
cNRI 0.864 (0.752, 0.977) – –
IDI 0.235 (0.207, 0.263) – –
SAPS II
cNRI 0.814 (0.700, 0.928) 0.001 (–0.427, 0.429) 0.097 (–0.334, 0.529)
IDI 0.160 (0.136, 0.184) 0.003 (–0.074, 0.079) 0.005 (–0.075, 0.085)
APACHE IV
cNRI 0.205 (0.084, 0.327) – –
IDI 0.063 (0.031, 0.095) – –
SOFA, Sequential Organ Failure Assessment; SAPS II, Simplified Acute Physiology Score II; APACHE, Acute Physiology and Chronic
Health Evaluation; cNRI, continuous net reclassification index; IDI, integrated discrimination improvement.
A 1.0
B 1.0
Standardized Net Benefit
Standardized Net Benefit
0.8 0.8
0.6 0.6
0.4 0.4
0.2 0.2
0.0 0.0
–0.2 –0.2
0.0 0.2 0.4 0.6 0.8 1.0 0.0 0.2 0.4 0.6 0.8 1.0
High Risk Threshold High Risk Threshold
1:100 1:4 2:3 3:2 4:1 100:1 1:100 1:4 2:3 3:2 4:1 100:1
Cost: Benefit Ratio Cost: Benefit Ratio
C
1.0
Standardized Net Benefit
0.8
0.6
0.4
0.2
0.0
–0.2
0.0 0.2 0.4 0.6 0.8 1.0
High Risk Threshold
1:100 1:4 2:3 3:2 4:1 100:1
Cost: Benefit Ratio
Figure 7 DCA of the new RF-based algorithm and traditional scoring systems in external validation. (A) In-hospitalization mortality; (B)
mortality within 28 days after discharge; (C) mortality within 90 days after discharge. DCA, decision curve analysis.
model was superior in predicting mortality in ICU patients KDIGO definition of AKI (25), a tree-based predictive
with AKI compared with the conventional severity scoring algorithm was proposed to build three predictive models
systems (SOFA, SAPS II, and APACHE IV) based on in- (Model_inpatient, Model_28, and Model_90). The
hospital mortality as well as mortality at 28 and 90 days prediction outcomes of these three models were mortality
post-discharge. during hospitalization and at 28 and 90 days after discharge,
Based on the retrospective MIMIC-III dataset and the respectively. Their performances were validated both
© Annals of Translational Medicine. All rights reserved. Ann Transl Med 2021;9(4):323 | http://dx.doi.org/10.21037/atm-20-5723Annals of Translational Medicine, Vol 9, No 4 February 2021 Page 13 of 15
internally and externally, both in terms of discrimination improve the quality of life of the patients. In addition,
and calibration, compared with traditional scoring systems. similar specific models could be developed for various
The results indicated that the tree-based predictive diseases to improve risk stratification.
algorithm was robust in building prediction models for The limitations of this study should be mentioned.
mortality during hospitalization and at 28 and 90 days after First, due to incomplete datasets, the current models
discharge. As shown above, the new model performed better could not be compared to all the widely used scoring
than the traditional scoring systems, including APACHE systems for predictive performance. The APACHE IV and
IV, SOFA, and SAPS II, which are commonly used to SOFA systems serve as references in most hospitals, and
stratify critically ill patients on the day of hospital admission performance comparison between each of these scores and
(38,39). The results showed that the lower the relative rate the proposed algorithm should be carried out, especially
of patient mortality, the lower the predicted risk score, in local hospitals. Second, since eICU only includes
indicating the excellent ability of our model in grading ICU inpatient records, while the SZ2 only contained mortality
patients with AKI. information after discharge, external validation of Model_
The proposed predictive model provides advantages inpatient was only possible based on eICU, while Model_28
over currently used systems. Unlike the traditional scoring and Model_90 could only be tested using the SZ2. Third,
systems, including SOFA, SAPS II, and APACHE IV, which there were differences in baseline features of patients
assess general disease severity scores, the developed method among the three sources, including the training (MIMIC-
is specific to AKI in ICU settings. Besides, the SOFA score III) and validation (eICU and SZ2) sets, which could bias
is based on logistic regression (40). The process leading the results. Nevertheless, validation was still good in the
to ICU death is highly complex, and accurately predicting different populations, demonstrating the generalizability
mortality through linear relationships with explanatory of these models. Third, the data from the public databases
variables is challenging. The newly proposed algorithm are limited. AKI stage and the changes in kidney condition
may also provide advantages over manual AKI detection during ICU stay could not be examined in this study.
methods, which might not be implemented unless a Finally, the sample size was relatively small in the validation
physician already suspects AKI and are subject to potential cohorts. Therefore, including additional variables and
human error. enlarging the sample size for external validation would be
Non-parametric techniques have been advocated for beneficial.
the early detection of AKI and ICU mortality prediction
but may not be applicable to AKI. Mohamadlou et al.
Conclusions
have developed a decision tree-based machine learning
algorithm with a strong predictive performance compared The prediction algorithms developed in this study have
with the SOFA score in terms of AUROC (41), but these a significantly improved performance compared with
results were challenged by Kim et al. (42), who reported currently available methods, including the SOFA, SAPS
no clear benefit from neural networks and support vector II, and APACHE IV systems, constituting promising
machines compared with APACHE-IV. Rather, in the tools for building mortality prediction models in both the
latter study, the optimal performance was achieved with a clinical and research settings. This model was developed
decision tree. to predict the in-hospital, 28-day (after discharge), and
Interestingly, the new algorithms were externally 90-day (after discharge) death risk of ICU patients who
validated for performance based on two separate datasets. developed AKI, thus guiding the physicians to pay more
In addition, its predictive ability, as well as calibration and attention to high-risk patients and anticipate potential
discrimination potential, were also tested. As shown above, complications.
the current models yielded good results in both datasets.
Therefore, this new algorithm might provide an efficient
Acknowledgments
real-time risk stratification tool because of its accuracy and
computational speed. Funding: This work was supported by the National Natural
Based on the above findings, the newly developed model Science Foundation of China (No. 61601302) and the
should be applied for the risk stratification of ICU patients Shenzhen peacock plan (No. KQTD2016053112051497);
with AKI, which would help provide appropriate care and the Startup funding for Youth Faculty by Shenzhen
© Annals of Translational Medicine. All rights reserved. Ann Transl Med 2021;9(4):323 | http://dx.doi.org/10.21037/atm-20-5723Page 14 of 15 Huang et al. Risk model for mortality of AKI patients in ICU
University (No. 2018009). guideline for acute kidney injury. Am J Kidney Dis
2013;61:649-72.
6. Silver SA, Chertow GM. The Economic Consequences of
Footnote
acute kidney injury. Nephron 2017;137:297-301.
Reporting Checklist: The authors have completed the 7. Susantitaphong P, Cruz DN, Cerda J, et al. World
TRIPOD reporting checklist. Available at http://dx.doi. incidence of AKI: a meta-analysis. Clin J Am Soc Nephrol
org/10.21037/atm-20-5723 2013;8:1482-93.
8. Selby NM, Kolhe NV, McIntyre CW, et al. Defining the
Conflicts of Interest: All authors have completed the ICMJE cause of death in hospitalised patients with acute kidney
uniform disclosure form (available at http://dx.doi. injury. PLoS One 2012;7:e48580.
org/10.21037/atm-20-5723). The authors have no conflicts 9. Palevsky PM, Zhang JH, O'Connor TZ, et al. Intensity
of interest to declare. of renal support in critically ill patients with acute kidney
injury. N Engl J Med 2008;359:7-20.
Ethical Statement: The authors are accountable for all 10. Uchino S, Bellomo R, Morimatsu H, et al. Continuous
aspects of the work in ensuring that questions related renal replacement therapy: a worldwide practice survey.
to the accuracy or integrity of any part of the work are The beginning and ending supportive therapy for the
appropriately investigated and resolved. The study was kidney (B.E.S.T. kidney) investigators. Intensive Care Med
conducted in accordance with the Declaration of Helsinki 2007;33:1563-70.
(as revised in 2013). The study was approved by the 11. Bagshaw SM, George C, Dinu I, et al. A multi-centre
institutional ethics board of the Second People’s Hospital of evaluation of the RIFLE criteria for early acute kidney
Shenzhen (No. 20180515001), and individual consent for injury in critically ill patients. Nephrol Dial Transplant
this retrospective analysis was waived. 2008;23:1203-10.
12. Lieske JC, Chawla L, Kashani K, et al. Biomarkers for
Open Access Statement: This is an Open Access article acute kidney injury: where are we today? Where should we
distributed in accordance with the Creative Commons go? Clin Chem 2014;60:294-300.
Attribution-NonCommercial-NoDerivs 4.0 International 13. Parikh RB, Schwartz JS, Navathe AS. Beyond genes and
License (CC BY-NC-ND 4.0), which permits the non- molecules - a precision delivery initiative for precision
commercial replication and distribution of the article with medicine. N Engl J Med 2017;376:1609-12.
the strict proviso that no changes or edits are made and the 14. Che Z, Purushotham S, Khemani R, et al. Interpretable
original work is properly cited (including links to both the deep models for ICU outcome prediction. AMIA Annu
formal publication through the relevant DOI and the license). Symp Proc 2017;2016:371-80.
See: https://creativecommons.org/licenses/by-nc-nd/4.0/. 15. Le Gall JR, Loirat P, Alperovitch A, et al. A simplified
acute physiology score for ICU patients. Crit Care Med
1984;12:975-7.
References
16. Vincent JL, Moreno R, Takala J, et al. The SOFA (Sepsis-
1. Hobson C, Ozrazgat-Baslanti T, Kuxhausen A, et al. Cost Related Organ Failure Assessment) score to describe organ
and mortality associated with postoperative acute kidney dysfunction/failure. Intensive Care Med 1996;22:707-10.
injury. Ann Surg 2015;261:1207-14. 17. Liu VX, Prescott HC. Precision delivery in critical care:
2. Chawla LS, Amdur RL, Amodeo S, et al. The severity of balancing prediction and personalization. In: Vincent JL.
acute kidney injury predicts progression to chronic kidney Annual update in intensive care and emergency medicine
disease. Kidney Int 2011;79:1361-9. 2019. Cham: Springer, 2019:15-27.
3. Pozzoli S, Simonini M, Manunta P. Predicting acute 18. Davoodi R, Moradi MH. Mortality prediction in intensive
kidney injury: current status and future challenges. J care units (ICUs) using a deep rule-based fuzzy classifier. J
Nephrol 2018;31:209-23. Biomed Inform 2018;79:48-59.
4. Lewington AJ, Sayed A. Acute kidney injury: how do we 19. Friedman J, Hastie T, Tibshirani R. The elements of
define it? Ann Clin Biochem 2010;47:4-7. statistical learning. New York: Springer series in statistics,
5. Palevsky PM, Liu KD, Brophy PD, et al. KDOQI US 2001.
commentary on the 2012 KDIGO clinical practice 20. Kuhn M, Johnson K. Applied predictive modeling. New
© Annals of Translational Medicine. All rights reserved. Ann Transl Med 2021;9(4):323 | http://dx.doi.org/10.21037/atm-20-5723Annals of Translational Medicine, Vol 9, No 4 February 2021 Page 15 of 15
York: Springer, 2013. 1996;24:123-40.
21. Salluh JI, Soares M. ICU severity of illness scores: 33. Cook NR. Use and misuse of the receiver operating
APACHE, SAPS and MPM. Curr Opin Crit Care characteristic curve in risk prediction. Circulation
2014;20:557-65. 2007;115:928-35.
22. Pirracchio R, Petersen ML, Carone M, et al. Mortality 34. Cook NR. Statistical evaluation of prognostic versus
prediction in intensive care units with the Super ICU diagnostic models: beyond the ROC curve. Clin Chem
Learner Algorithm (SICULA): a population-based study. 2008;54:17-23.
Lancet Respir Med 2015;3:42-52. 35. Pencina MJ, D'Agostino RB Sr, D'Agostino RB Jr, et al.
23. Husain-Syed F, Ronco C. The odyssey of risk stratification Evaluating the added predictive ability of a new marker:
in acute kidney injury. Nat Rev Nephrol 2018;14:660-2. from area under the ROC curve to reclassification and
24. Johnson AE, Pollard TJ, Shen L, et al. MIMIC-III, a freely beyond. Stat Med 2008;27:157-72; discussion 207-12.
accessible critical care database. Sci Data 2016;3:160035. 36. Kerr KF, Brown MD, Zhu K, et al. Assessing the clinical
25. Kidney Disease: Improving Global Outcomes (KDIGO) impact of risk prediction models with decision curves:
Acute Kidney Injury Work Group. KDIGO Clinical guidance for correct interpretation and appropriate use. J
Practice Guideline for Acute Kidney Injury. Kidney Inter Clin Oncol 2016;34:2534-40.
Suppl 2012;2:1-138. 37. Liang W, Yao J, Chen A, et al. Early triage of critically ill
26. Ali T, Khan I, Simpson W, et al. Incidence and outcomes COVID-19 patients using deep learning. Nat Commun
in acute kidney injury: a comprehensive population-based 2020;11:3543.
study. J Am Soc Nephrol 2007;18:1292-8. 38. Sun D, Ding H, Zhao C, et al. Value of SOFA, APACHE
27. Jenq CC, Tsai MH, Tian YC, et al. RIFLE classification IV and SAPS II scoring systems in predicting short-term
can predict short-term prognosis in critically ill cirrhotic mortality in patients with acute myocarditis. Oncotarget
patients. Intensive Care Med 2007;33:1921-30. 2017;8:63073-83.
28. Bellomo R, Ronco C, Kellum JA, et al. Acute renal 39. Lee JH, Hwang SY, Kim HR, et al. Effectiveness of the
failure - definition, outcome measures, animal models, sequential organ failure assessment, acute physiology
fluid therapy and information technology needs: the and chronic health evaluation II, and simplified acute
Second International Consensus Conference of the physiology score II prognostic scoring systems in paraquat-
Acute Dialysis Quality Initiative (ADQI) Group. Crit poisoned patients in the intensive care unit. Hum Exp
Care 2004;8:R204-12. Toxicol 2017;36:431-7.
29. Abhyankar S, Demner-Fushman D, Callaghan FM, et al. 40. Schoe A, Bakhshi-Raiez F, de Keizer N, et al. Mortality
Combining structured and unstructured data to identify a prediction by SOFA score in ICU-patients after cardiac
cohort of ICU patients who received dialysis. J Am Med surgery; comparison with traditional prognostic-models.
Inform Assoc 2014;21:801-7. BMC Anesthesiol 2020;20:65.
30. Alba AC, Agoritsas T, Walsh M, et al. Discrimination and 41. Mohamadlou H, Lynn-Palevsky A, Barton C, et al.
calibration of clinical prediction models: users' guides to Prediction of acute kidney injury with a machine learning
the medical literature. JAMA 2017;318:1377-84. algorithm using electronic health record data. Can J
31. Pollard TJ, Johnson AEW, Raffa JD, et al. The eICU Kidney Health Dis 2018;5:2054358118776326.
Collaborative Research Database, a freely available 42. Kim SY, Kim S, Cho J, et al. A deep learning model for
multi-center database for critical care research. Sci Data real-time mortality prediction in critically ill children. Crit
2018;5:180178. Care 2019;23:279.
32. Breiman L. Bagging predictors. Machine Learning
Cite this article as: Huang H, Liu Y, Wu M, Gao Y, Yu X.
Development and validation of a risk stratification model for
predicting the mortality of acute kidney injury in critical care
patients. Ann Transl Med 2021;9(4):323. doi: 10.21037/atm-20-
5723
© Annals of Translational Medicine. All rights reserved. Ann Transl Med 2021;9(4):323 | http://dx.doi.org/10.21037/atm-20-5723You can also read